Transcription
New York StateMedicaid Managed Care Program (MMC):CAHPS 5.0HAdult Medicaid SurveyMetroPlus Health PlanContinuous Quality Improvement ReportMay 20203975 Research Park DriveAnn Arbor, MI 48108
MetroPlus Health PlanTable of ContentsBackground1Executive Summary22345678Standard RatingsStandard CompositesKey Measure SummarySample ProfileSample DispositionResponse Rate ReportTrend AnalysisMethodology9IntroductionSurvey MilestonesSampling FrameQuestionnaireSelection of Cases for AnalysisDefinition of Achievement ScoresCompositesCorrelation to SatisfactionComparisonsStatistical TestingCase-Mix AnalysisUsing This Report12Graphs/Results1415193740Standard RatingsStandard CompositesMedical Assistance with Smoking CessationSingle ItemsCorrelation AnalysisMetroPlus Health PlanRating Question Details606162Responses by Question66Appendix A: QuestionnaireNew York State Department of Health DataStat, Inc.
MetroPlus Health PlanBackgroundBackgroundThe Consumer Assessment of Healthcare Providers and Systems (CAHPS ) survey is a comprehensivetool designed to assess consumers' experience with health care and health plans. CAHPS is thequestionnaire that asks health plan members about experiences with access to care, health care providersand health plans. The New York State Department of Health (NYSDOH) sponsors a CAHPS surveyevery other year for the Medicaid managed care plans and uses the results to determine variation inmember satisfaction among the plans. DataStat, Inc. conducted the survey on behalf of the NYSDOH in2019. The instrument used for the administration of the survey was the CAHPS 5.0H Adult Medicaid coresurvey, developed and tested nationally for assessing the performance of health plans.The majority of question items addressed member's experience with their health care, such as getting carequickly, communication with doctors, and overall satisfaction with health care and with the health plan. Thequestionnaire was expanded to include 22 supplemental questions of particular interest to the NYSDOH.Rounding out the instrument was a set of questions collecting demographic data. In total, thequestionnaire consisted of 67 questions. A copy of the modified CAHPS questionnaire can be found inAppendix A.Copyright Notice: DataStat has created the format and organization of this report and retains that as its sole property, holds the copyrighton that portion of the report and conveys no interest in that portion of the report. Users of this report expressly agree not to copy orotherwise disseminate the format or organization which are DataStat's sole property without DataStat's written permission.CAHPS is a registered trademark of the Agency for Healthcare Research and Quality (AHRQ).New York State Department of HealthPage 1 DataStat, Inc.
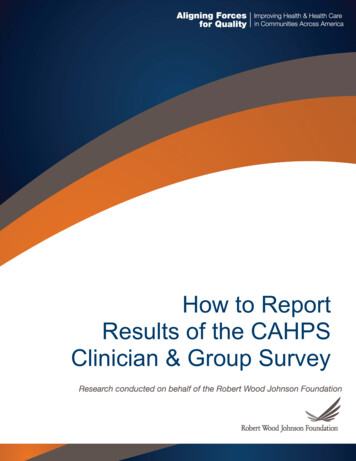
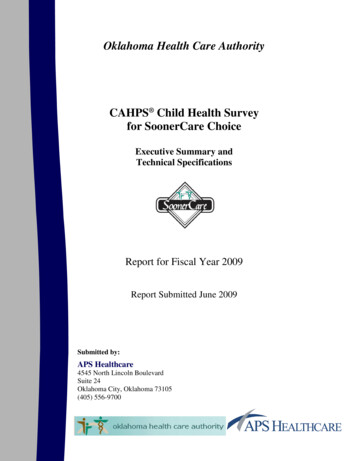
MetroPlus Health PlanExecutive SummaryExecutive SummaryIn New York, the CAHPS survey is administered to Medicaid managed care plan members every other year.For the 2019 administration, the NYSDOH focused on adult members of Medicaid managed care plans as wellas members in Special Needs Plans (SNPs) and Health and Recovery Plans (HARPs). The survey included15 Medicaid managed care plans in New York with a sample of 2,000 adults per plan. Questionnaires weresent to 30,000 members following a mail only methodology during the period October 3, 2019, throughDecember 31, 2019, using a standardized survey procedure and questionnaire. For your plan, a total of 215responses were received resulting in a 10.8% response rate. The disposition of surveys is contained at theend of this section.Conclusions based on the information presented in this report should be tempered by a few caveats. First, forsome questionnaire items, relatively small numbers of responses may be available due to skip patterns in thequestionnaire. In order to present the most reliable information, results based on fewer than 30 observationsare not presented in this report. Second, in some of the data presentations included in this report, correlationcoefficients are computed to explore the relationship between different measures. High correlations, however,do not necessarily indicate causation. Finally, in many of the graphs and tables presented in this report,differences between the Statewide average and individual managed care plans are readily apparent. However,where these differences are not statistically significant they should be evaluated accordingly.Summary of Standard Rating QuestionsResponse options for standard rating questions ranged from 0 (worst) to 10 (best). In the table below, theachievement score represents the proportion of members who responded with a rating of "8", "9", or "10".Results are presented for Statewide, New York City (NYC), Rest of State and the plan. Plan results arecompared to the Statewide achievement scores and a significance level of .05 or less was consideredstatistically significant and "é" or " ê" is placed at the top of the appropriate bar. Regional results are presentedfor additional information, but are not compared to the Statewide achievement scores.BetterStandard Ratings Questions (8, 9 or 10)10090807060504030Worse20100MMC Statewide 2019NYC 2019Rest of State 2019MetroPlus 2019éêQ21. Rating of allhealth careQ37. Rating ofpersonal doctorQ41. Rating ofspecialist seen mostoftenQ48. Rating of 74.65%Statistically significantly better/worse than MMC Statewide 2019.New York State Department of HealthPage 2 DataStat, Inc.
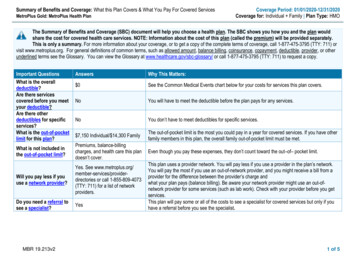
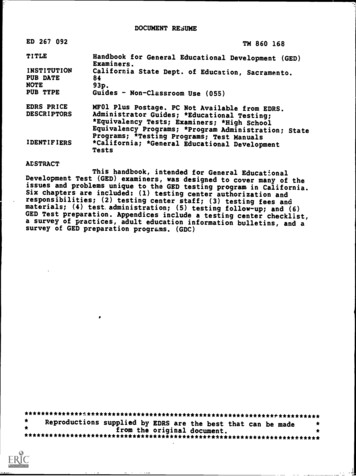
MetroPlus Health PlanExecutive SummarySummary of Standard CompositesA composite score is calculated for each of five domains of member experience: Getting Needed Care, GettingCare Quickly, How Well Doctors Communicate, Customer Service and Shared Decision Making. Compositeachievement scores indicate the proportion of members who reported a positive experience within a givendomain. Responses of "Usually" or "Always" indicate achievement for all composite measures except forShared Decision Making, which uses "Yes" as the indicator of achievement. Results are presented forStatewide, New York City (NYC), Rest of State and the plan. Plan results are compared to the Statewideachievement scores and a significance level of .05 or less was considered statistically significant and "é" or " ê"is placed at the top of the appropriate bar. Regional results are presented for additional information, but arenot compared to the Statewide achievement scores.BetterStandard Composites10090807060504030Worse20100MMC Statewide 2019NYC 2019Rest of State 2019MetroPlus 2019éêGetting NeededCare (Usually orAlways)Getting CareQuickly (Usuallyor Always)How Well DoctorsCommunicate(Usually orAlways)Customer Service(Usually orAlways)Shared DecisionMaking %80.28%78.21%81.84%75.74%Statistically significantly better/worse than MMC Statewide 2019.New York State Department of HealthPage 3 DataStat, Inc.
MetroPlus Health PlanExecutive SummaryKey Measure SummaryPlansGettingNeededCare(Usually orAlways)How WellGetting CareDoctorsQuicklyCommunicate(Usually or(Usually orAlways)Always)CustomerService(Usually orAlways)SharedDecisionMaking(Yes)Rating of allhealth careRating ofpersonaldoctorRating ofspecialistseen mostoftenRating ofhealth planMMC st of State848593898278838478Affinity Health e777791887976798676Excellus BlueCrossBlueShield818790908178788384Fidelis Care New York797992938372818777Healthfirst PHSP, Inc.847391847877757779HealthNow New YorkInc.858895868480897973HIP (EmblemHealth)777990828075858073Independent Health829093938379807780MetroPlus Health Plan767792837668777375Molina Healthcare807992838767848472MVP Health Care848193948376828181UnitedHealthcareCommunity Plan827893827774848569WellCare of New York807090817178838472YourCare Health Plan858993878374798271Statistically significantly better/worse than MMC Statewide 2019.New York State Department of HealthPage 4 DataStat, Inc.
MetroPlus Health PlanExecutive SummaryRespondent Sample ProfileAge (years)MMC StatewideNYCRest of StateMetroPlus HealthPlan18 to 249.1%9.5%8.9%8.1%25 to 3414.8%13.9%15.3%13.4%35 to 4415.2%16.2%14.5%17.7%45 to 5422.4%21.5%22.9%21.1%55 to 6434.5%32.7%35.4%32.5%65 to 742.9%4.8%2.1%4.8%75 or older1.1%1.5%0.9%2.4%MMC StatewideNYCRest of StateMetroPlus 58.4%59.3%MMC StatewideNYCRest of StateMetroPlus HealthPlan6.2%9.9%4.5%12.6%Some high school, but did not graduate14.2%16.7%13.2%18.8%High school graduate or GED33.5%27.8%36.3%27.5%Some college or 2-year degree28.0%24.0%30.0%24.2%4-year college graduate11.3%13.9%9.9%9.2%6.7%7.6%6.1%7.7%Hispanic or LatinoMMC StatewideNYCRest of StateMetroPlus HealthPlanYes, Hispanic or Latino18.4%32.8%12.1%35.6%No, Not Hispanic or Latino81.6%67.2%87.9%64.4%RaceMMC StatewideNYCRest of StateMetroPlus HealthPlanWhite55.6%24.2%70.4%14.9%Black or %7.8%24.9%Native Hawaiian or Other Pacific Islander0.5%1.1%0.2%1.0%American Indian or Alaska Native1.7%1.3%1.9%1.5%13.0%24.2%8.2%24.9%MMC StatewideNYCRest of StateMetroPlus HealthPlanExcellent13.3%14.5%12.7%18.7%Very ghest grade or level of school completed8th grade or lessMore than 4-year college graduateOtherRating of Overall HealthNew York State Department of HealthPage 5 DataStat, Inc.
MetroPlus Health PlanExecutive SummarySample DispositionMMC StatewideFirst mailing - sentMetroPlus Health Plan30,0002,0002,27115126,0481,683Second mailing - usable survey returned*1,14764Total - usable surveys3,4182151257Ineligible: Language barrier†30Ineligible: Deceased†30Ineligible: Mentally or physically unable to completesurvey†60Refusal/Returned survey blank140Incomplete survey - mail or phone44823,9291,5510011.4%10.8%First mailing - usable survey returned*Second mailing - sentIneligible: According to population criteria‡†Nonresponse - Unavailable by mail or phoneAdded to Do Not Call listResponse Rate*Included in response rate numerator†Excluded from response rate denominator‡Population criteria: The designated respondent must be a member of the managed care plan.Note: Response Rate Total Usable Surveys / Total Eligible CasesNew York State Department of HealthPage 6 DataStat, Inc.
MetroPlus Health PlanExecutive SummaryResponse RatesResponseRateUsableSurveysMMC C Statewide 2019New York State Department of Health65707580859095100BetterResponse RateHealth Plans 2019Page 7 DataStat, Inc.
MetroPlus Health PlanTrend AnalysisTrend Analysis - 2019 vs. 2017The table below provides a snapshot of the items with the greatest point change, positive or negative,since 2017. All performance-related items in the questionnaire that were trendable were listed indescending order of point change, and testing was conducted to determine which trends were statisticallysignificant. Two questions (Questions 8 and 10) cannot be trended and are not included in this analysis.Shown below are the ten items at the top of the list and the ten items at the bottom, with their 2017 and2019 scores and results of the significance testing. In the table presented below, differences over timemay be readily apparent. However, where these differences are not statistically significant they should beevaluated accordingly.MetroPlus2019 ScoreMetroPlus2017 ScorePointChangeComposite/Question GroupQ52. Had flu shot or flu spray since September 1, 2018? [Displayedfor Respondents 18-64 years old]58.8%46.2% 12.6Single ItemsQ39. Usually or always get an appointment to see a specialist assoon as you needed69.6%60.1% 9.5Getting NeededCareQ6. Usually or always got an appt. for check-up or routine care assoon as you needed73.1%63.8% 9.4Getting CareQuicklyQ13a. Doctor or other health provider talked about a healthy dietand eating habits73.2%67.9% 5.4Single ItemsQ13f. Doctor or other health provider talked about alcohol or otherdrug use33.6%28.9% 4.7Single ItemsQ43. Written materials or internet usually or always providedinformation about how health plan works79.6%75.2% 4.5Single ItemsQ31. Personal doctor usually or always explained things in way thatwas easy to understand92.4%88.3% 4.1CommunicationQ17. Doctor/provider asked what you thought was best for you75.3%71.8% 3.5Shared DecisionMakingQ15. Doctor/provider talked about reasons you might want to take amedicine92.1%89.0% 3.1Shared DecisionMakingQ32. Personal doctor usually or always listened carefully to you92.9%90.0% 2.9CommunicationQ12. Doctor/provider definitely talked about specific things to do toprevent illness69.8%72.3%- 2.4Single ItemsQ20. Results of blood test, x-ray or other test usually or alwayseasy to understand76.4%79.6%- 3.2Single ItemsQ47. Usually or always treated with courtesy and respect by healthplan's customer service staff90.8%94.2%- 3.3Customer ServiceQ13c. Doctor or other health provider talked about things in yourlife that worry you or cause you stress43.3%46.7%- 3.4Single ItemsQ48. Rating of health plan74.6%79.1%- 4.5RatingsQ46. Information from health plans customer service usually oralways easy to understand77.2%81.7%- 4.5Single ItemsQ41. Rating of specialist seen most often72.5%77.1%- 4.6RatingsQ19. Someone from doctor's office usually or always followed up togive blood test, x-ray or other test results69.8%75.2%- 5.4Single ItemsQ21. Rating of all health care68.0%74.4%- 6.4RatingsQ45. Health plan's customer service usually or always gave neededinformation or help75.9%82.6%- 6.7Customer ServiceQuestionStatistically significantly higher/lower than 2017 score.New York State Department of HealthPage 8 DataStat, Inc.BetterWorse
MetroPlus Health PlanMethodologyMethodologyAdults who were current members of a NYSDOH Medicaid managed care plan, ages 18 to 64, as ofSeptember 2019 and who had been enrolled for five out of the last six months were eligible to be randomlyselected for the survey. Respondents were surveyed in English or Spanish. The survey was administered overa 12 week period using a mail only three wave protocol. The protocol consisted of a first questionnaire packetand reminder postcard to all selected members, followed by a second questionnaire packet to individuals whohad not responded to the initial mailings.Survey Milestones1. 1st questionnaire packets mailed: October 3, 20192. Reminder postcards mailed: October 10, 20193. 2nd questionnaire packets mailed: November 7, 20194. Field closed: December 31, 2019Sampling FrameA stratified random sample of 2,000 adults ages 18-64 was drawn for each of the managed care plans. To beeligible, individuals had to be current members who were continuously enrolled in the Medicaid managed careplan for at least five out of the last six months as of September 2019QuestionnaireThe instrument selected for the survey, the CAHPS 5.0H Adult Medicaid core survey, was developed andtested nationally for use in assessing the performance of health plans. The majority of questions addresseddomains of member experience such as getting care quickly, doctor communication, overall satisfaction withhealth care and health plan. The questionnaire was expanded to include 22 supplemental questions ofparticular interest to the NYSDOH. Rounding out the questionnaire was a set of questions collectingdemographic data. In total, the questionnaire consisted of 67 questions. A copy of the modified CAHPS questionnaire can be found in Appendix A.Selection of Cases for AnalysisQuestionnaires were considered complete if respondents did not say 'No' to Question 1 (Our records showthat you are now in [HEALTH PLAN NAME]. Is that right?) and if they provided a valid response to at leastthree of the five questions: Q3, Q29, Q38, Q44, Q48. Complete interviews were obtained from 215 Medicaidmanaged care members, and the overall project response rate was 10.8%.Definition of Achievement ScoresMember responses to questionnaire items are summarized as achievement scores. Responses that indicate apositive experience are labeled as achievements, and an achievement score is computed equal to theproportion of responses qualifying as achievements. Since achievement scores for questions represent theproportion of respondents who indicate a positive experience, the lower the achievement score, the greaterthe need for improvement. See the Responses by Question section for assignment of achievement responsesfor each question.In general, somewhat positive responses are included with positive responses as achievements. For example,a response of "Usually" or "Always" to the question "How often did you get an appointment for health care at adoctor's office or clinic as soon as you needed?" is considered an achievement, as are responses of "8", "9",or "10" to rating questions.CompositesFive standard composite scores summarize responses in key areas: Getting Needed Care, Getting CareQuickly, How Well Doctors Communicate, Customer Service, and Shared Decision Making. The achievementNew York State Department of HealthPage 9 DataStat, Inc.
MetroPlus Health PlanMethodologyscore for the composite is the average of the achievement scores for the individual items comprising acomposite. Following is a list of the questions that comprise each composite:Getting Needed CareQ22. Usually or always got care, tests or treatment you thought you neededQ39. Usually or always get an appointment to see a specialist as soon as you neededGetting Care QuicklyQ4. Usually or always got care right away as soon as you neededQ6. Usually or always got an appt. for check-up or routine care as soon as you neededHow Well Doctors CommunicateQ31.Q32.Q33.Q34.Personal doctor usually or always explained things in way that was easy to understandPersonal doctor usually or always listened carefully to youPersonal doctor usually or always showed respect for what you had to sayPersonal doctor usually or always spent enough time with youCustomer ServiceQ45. Health plan's customer service usually or always gave needed information or helpQ47. Usually or always treated with courtesy and respect by health plan's customer service staffShared Decision MakingQ15. Doctor/provider talked about reasons you might want to take a medicineQ16. Doctor/provider talked about reasons you might not want to take a medicineQ17. Doctor/provider asked what you thought was best for youCorrelation to SatisfactionTo understand the relationship between performance and satisfaction in particular areas of memberexperience, correlations are computed between responses to the performance related questions and each ofthe ratings questions. The specific correlation computed is Pearson's Correlation Coefficient, which takes onvalues between -1 to 1. Correlation scores are presented in the Correlation Analysis section.Comparisons: Current Year and TrendingTwo types of comparisons are presented. Current year comparisons are found in the Executive Summary andGraphs sections. In the Executive Summary section, plan level results for the Standard Ratings andComposites are compared to the Statewide achievement score, with statistical testing. Regional results arepresented for comparison. In the Graphs section plan level results for each performance measure arecompared to the Statewide achievement score, with statistical testing. Regional results are presented foradditional information, but are not compared to the Statewide achievement scores.Comparisons across time are the focus of the Trend Analysis section: all performance-related items in thequestionnaire that were trendable were listed in descending order of point change. The Trend Analysis sectiondisplays, for the plan, the ten items at the top of the list and the ten items at the bottom with the corresponding2017 and 2019 scores as well as significance testing results. In addition, the Responses by Question sectionpresents achievement score point change and significance testing results for each performance item.New York State Department of HealthPage 10 DataStat, Inc.
MetroPlus Health PlanMethodologyStatistical TestingStatistically significant differences between scores were determined using t-tests. A significance level of .05 orless was considered statistically significant and "é" or " ê" is placed at the top/end of the appropriate bar or nextto the appropriate achievement score.Case-Mix AnalysisThe majority of achievement scores presented in this report are case-mix adjusted to control for differences inthe member population across managed care plans. The results for 2019 are case-mix adjusted for age (Q60),health status (Q50) and education (Q62). Case-mix adjustment is applied to mitigate the effect of differencesin individual plan's member population. The variables chosen for case-mix adjustment are beyond the controlof the managed care plan and have been shown to affect managed care plan and health care ratings. Forexample, individuals with higher levels of education generally rate lower for satisfaction. Details about thedistribution of populations in categories for the three adjusters can be seen in the Respondent Sample Profilecontained in the Executive Summary section.All achievement scores based on questions in the "About Your Health" and "About You" sections are not casemix adjusted. Case-mix adjustment is also not applied to the achievement scores for the Question 13 series.New York State Department of HealthPage 11 DataStat, Inc.
MetroPlus Health PlanUsing this reportUsing this ReportUnderstanding Achievement ScoresThis report is designed to assist the NYSDOH and participating health plans in identifying key opportunities toimprove members' experiences. Member responses to questions are summarized as achievement scores.Responses that indicate a positive experience are labeled as achievements, and an achievement score is computedas the proportion of responses qualifying as positive. Responses of "Yes" are considered achievements for theShared Decision Making composite. For all other composites, responses of "Usually" or "Always" are consideredachievements. For example, a response of "Usually" or "Always" to the question "How often did you get care as soonas you needed?" is considered a positive response, and the achievement score for this question is equal to theproportion of respondents who answered the question with "Usually" or "Always". Because achievement scores forquestions are computed as the proportion of members who indicate a positive experience, the lower the achievementscore, the greater the need to improve.Achievement scores are computed and reported for all pertinent questions. In addition, composite scores are builtfrom groups of questions that make up broad domains of members' experience: Getting Needed Care, Getting CareQuickly, How Well Doctors Communicate, Customer Service, and Shared Decision Making.Achievement scores based on fewer than 30 observations are suppressed in this report and "NA" is substituted forthe result. When relevant, a footnote is presented. Typically, too few responses are due to skip patterns in thequestionnaire. Suppressing scores based on a small number of cases ensures that this report includes the mostreliable information available.Understanding the Sections of the ReportThe CAHPS survey results are presented here in a format that is optimized for use in practical decision-making.Specifically, these reports can:1. Assist the NYSDOH and health plans in identifying strengths and weaknesses in quality of healthcare, access and services, and2. Provide the NYSDOH and health plans with a way to assess where resources can best be allocatedto improve experiences.The remainder of the report is broken into three major sections that are briefly described here to help you make thebest use of the report and the information it contains.Graphs/ResultsThis section contains a graphic presentation of Statewide, NYC, Rest of State and plan specific results for questionsusing achievement scores. Statistical significance, the achievement score, and the number of respondents for eachplan are displayed. This depicts plan specific performance compared to various benchmarks or peers. Thecomposites are directly followed by the individual questions that are combined to create composite measures.Correlation AnalysisThe Correlation Analysis section is helpful in understanding how satisfaction in various questions relates to the fourstandard rating questions (personal doctor, specialist seen most often, all health care, and health plan) forrespondents. The charts show which questions are most strongly linked to the rating and the current achievementscore. The information helps define what areas are related to satisfaction and how the group or plan performed inthat area. The section enables a quick view of how composite questions correlate across ratings.The correlation analyses are presented two ways. First there are correlations of the top ten highly correlatedcomposite questions to the four rating questions ranked by the highest correlation between the question and rating.This allows a visual picture of clustering of composites across ratings. The second analysis presents the proportionNew York State Department of HealthPage 12 DataStat, Inc.
MetroPlus Health PlanUsing this reportof responses in each response option for each composite question for each individual rating. This lets you see wherethere may be an opportunity for improvement. For example, if a question correlates highly and has higher proportionsof "usually" and "sometimes", improving the processes may move respondents up to "always" to improve not onlythat composite, but the other rating questions.Responses by QuestionThis section provides a breakdown for each question with the number of members responding to the question andthe distribution for each available response option. For each question that has responses determined to be positiveor negative, there is a colored circle indicating achievement (green circle) or room for improvement (red circle). Thecircles are based on the response category and are not indicative of areas the plan needs to improve necessarily.For example, "Always" and "Usually" are achievement and "Sometimes" and "Never" are room for improvement.Similarly on a rating question, "8", "9", or "10" are achievement and 0 through 7 are room for improvement.Questions without a colored circle indicate the question is not associated with this type of response determination.For example, asking whether a member needed a service in the past six months does not have an associatedachievement score. Achievement scores based on fewer than 30 observations are suppressed and "NA" issubstituted for the result. This section provides additional information about volume of members to help you prioritizeareas to be addressed.When applicable, each question is presented with the composite name, the achievement score, the correlation withrating of health plan value and trend information. The achievement scores are case-mix adjusted while data for eachresponse option are not case-mix adjusted. Achievement scores for the Question 13 series, the "About Your Health"and "About You" sections are not case-mix adjusted.New York State Department of HealthPage 13 DataStat, Inc.
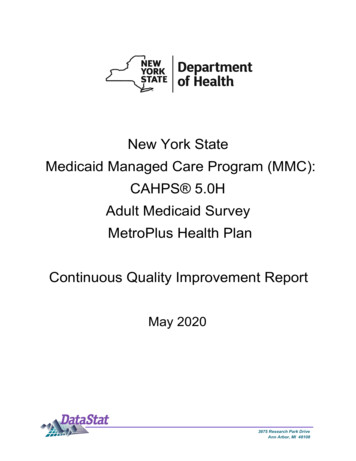
MetroPlus Health PlanOverall RatingsGraphs/ResultsThe Graphs/Results section contains a graphic presentation of Statewide, NYC, Rest of State and planspecific results for each question using the achievement scores. Statistical significance, the achievementscore, and the number of respondents for each plan are displayed. This depicts plan specific performancecompared to various benchmarks or peers. Rating results are followed by composites and the questions thatmake up each composite. Medical Assistance with Smoking Cessation and Single Items can be found at theend of this section.The CAHPS 5.0H survey uses a 0-10 rating for assessing overall experience with personal doctors,specialists, health care and health plans. In the four ratings graphs, proportions of respondents assigningratings of "8", "9", or "10" are reported as achievement scores.Questions that relate to the same broad domain of performance are grouped together for the purpose ofreporting. For example, the domain Getting Care Quickly includes questions about how soon appointmentswere scheduled. Composite achievement scores reflect responses of "Usually" or "Always" for the first fourcomposites. Responses of "Yes" are considered achievements for the Shared Decision Making composite.Graphs presenting the results of individual questions that make up the composite score follow the presentationof the composite results.For full detail of response options for each question and which responses qualify as achievements, pleaserefer to the Responses by Question section.In this report, results based on fewer than 30 cases are suppressed and "NA" is substituted for the result.When relevant, a footnote is presented.New York State Department of HealthPage 14 DataStat, Inc.
MetroPlus Health PlanOverall RatingsOverall RatingsQ21. Rating of all health care (8, 9 or 10)ScoreNMMC Statewide75.33%2211NYC71.23%718Rest of 556065Achievement S
3975 Research Park Drive Ann Arbor, MI 48108 New York State Medicaid Managed Care Program (MMC): CAHPS 5.0H Adult Medicaid Survey MetroPlus Health Plan