Transcription
Not Enough to Eat:COVID-19 DeepensAmerica’s Hunger CrisisContributing EconomistDiane Whitmore SchanzenbachNorthwestern UniversitySEPTEMBER 2020
ACKNOWLEDGMENTSFRAC gratefully acknowledges sponsorship of this report from theGeneral Mills Foundation, the Kellogg Company Fund, and PepsiCo.Not Enough to Eat:COVID-19 DeepensAmerica’s Hunger CrisisPrior to COVID-19, even in the midst of a strong economy with arecord streak of job growth and low unemployment rates, in 2018nearly 8 million (4 percent) American adults reported that membersof their households sometimes or often did not have enough to eat.According to data from the U.S. Census Bureau’s Household PulseSurvey (collected April 23, 2020 through July 21, 2020), duringCOVID-19, that number has surged to 26–29 million, or 11 percent ofadults. Who are the hungry in America today? This report providesa description of who didn’t have enough to eat.The U.S. Department of Agriculture’s (USDA) widely used foodinsecurity rate includes a range of those experiencing foodhardships, including those who lack enough money for food andthose who couldn’t afford to eat balanced meals. About 1 in 4 adultsare estimated to be food insecure during COVID-19. This reportgoes a step deeper to highlight the subset of this group who areexperiencing severe food insecurity, meaning they reported theysometimes or often didn’t have enough food (see sidebar).Not surprising, groups that are most likely to not have enough toeat are those that typically disproportionately experience poverty:Black and Latinx families, those with less than a college education,and children. Approximately 1 in 5 Black and Latinx adults reportthey do not have enough to eat. What is more surprising is theextent of hunger. It’s not just the poorest families who are facing thisstruggle; among those who don’t have enough to eat, 1 in 4 haveusual incomes above 50,000 per year. During this crisis, manyhave become unemployed, others who have kept their jobs haveseen their earnings decrease due to reduced hours, and othersare expecting to lose earnings in the next month. The economicshocks they have experienced have pushed many into hunger —potentially for the first time.FRACnFood Insecurity vs.Not Enough to EatThe measure investigatedhere — sometimes or oftennot enough to eat — is a moresevere measure than theconcept of “food insecurity”that is also tracked by USDA.Food insecurity is a measureindicating that a family did nothave consistent, dependableaccess to enough food to livean active, healthy lifestyle.Food insecurity has not beenmeasured directly duringCOVID-19; using available datawe can estimate that foodinsecurity is 25 percent foradults overall, and 32 percentfor those with children.Eleven percent of adults and 14percent of those with childrenreport that they sometimesor often don’t have enoughto eat during COVID-19. Theshare reporting they don’thave enough to eat closelytracks with the share identifiedby USDA as having Very LowFood Security (VLFS), meaningthat the food intake of somehousehold members wasreduced and normal eatingpatterns were disrupted due tolack of resources.Not Enough to Eat: COVID-19 Deepens America’s Hunger Crisisnwww.FRAC.org2
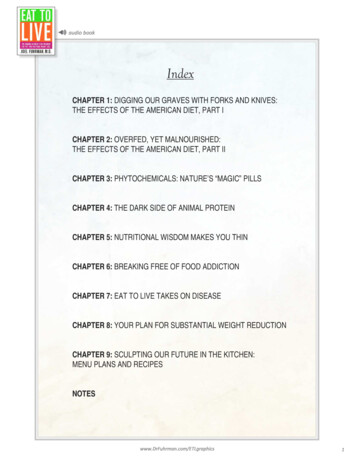
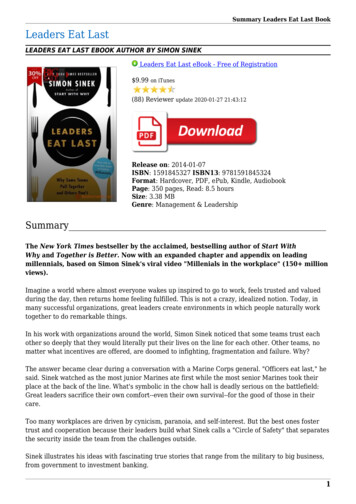
Research has already found that the following havereduced hunger and other measures of food hardship:Payments from the new Pandemic Electronic BenefitTransfer (P-EBT) program, which provides resourcesto families who lost access to free or reduced-priceschool meals, lifted 2.7–3.9 million children out ofhunger in the subsequent weeks1 since the pandemicbegan; and evidence from the prior recession showsthat increasing Supplemental Nutrition AssistanceProgram (SNAP, formerly Food Stamps) benefitshelped people and the economy, reducing foodinsecurity and also stimulating the local economy.2In the face of continued high rates of hunger,Congress should turn to these proven programs —continuing to provide P-EBT payments as long asschools aren’t following their normal schedules, andincreasing maximum SNAP benefits by 15 percent.Who Doesn’t Have Enough to Eat?Each year, USDA collects a detailed survey onhouseholds’ experiences with food access, includingasking respondents to choose which statement bestdescribes the food eaten in their homes in the lastyear: enough of the kinds of foods we want to eat;enough, but not always the kinds of food we want;sometimes not enough to eat; or often not enough toeat. In 2018, 3.7 percent of respondents overall andwith children reported that they sometimes or oftendid not have enough to eat as shown in Figure 1.During COVID-19, the Census Bureau has beenasking one question, drawn from the larger setof annual USDA questions, in which respondentschoose among the same options to describethe food available during the past week. Overall,between 10.2 and 11.0 percent of respondentsreport that they don’t have enough food. Rates arehigher among those with children. In May and June,13.6 percent of respondents with children said thatthey didn’t have enough food. In July, that numberwas 14.4 percent.3Figure 1 also shows that the share reportingthey don’t have enough to eat increases duringeconomic recessions. In 2008, the first year ofthe Great Recession, the share without enoughto eat increased by just over one-third overalland for respondents with children compared withthe prior year. The COVID-19 recession has beenFigure 1. Share of Adults (Overall and With Children) Reporting Their Household Sometimesor Often Does Not Have Enough to Eat: 2005–2018 and May–July 2020Percent reporting they sometimes oroften do not have enough to eat16.0%12.0%8.0%Respondentsw/ 920112013201520172019Not Enough to Eat: COVID-19 Deepens America’s Hunger CrisisnMay2020June2020www.FRAC.orgJuly20203
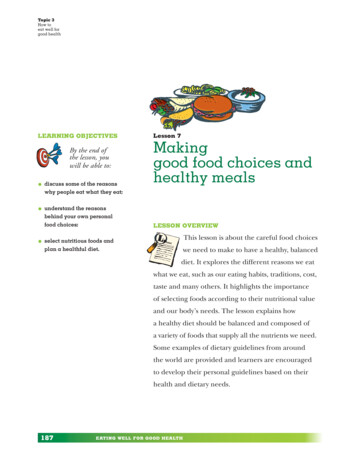
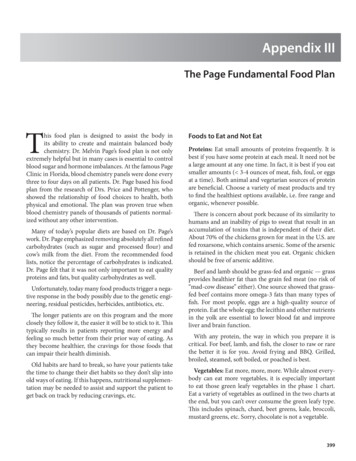
characterized by a larger and more rapid increasein unemployment rates than the Great Recession,which explains some of the reasons why the rate ofthose reporting not enough to eat has spiked so highin recent months. Of course, widespread closures ofschools and child care centers that usually providemeals to children is also a contributing factor.The shares without enough to eat during COVID-19are disproportionately high among Black andLatinx respondents — especially among thosewith children. As shown in Figure 2, more than 1in 5 Black and Latinx adults with children reportedin July that they sometimes or often did not haveenough to eat. Note that even prior to COVID-19, in2018 there were stark disparities across groups withBlack respondents more than three times as likelyas white and Asian respondents who reported nothaving enough to eat. Every group has seen theirrates of hunger more than double between 2018and today, with rates quadrupling among Latinxrespondents (overall and with children). Across everygroup, respondents with children in their homes aremore likely to report that they don’t have enough toeat. A similar pattern holds across education levels(not shown), with 16 percent lacking enough to eatamong those with a high school diploma or less,10 percent among those with some college, and3 percent among those with a college degree orMore than 1 in 5 Blackand Latinx adults with childrenreported in July that theysometimes or often did nothave enough to eat.Btmore. For respondents with children, the rates are21 percent (high school or less), 13 percent (somecollege) and 4 percent (college degree). Rates ofhunger are consistently high across all adult agelevels, and are lower among older adults.The share reporting not enough to eat variespredictably by annual income — with rates muchhigher among those with the lowest incomes. DuringCOVID-19, 28 percent of those with usual incomesbelow 25,000 per year reported not having enoughto eat (compared with 11 percent in 2018). The sharedeclines across groups of usual annual income butis still reasonably common among those with higherincome levels — 1 in 4 of those reporting not havingenough to eat had usual incomes above 50,000per year. Although across the board every groupexperienced job losses during COVID-19, those withlower levels of usual income were more likely to losetheir jobs.Figure 2. Share of Adults (Overall and With Children) Reporting Their HouseholdSometimes or Often Does Not Have Enough to Eat, by Race/Ethnicity: 2018 and July 2020Panel B. Respondents with lack2018FRAC19%nLatinxAsianJuly 2020OtherRacePercent reporting they sometimes or oftendo not have enough to eatPercent reporting they sometimes or oftendo not have enough to eatPanel A. Respondents teBlack2018Not Enough to Eat: COVID-19 Deepens America’s Hunger CrisisLatinxAsianJuly 2020nwww.FRAC.orgOtherRace4
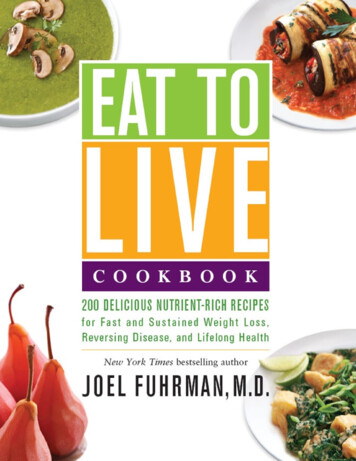
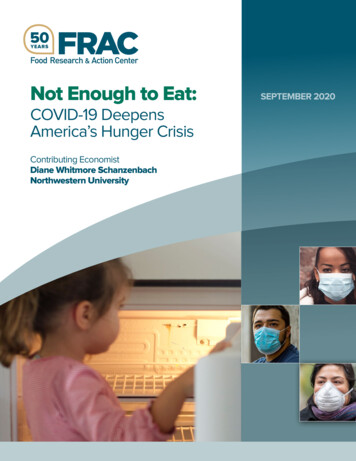
Figure 3. Share of Adults Overall Reporting Their Household Sometimes or Often Does NotHave Enough to Eat, by Usual Annual Income: 2018 and May–July 2020Percent reporting sometimes or oftennot enough to eat30%28 %25%20%16 %201815%12 %10%8%8%4%5%1%1%2%COVID-1911 %5%3%0% 50,000– 74,999Families Don’t Have Enough to Eatbecause of the COVID-19 EconomyA deeper dive into the data shows how vast theeconomic distress of COVID-19 has been — and howclosely it is tied to not having enough to eat. PanelA of Figure 4 shows the share of adults who havebecome economically vulnerable during COVID-19.Twenty-one percent of adults report having becomeunemployed themselves during COVID-19 — thoughto be sure, some of those are expecting to berecalled back to their old jobs when the situationimproves. Another 27 percent are workers “on theedge”: while they themselves are working, they haveeither experienced a loss of income due to anotherhousehold member’s job loss, fewer hours worked orother types of reductions, or expect to experience aloss of job and/or income in the next month. Amongworkers on the edge, 90 percent report they havealready experienced a loss of income, and half reportthat they both have already lost income and stillexpect to lose more. Those with children are morelikely to have lost a job, or to be an employed workeron the edge.Panel B of Figure 4 shows the rate of reporting notenough to eat among those made economicallyvulnerable during COVID-19. Overall, 21 percent ofthose who lost their jobs during COVID-19 reportnot having enough to eat. Workers have not beenFRACn 35,000– 49,999 25,000– 34,999 0– 24,999Figure 4. Economic Vulnerability DuringCOVID-19Panel A. Percent Economically Vulnerableduring COVID-19Percent of people who lost their jobsor were “on the edge” during COVID-19 75,000– Worker“on theedge”Adults OverallLost Workerown “on thejobedge”Adults w/ ChildrenPanel B. Share of Economically Vulnerablewithout Enough to EatPercent of eceonomically vulnerable whoreport sometimes or often not enough to eat 100,000 on theedge”Adults OverallNot Enough to Eat: COVID-19 Deepens America’s Hunger CrisisnLostownjobWorker“on theedge”Adults w/ Childrenwww.FRAC.org5
spared: 13 percent of those who are themselvesstill working, but are on the edge due to householdincome losses, or who expected losses, report nothaving enough to eat.As has consistently been the case throughout thisanalysis, those with children are worse off. Notonly are they more likely to have experiencedjob losses or income losses, but, conditional onexperiencing these, they are more likely to not haveenough to eat. The impact on children is furthercompounded by children’s loss of meals in schoolsand childcare sites.Figure 4 shows the high rates of economicvulnerability overall, but job losses have been higherfor Black and Latinx households, as well as for thosewith lower levels of education. Job losses have alsobeen higher in some service sectors, such as foodservice and travel.4 Figure 5 separates the measuresof economic vulnerability — among those who eitherlost their own job, or lost or expect to lose householdincome — by race and ethnicity. A majority of Blackand Latinx respondents have experienced economicvulnerability, with much higher rates than whites.Asian respondents and those in the “other race”category fall in between. Economic vulnerabilityresults in not having enough to eat at substantiallyhigher rates for Black and Latinx respondents.Among the economically vulnerable, 28 percent ofBlacks, 22 percent of Latinx, and 21 percent of theother race group report not having enough to eatoverall, with 29, 23, and 22 percent, respectively,among those with children. Similar patterns holdacross income level and education — with thoseusually earning less or with lower levels of educationlosing jobs and incomes at higher rates, and witheconomic vulnerability resulting in not havingenough to eat at higher rates.Figure 5. Economic Vulnerability During COVID-19, by Race/Ethnicity70%60%50%62%61%55%52% 50%68%58%55%51%42%40%30%20%10%0%Adults w/ ChildrenAdults OverallBlackHispanicAsianWhiteOther RaceDespite how stark these numbers are, they wouldsurely be worse if not for the historic relief effortsfrom Congress. Between topping up UnemploymentInsurance benefits, providing Economic ImpactPayments, creating P-EBT, and implementing smartreforms to SNAP, Congress took helpful stepsat the beginning of the pandemic to buffer theFRACnPanel B. Percent of the Economically Vulnerablewithout Enough to EatPercent of eceonomically vulnerable whoreport sometimes or often not enough to eatPercent of adults who list jobs or are“workers on the edge”Panel A. Percent Economically Vulnerableduring COVID-19, by Race/Ethnicity35%30%25%20%29%28%23% 22%22% 21%15%10%10%12%12%13%5%0%Adults w/ ChildrenAdults OverallBlackHispanicAsianWhiteOther Raceimpact of the economic shock; however, this isnot enough. Too many have not received reliefpayments adequate to weather the currenteconomic storm, and Congress has not yet adoptedor extended policies known to alleviate effectivelyfood hardship — and do so in a targeted andtemporary manner.5Not Enough to Eat: COVID-19 Deepens America’s Hunger Crisisnwww.FRAC.org6
Who Doesn’t Have Enough to Eat During COVID-19?We have seen that Black and Latinx populations,and those with lower levels of education, are morelikely to not have enough to eat and have beendisproportionately impacted by the COVID-19economic shock.Figure 6 shows population characteristics of thosewithout enough to eat during COVID-19. As shownin Panel A of Figure 6, 42 percent of those withoutenough to eat are whites, followed by 27 percentLatinx, 22 percent Black, 3 percent Asian, and theremainder comprising other races. As shown inPanel B, 61 percent have an education level nohigher than a high school diploma, with 30 percenthaving some college, and 9 percent with a collegedegree or more. As shown in Panel C, 44 percenthave usual incomes less than 25,000 per year;one-third have usual incomes between 25,000 and 49,999, and 23 percent have usual incomes above 50,000 — many of whom have seen large drops intheir incomes at this time.In 21 states and theDistrict of Columbia, more than1 in 10 adults overall report nothaving enough to eat.Women disproportionately do not have enough toeat, and have been more likely to lose their jobsduring COVID-19. Of those without enough to eat,54 percent overall are women, and among thosewith children who lack adequate food, 60 percentof them are women. Those age 60 or older withoutenough to eat are also more likely to be women(58 percent).In 21 states and the District of Columbia, more than 1in 10 adults overall report not having enough to eat,as shown in Figure 7, Panel A. As always, rates areworse for those with children. In 38 states and theDistrict of Columbia, more than 1 in 10 adults withchildren say they don’t have enough to eat.Figure 6. Characteristics of Those Without Enough to EatPanel A. Race/Ethnicity ofThose Without Enough to EatPanel B. Education Level ofThose Without Enough to Eat3% 6%Panel C. Usual Annual Incomeof Those Without Enough to hernLatinx HSSome CollegeBA Not Enough to Eat: COVID-19 Deepens America’s Hunger Crisis 0 to 24.9Kn 25K to 49.9K 50K to 99.9Kwww.FRAC.org7
Figure 7. Percent Reporting Not Enough to Eat, by StateRespondents Experiencing Hunger, TN12OKNM12ARSC17MS1514121217%16%7 MA15%9 RI14%10 CTOHIN10KSPA106 VT6 NH11%9 DE10%12 DC9%11 MD8%7%LA6%TX812%10 NJGAAL13%AK12FL8 HIRespondents With Children Who Are Experiencing MNCTN1515ARSC201720MS16AL22%20%9 MA17%15 RI16%13 CTOHIN12KSCA13101114NVNY137 VT9 NH13AK14%13 NJ13%12 DE12%22 DC11%16 MD10%9%GA8%LATX1115%7%176%FL11 HIFRACnNot Enough to Eat: COVID-19 Deepens America’s Hunger Crisisnwww.FRAC.org8
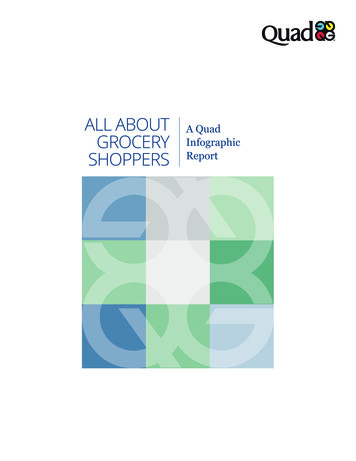
Food is Key, but It’s About More than FoodThose who report not having enough to eat are alsoexperiencing other aspects of economic turmoil. Asshown in Figure 8 below, a majority of those withoutenough to eat say they expect to lose employmentincome in the next month. One-third say that theyare not at all confident that they can make theirnext housing payment, and nearly half are not at allconfident that they can afford the food they needover the next month. More than one-third report thatthey did not make their last housing payment. Morethan 80 percent of those without enough to eatreported experiencing bad mental health symptomsat least half of the days in the prior week, includingnervousness/anxiety, inability to stop worrying, littleinterest in doing things, and feeling down, depressedor hopeless. Rates of bad mental health symptomsamong those without enough to eat are 20 to 30percentage points higher than those among thepopulation overall.In addition to being more likely to not have enoughto eat, others have found that death rates fromCOVID-19 are higher for Black and Latinx peopleof all ages — with differences in death rates muchhigher for those at younger ages, including deathrates 10 times higher among Black individualsbetween the ages of 35 to 44 years old, and seventimes higher for those who are 45 to 54 years old.Rates for Latinx people are slightly lower than forBlack people, but still well above white death rates.6Figure 8. Widespread Economic Distress among Those Without Enough to Eat80%65%68%60%48%40%33%45%36%35%38%20%0%Expect an HH job loss in thenext 4 weeks due to COVID“Not at all” confident inability to pay mortgageor rentOverall“Not at all” confident that HHwill be able to afford the kindsof foods needed for the next 4 weeksDidn’t pay lastmortgage/rentw/ ChildrenConclusionDuring COVID-19, far too many Americans reportthat they do not have enough to eat. This is not aproblem limited to certain populations or regions.Approximately 1 in 5 Black and Latinx adults say theydo not have enough to eat, as do 1 in 14 white andAsian adults. In the vast majority of states more than1 in 10 adults with children don’t have enough to eat.Most have been pushed into this state by job loss.Many others are still employed, but have lost hoursor earnings, as well as other supports, which havepushed them into hunger. Across the board, those withchildren are more likely to not have enough to eat.FRACnCongress has a number of proven policies that itcan adopt to help struggling families get enough toeat. In particular, increasing maximum SNAP benefitsand extending the P-EBT program, which providesbenefits to those who lost access to free or reducedprice school meals, are two of the most effectivefood assistance policies.7 Congress should, withoutdelay, act to increase maximum SNAP benefits by 15percent and extend P-EBT payments, so that fewerpeople in America will go without enough to eat.Not Enough to Eat: COVID-19 Deepens America’s Hunger Crisisnwww.FRAC.org9
Endnotes1Bauer, Lauren, Abigail Pitts, Krista Ruffini, and Diane Schanzenbach. “The Effect of Pandemic-EBT onMeasures of Food Hardship,” Brookings Institution, July 30, 2020. bach, Diane, Lauren Bauer, and Greg Nantz. “Twelve Facts about Food Insecurity and SNAP,” TheHamilton Project, Brookings Institution, April 2016. efacts about food insecurity and snap.pdf3Differences between May and June are not statistically significant, but July rates are statistically higherthan those in May and June. The Census Household Pulse is collected online, while the annual surveytypically is collected through a telephone survey. Research suggests that reported rates of food hardshipare lower in surveys collected in person or via telephone compared to those collected online, possibly dueto respondents’ social desirability bias when responding to a live interviewer (Karpman, Michael, StephenZuckerman, and Dulce Gonzalez. 2018. “The Well-Being and Basic Needs Survey: A New Data Source forMonitoring the Health and Well-Being of Individuals and Families.” Washington: Urban Institute).4Montenovo, Laura, Xuan Jiang, Felipe Lozano Rojas, Ian M. Schmutte, Kosali Simon, Bruce A. Weinberg, andCoady Wing. “Unequal Employment Impacts of COVID-19.” Econofact, June 1, 2020. f-covid-195Bitler, Marianne, Hilary Hoynes, and Diane Schanzenbach. “The social safety net in the wake of COVID-19.”Forthcoming, Brookings Papers on Economic Activity.6“Race gaps in COVID-19 deaths are even bigger than they appear” by Tiffany Ford, Sarah Reber, andRichard V. Reeves, Brookings Institution. they-appear/7Hoynes and Schanzenbach argue for an automatic 15 percent increase in maximum SNAP benefits duringrecessions as an automatic stabilizer. See Hoynes, Hilary and Diane Schanzenbach, “Strengthening SNAPas an Automatic Stabilizer,” in Boushey, Heather, Ryan Nunn, and Jay Shambaugh, eds., Recession Ready:Fiscal Policies to Stabilize the American Economy. The Hamilton Project and Washington Center onEquitable Growth.FRACnNot Enough to Eat: COVID-19 Deepens America’s Hunger Crisisnwww.FRAC.org10
are disproportionately high among Black and Latinx respondents — especially among those with children. As shown in Figure 2, more than 1 in 5 Black and Latinx adults with children reported in July that they sometimes or often did not have enough to eat. Note that even prior to COVID-19, in 2018 there were stark disparities across groups with