Transcription
2008 Washington State MedicaidKing County Care PartnersChronic Care Management ProjectClient Satisfaction Survey Results
Table of Contents Acknowledgments . 1 Introduction . 2 - 3Project BackgroundProject Goals How to Use This Report . 3 – 5PAM-13 activation stagesWhat do the bar graphs tell you?Statistical significanceLimitations Summary of Statistically Significant Results . 6 Bar Charts – Core Questions, CAHPS . 7 – 18RatingsHow people rate their health care . 7How people rate their personal doctor or nurse . 8How people rate the specialist they saw most often . 9CAHPS CompositesGetting care without long waits . 10 - 13How well doctors communicate . 14 - 18 Bar Charts –Supplemental Questions, CAHPS . 19 – 31Your Personal DoctorHow often doctor talks about prevention. 19Does doctor understand how health affects daily life . 20How often doctor seems informed about care from other doctors . 21How often pain limits abilities . 22Does doctor understand impact of pain on life . 23How often fatigue limits abilities . 24Does doctor understand impact of fatigue on life . 25Your SpecialistsMade appointments with specialist . 26How easy to get appointments with specialist . 27UtilizationHow many specialists seen . 28How many time visited personal doctor . 29How many times visited doctor’s office or clinic . 30Obtained care from doctor besides personal doctor . 31 Bar Charts – HEDIS Questions, CAHPS . 32 – 36Flu ShotHad flu shot . 32Tobacco useHow often smoke cigarettes . 33How often chew tobacco . 34Quit tobacco products . 35Reduced tobacco product use . 362008 Washington State Medicaid King County Care Partners Chronic Care Management ProgramClient Satisfaction SurveyA complete copy of this report is available at http://hrsa.dshs.wa.gov/News/Brief4Leg.htmi
Bar Charts – Screener Questions for Chronic Conditions, CAHPS/DSHS . 37 – 40Seen doctor three or more times . 37Has condition that lasted at least three months . 38Takes prescription medicine . 39Ability to care for self compared to six months ago (DSHS) . 40 Bar Charts – Client Satisfaction Questionnaire (CSQ-8 ) . 41 - 48Quality of service . 41Service meets needs. 42Program meets needs . 43Recommend program to a friend . 44Satisfied with amount of help . 45Services help deal with problems . 46Rating service satisfaction . 47Return to program if needed . 48 Bar Charts – EQ-5D Health Status . 49 - 53Mobility . 49Self-care . 50Perform usual activities . 51Discomfort . 52Anxiety/Depression . 53 Bar Charts – Patient Activation Measures (PAM-13 ) . 54 – 67PAM-13 activation stage (composite of 13-items) . 54Responsible for taking care of own health problems . 55Active role is most important thing affecting health . 56Confident can help prevent health problems . 57Knows what prescribed medications do. 58Confident can tell when to contact doctor . 59Confident can tell doctor concerns . 60Confident can follow through on treatments at home . 61Understand health problems and causes . 62Knows available treatments . 63Ability to maintain lifestyle change . 64Knows how to prevent further problems . 65Confident can find solutions to new health problems . 66Confident can maintain lifestyle changes. 67 Bar Charts – Nurse Case Manager Questions (enrolled clients), DSHS . 68 – 72Has a nurse case manager . 68Nurse talks about managing pain . 69Nurse gives information to quit tobacco use . 70Information to quit smoking helped . 71How often nurse was helpful . 72 Bar Charts – Demographics Questions, CAHPS . 73 – 75Rate overall health . 73Age . 74Education . 752008 Washington State Medicaid King County Care Partners Chronic Care Management ProgramClient Satisfaction SurveyA complete copy of this report is available at http://hrsa.dshs.wa.gov/News/Brief4Leg.htmii
AcknowledgementsThanks to the members of the Consumer Assessment of Healthcare Providers and Systems (CAHPS )survey workgroup who assisted with the development of the survey materials, the client brochure, and thestakeholder report.From the Health and Recovery Services Administration (HRSA): Shirley Munkberg, Acting Office Chief, Office of Quality and Care ManagementFrom the Aging and Disability Services Administration (ADSA): Candace Goehring, Unit Manager, Home and Community ProgramsDan Murphy, Office ChiefWe would like to thank:Qualis Health: Qualis Health, a health care quality improvement organization, coordinated the project, conducted theanalysis, assisted in development of the survey booklet, and developed this stakeholder report todisseminate the survey results.DataStat: Qualis Health coordinated with DataStat, Inc., a survey research organization located in Ann Arbor,Michigan, to collect the mail and telephone survey responses.Sincerely,Shirley MunkbergActing Office Chief, Office of Quality and Care ManagementHealth and Recovery Services Administration2008 Washington State Medicaid King County Care Partners Chronic Care Management ProjectClient Satisfaction SurveyA complete copy of this report is available at http://hrsa.dshs.wa.gov/News/Brief4Leg.htm1
IntroductionThis report is designed to enable the Health and Recovery Services Administration (HRSA) and otherorganizations to monitor and evaluate the performance of the King County Care Partners Chronic CareManagement Project. A client satisfaction survey was conducted and the responses of adults enrolled inMedicaid regarding their experiences with their health care services were analyzed. Medicaid recipientsfrom each of 3 program groups—randomized to participate and successfully enrolled in the project(―Enrolled‖), randomized to participate but not successfully enrolled (―Not Enrolled‖), and randomized tothe control group—were surveyed and the results are presented here. Details of the surveyadministration, sampling, response rates, and weighting can be found in the Detailed MethodologyReport.This report describes the background of the questionnaire, which includes questions from the MedicaidConsumer Assessment of Healthcare Providers and Systems (CAHPS ) survey, the 8-element ClientSatisfaction Questionnaire (CSQ-8), the 13-element Patient Activation Measure (PAM-13), the 5element EQ-5D, and questions developed by the Washington Department of Social and Health Services(DSHS). A description of project goals and how to interpret the results is included.Project BackgroundThis client satisfaction survey project used questions from 4 survey instruments: CAHPS survey, PAM13 , CSQ-8 , and EQ-5D. DSHS also included questions developed by department staff.The CAHPS survey tools were developed under cooperative agreements by Harvard Medical School, theRAND Institute, the Research Triangle Institute, and the Agency for Healthcare Research and Quality.HRSA has administered a version of CAHPS for various programs in Washington State for the past 12years. This is the first year a CAHPS survey has been used for the King County Care Partners ChronicCare Management Program. In CAHPS surveys, respondents provide information about their experienceswith of various aspects of medical care, including: Getting care that is neededGetting care without long waitsHow well doctors communicateHow people rated their health careHow people rated their personal doctor or nurseHow people rated the specialist they saw most oftenThe PAM-13 was developed at the University of Oregon Eugene by Judith H Hibbard, Eldon RMahoney, Jean Stockard, and Martin Tusler. The PAM-13 is constructed to measure the level of patientactivation in their own health care. The CSQ-8 was developed at the University of California SanFrancisco by Drs. Clifford Attkisson and Daniel Larsen in collaboration with Drs. William A. Hargreaves,Maurice LeVois, Tuan Nguyen, Robert E. Roberts, and Bruce Stegner. The CSQ-8 instrument isconstructed to measure general satisfaction with services received by individuals and families. The EQ5D is a widely used instrument to describe generic health status in terms of 5 dimensions: MobilitySelf-careUsual activities2008 Washington State Medicaid King County Care Partners Chronic Care Management ProjectClient Satisfaction SurveyA complete copy of this report is available at http://hrsa.dshs.wa.gov/News/Brief4Leg.htm2
Pain/discomfortAnxiety/depressionEach dimension comprises 3 levels, indicating no problems, some or moderate problems, and extremeproblems. Assessing the percentage of enrollees who are in poor health or who have chronic conditionsis important to ensure adequate provider access, appropriate range of services, and financing for healthservices. Details of EQ-5D development and current status may be found online athttp://www.euroqol.org/.A copy of the 2008 survey instrument is included at the end of this report in Appendix A.Project GoalsThe primary goal of the Medicaid client satisfaction survey project is to provide timely information toHRSA to assist in evaluating the quality of the King County Care Partners Chronic Care ManagementProject. This information was collected through mail and telephone surveys that assessed clients'experiences with the health care and services they received through either standard Medicaid services or,if enrolled, the King County Care Partners Chronic Care Management Project.How to Use This ReportThis report is designed to allow HRSA and other stakeholders to identify key opportunities to improveclients' health care experiences. This report includes data from 2 Medicaid subpopulations: thoserandomized to the treatment and those randomized to a control group. A total of 1,110 surveys (37.2%) outof a sample frame of 2,984 eligible enrollees met completeness criteria for inclusion in this report byanswering at least 1 question in the survey.Results are displayed in a graphical format with 1 question per page. The first line of the page headingdisplays the program name (King County Care Partners Chronic Care Management Project). The secondline lists the question source (e.g., CAHPS, PAM-13 ). The third line is a brief description of the questioncategory (e.g., Your Personal Doctor, Utilization, Flu Shot) along with the question number from the originalquestionnaire.PAM-13 Activation StagesBased on a national sample of 1,469, Insignia Health defined 4 stages of increasing patient activation asshown in the table below. A total is calculated for each respondent based on their responses to 13individual questions. A response of ―Strongly Disagree‖, ―Disagree‖, ―Agree‖ or ―Strongly Agree‖ is awarded1, 2, 3, or 4 points, respectively. For items with a response of ―Not Applicable‖, the PAM raw score is therespondent’s total score divided by the number of completed items and multiplied by 13. If the respondentdid not respond ―Not Applicable‖ to any item, the total is the PAM raw score.2008 Washington State Medicaid King County Care Partners Chronic Care Management ProjectClient Satisfaction SurveyA complete copy of this report is available at http://hrsa.dshs.wa.gov/News/Brief4Leg.htm3
PAM-13 Activation Stage DescriptionPAM RawScoreActivationStageDefinitionPercent ofNational Sample(n 1,469) 47.0Stage 1May not yet believe that the patient roleis important11.8%47.1 to 55.1Stage 2Lacks confidence and knowledge totake action29.3%55.2 to 67.0Stage 3Beginning to take action36.5% 67.1Stage 4May have difficulty maintainingbehaviors over time22.3%What do the bar graphs tell you?A series of bar graphs display survey results on pages 7 – 75. Each page represents results for 1composite question or 1 question using 2 bar graphs; 1 for the treatment and 1 for the control group. Thenumber of clients answering each question is included as a footnote to each graph.Each bar graph is divided into 2-, 3-, or 4-response categories which represent the unadjusted percentresponse to one question or composite question for each subpopulation. The individual categories add upto 100%, although sections for some graphs may not appear to add up to 100% because of rounding ofindividual sections for display. Some responses were recoded down to 3 or 4 categories for easier visualinterpretation. For example, the global rating scales of 0 – 10, the ―How often‖ scales of never, sometimes,usually, always, and the CSQ-8 scales of 4 levels of agreement were recoded for display as threecategories. Client age, educational level and health care utilization questions were collapsed to 4categories. The "N/A" responses of the PAM-13 individual questions and ―don’t know‖ response towhether clients received a flu shot were ignored for display and statistical analysis. In no case did the ―N/A‖or ―don’t know‖ response exceed 8% of the total responses for either subpopulation.Readers should look for the number of stars assigned to each bar chart before drawing conclusions aboutdifferences among the randomized groups. See the next section on statistical significance for more details.Statistical SignificanceStars were added to each bar chart in which the responses of clients in the treatment group weresignificantly different than the responses of clients in the control group. P-values less than or equal to 0.05were considered significant. The number of stars added corresponds to the level of significance. Pleaserefer to the legend on the individual graphs for more specific details. When the treatment and control groupresponses to a question were not statistically different from each other, no stars were added to the barcharts.LimitationsPeople in worse health tend to report lower satisfaction and more problems with care than do people inbetter health. Older patients tend to report more satisfaction and fewer problems than do younger patients.There is some evidence that education level may affect scores as well, although the effects of age andeducation are not as strong as health status. Therefore differences in client satisfaction may be due tosampling error or self-selection bias and not to differences in program quality or satisfaction.2008 Washington State Medicaid King County Care Partners Chronic Care Management ProjectClient Satisfaction SurveyA complete copy of this report is available at http://hrsa.dshs.wa.gov/News/Brief4Leg.htm4
Additionally, there is potential response bias in the survey results. The accuracy of these findings dependson how well respondents represent the overall population under study. If the 37.2% of clients thatresponded to the survey are systematically different than the study population, then conclusions drawn heremay be incorrectFinally, due to the study design, in which clients were randomized to the treatment and control groups priorto enrollment in the program, an intent-to-treat analysis was performed. This means a large percentage ofthose clients randomized to the treatment group (and analyzed as such) chose not to enroll in the programand therefore did not actually receive program services. If in fact the program was effective in improvingclients' health care experiences and satisfaction, this would dilute the program effect and diminish the abilityof this survey to detect statistically significant differences.2008 Washington State Medicaid King County Care Partners Chronic Care Management ProjectClient Satisfaction SurveyA complete copy of this report is available at http://hrsa.dshs.wa.gov/News/Brief4Leg.htm5
Summary of Statistically Significant ResultsStatistically significant results of treatment and control group response comparisons are listed below.More clients in the treatment group reported: Needing or taking prescription medicine,Having moderate pain or discomfort―Strongly agreeing‖ that they were responsible for taking care of their health problems.Having a ―Fair‖ overall health ratingMore clients in the control group reported: Having extreme pain or discomfortNot feeling responsible for taking care of their health problems.Having a ―Good, Very Good or Excellent‖ overall health rating2008 Washington State Medicaid King County Care Partners Chronic Care Management ProjectClient Satisfaction SurveyA complete copy of this report is available at http://hrsa.dshs.wa.gov/News/Brief4Leg.htm6
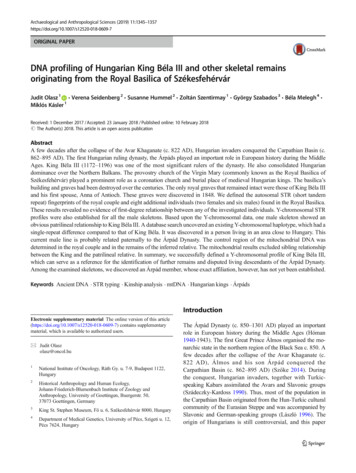
King County Care PartnersChronic Care Management ProjectConsumer Assessment of Healthcare Providers and SystemsCore: Question 7Results are based on 513 responses from the treatment group and 568 responses from the controlgroup to this question. When weighted these responses represent 1,452 and 1,454 individuals in thetreatment and control groups respectively.2008 Washington State Medicaid King County Care Partners Chronic Care Management ProjectClient Satisfaction SurveyA complete copy of this report is available at http://hrsa.dshs.wa.gov/News/Brief4Leg.htm7
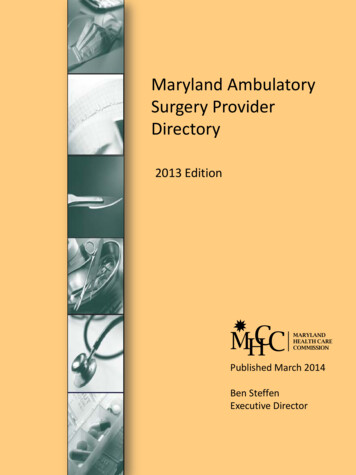
King County Care PartnersChronic Care Management ProjectConsumer Assessment of Healthcare Providers and SystemsCore: Question 17Results are based on 513 responses from the treatment group and 569 responses from the controlgroup to this question. When weighted these responses represent 1,452 and 1,456 individuals in thetreatment and control groups respectively.2008 Washington State Medicaid King County Care Partners Chronic Care Management ProjectClient Satisfaction SurveyA complete copy of this report is available at http://hrsa.dshs.wa.gov/News/Brief4Leg.htm8
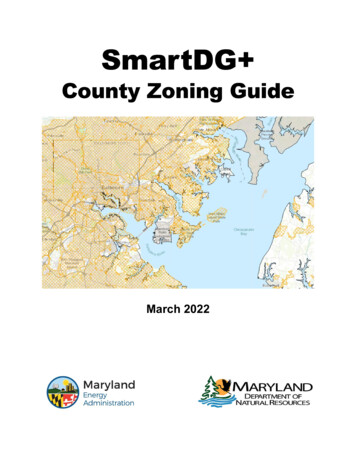
King County Care PartnersChronic Care Management ProjectConsumer Assessment of Healthcare Providers and SystemsCore: Question 31Results are based on 522 responses from the treatment group and 578 responses from the controlgroup to this question. When weighted these responses represent 1,478 and 1,479 individuals in thetreatment and control groups respectively.2008 Washington State Medicaid King County Care Partners Chronic Care Management ProjectClient Satisfaction SurveyA complete copy of this report is available at http://hrsa.dshs.wa.gov/News/Brief4Leg.htm9
King County Care PartnersChronic Care Management ProjectConsumer Assessment of Healthcare Providers and SystemsScreener Getting Care without Long Waits: Question 1Results are based on 509 responses from the treatment group and 565 responses from the controlgroup to this question. When weighted these responses represent 1,441 and 1,446 individuals in thetreatment and control groups respectively.2008 Washington State Medicaid King County Care Partners Chronic Care Management ProjectClient Satisfaction SurveyA complete copy of this report is available at http://hrsa.dshs.wa.gov/News/Brief4Leg.htm10
King County Care PartnersChronic Care Management ProjectConsumer Assessment of Healthcare Providers and SystemsScreener Getting Care without Long Waits: Question 3Results are based on 512 responses from the treatment group and 561 responses from the controlgroup to this question. When weighted these responses represent 1,449 and 1,436 individuals in thetreatment and control groups respectively.2008 Washington State Medicaid King County Care Partners Chronic Care Management ProjectClient Satisfaction SurveyA complete copy of this report is available at http://hrsa.dshs.wa.gov/News/Brief4Leg.htm11
King County Care PartnersChronic Care Management ProjectConsumer Assessment of Healthcare Providers and SystemsCore: Question 2Results are based on 506 responses from the treatment group and 567 responses from the controlgroup to this question. When weighted these responses represent 1,431 and 1,451 individuals in thetreatment and control groups respectively.2008 Washington State Medicaid King County Care Partners Chronic Care Management ProjectClient Satisfaction SurveyA complete copy of this report is available at http://hrsa.dshs.wa.gov/News/Brief4Leg.htm12
King County Care PartnersChronic Care Management ProjectConsumer Assessment of Healthcare Providers and SystemsCore: Question 4Results are based on 504 responses from the treatment group and 558 responses from the controlgroup to this question. When weighted these responses represent 1,425 and 1,428 individuals in thetreatment and control groups respectively.2008 Washington State Medicaid King County Care Partners Chronic Care Management ProjectClient Satisfaction SurveyA complete copy of this report is available at http://hrsa.dshs.wa.gov/News/Brief4Leg.htm13
King County Care PartnersChronic Care Management ProjectConsumer Assessment of Healthcare Providers and SystemsScreener Your Personal Doctor: Question 8Results are based on 515 responses from the treatment group and 560 responses from the controlgroup to this question. When weighted these responses represent 1,457 and 1,433 individuals in thetreatment and control groups respectively.2008 Washington State Medicaid King County Care Partners Chronic Care Management ProjectClient Satisfaction SurveyA complete copy of this report is available at http://hrsa.dshs.wa.gov/News/Brief4Leg.htm14
King County Care PartnersChronic Care Management ProjectConsumer Assessment of Healthcare Providers and SystemsCore: Question 11Results are based on 521 responses from the treatment group and 578 responses from the controlgroup to this question. When weighted these responses represent 1,475 and 1,479 individuals in thetreatment and control groups respectively.2008 Washington State Medicaid King County Care Partners Chronic Care Management ProjectClient Satisfaction SurveyA complete copy of this report is available at http://hrsa.dshs.wa.gov/News/Brief4Leg.htm15
King County Care PartnersChronic Care Management ProjectConsumer Assessment of Healthcare Providers and SystemsCore: Question 12Results are based on 520 responses from the treatment group and 579 responses from the controlgroup to this question. When weighted these responses represent 1,473 and 1,482 individuals in thetreatment and control groups respectively.2008 Washington State Medicaid King County Care Partners Chronic Care Management ProjectClient Satisfaction SurveyA complete copy of this report is available at http://hrsa.dshs.wa.gov/News/Brief4Leg.htm16
King County Care PartnersChronic Care Management ProjectConsumer Assessment of Healthcare Providers and SystemsCore: Question 13Results are based on 518 responses from the treatment group and 577 responses from the controlgroup to this question. When weighted these responses represent 1,467 and 1,477 individuals in thetreatment and control groups respectively.2008 Washington State Medicaid King County Care Partners Chronic Care Management ProjectClient Satisfaction SurveyA complete copy of this report is available at http://hrsa.dshs.wa.gov/News/Brief4Leg.htm17
King County Care PartnersChronic Care Management ProjectConsumer Assessment of Healthcare Providers and SystemsCore: Question 14Results are based on 519 responses from the treatment group and 579 responses from the controlgroup to this question. When weighted these responses represent 1,470 and 1,482 individuals in thetreatment and control groups respectively.2008 Washington State Medicaid King County Care Partners Chronic Care Management ProjectClient Satisfaction SurveyA complete copy of this report is available at http://hrsa.dshs.wa.gov/News/Brief4Leg.htm18
King County Care PartnersChronic Care Management ProjectConsumer Assessment of Healthcare Providers and SystemsYour Personal Doctor: Question 6Results are based on 516 responses from the treatment group and 573 responses from the controlgroup to this question. When weighted these responses represent 1,461 and 1,466 individuals in thetreatment and control groups respectively.2008 Washington State Medicaid King County Care Partners Chronic Care Management ProjectClient Satisfaction SurveyA complete copy of this report is available at http://hrsa.dshs.wa.gov/News/Brief4Leg.htm19
King County Care PartnersChronic Care Management ProjectConsumer Assessment of Healthcare Providers and SystemsYour Personal Doctor: Question 9Results are based on 460 responses from the treatment group and 501 responses from the controlgroup to this question. When weighted these responses represent 1,303 and
This client satisfaction survey project used questions from 4 survey instruments: CAHPS survey, PAM-13 , CSQ-8 , and EQ-5D. DSHS also included questions developed by department staff. The CAHPS survey tools were developed under cooperative agreements by Harvard Medical School, the