Transcription
January, 2022Int J Agric & Biol EngOpen Access at https://www.ijabe.orgVol. 15 No. 11Simulation of rice paddy systems in SWAT: A review of previousapplications and proposed SWAT rice paddy modulePhilip W. Gassman1*, Jaehak Jeong2, Julien Boulange3, Balaji Narasimhan4, Tasuku Kato3,Hiroaki Somura5, Hirozumi Watanabe3, Sadao Eguchi6, Yuanlai Cui7, Atsushi Sakaguchi8,Le Hoang Tu3, Rui Jiang9, Min-Kyeong Kim10, Jeffrey G. Arnold11, Wei Ouyang12(1. Center for Agricultural and Rural Development, Iowa State University, Ames, Iowa 50011-1070, USA;2. Blackland Research & Extension Center, Texas A&M AgriLife, Temple, Texas 76502, USA;3. Department of International Environmental and Agricultural Sciences, Tokyo University of Agriculture and Technology, Fuchu,Tokyo 183-8509, Japan; 4. Department of Civil Engineering, Indian Institute of Technology Madras, Chennai 600 036, India;5. Graduate School of Environmental and Life Science, Faculty of Engineering, Okayama University, Okayama 700-8530, Japan;6. Institute for Agro-Environmental Sciences, National Agriculture and Food Research Organization, Tsukuba 305-8604, Japan;7. State Key Laboratory of Water Resources and Hydropower Engineering Science, Wuhan University, Wuhan 430072, China;8. Department of Biological & Environmental Sciences, Faculty of Agriculture, Yamaguchi University, Yamaguchi 753-8515, Japan;9. Key Laboratory of Plant Nutrition and the Agri-environment in Northwest China, Ministry of Agriculture, College of Natural Resourcesand Environment, Northwest A&F University, Yangling 712100, Shaanxi, China; 10. Rural Development Administration, Jeonju, 54875,Republic of Korea; 11. Grassland Soil and Water Research Laboratory, U.S. Department of Agriculture – Agricultural Research Service,Temple, Texas 76502, USA;12. School of Environment, State Key Laboratory of Water Environment Simulation, Beijing Normal University, Beijing 100875, China)Abstract: The Soil and Water Assessment Tool (SWAT) is an ecohydrological watershed-scale model which was initiallydeveloped in the early 1990s to simulate the impacts of land use, management systems, and climate on hydrology and/or waterquality. First adopted in the U.S., the use of the model then spread to Europe and then later to Asia and other regions. Therange of applications that SWAT has been applied to have also expanded dramatically, which influenced ongoing modeldevelopment which has been virtually continuous over the past two decades. A key component of many SWAT applicationsin Asia is accounting for rice paddy production that is common in some subregions within the continent. However, most ofthese studies do not provide explicit details of how rice production was simulated in SWAT. Other research has revealed thatsignificant problems occur when trying to represent rice paddy systems in standard versions of SWAT, due to limitations inalgorithms based on the runoff curve number approach or the pothole option. In response, key modifications have been madeto SWAT in recent studies that have resulted in more accurate representation of rice paddy systems. These developmentspoint to the need for the incorporation of an enhanced rice paddy module within SWAT to better capture rice paddyhydrological and pollutant dynamics, which would support improved use of the model in Asia and other rice production regions.Subtopics related to simulating rice production in SWAT are discussed as follows: 1) an overview of global rice production; 2)history of SWAT development; 3) typical approaches for simulating rice production; 4) problems associated with the typicalapproaches; 5) recent code modifications to address deficiencies in replicating rice paddy systems; 6) recommendations fordeveloping a standard rice paddy module for future SWAT codes.Keywords: SWAT, rice paddies, potholes, hydrology, pollutants, modified SWAT modelsDOI: 10.25165/j.ijabe.20221501.7147Citation: Gassman P W, Jeong J, Boulange J, Narasimhan B, Kato T, Somura H, et al. Simulation of rice paddy systems in SWAT:A review of previous applications and proposed SWAT rice paddy module. Int J Agric & Biol Eng, 2022; 15(1): 1–24. Rice is a staple food for almost 50% of the global population,with nearly 90% of Asia’s population reliant on rice[1,2]. Riceproduction has risen steadily from the early 1960s[3], reaching atotal global level of 760 million t in 2017[4]. Rice productionReceived date: 2021-10-26Accepted date: 2022-01-14Biograhpies: Jaehak Jeong, PhD, Associate Professor, research interests:cropping systems modeling, watershed modeling, Email:jeongj@tamu.edu;Julien Boulange, PhD, Researcher, research interest: multi-scale environmentalmodeling, Email: boulange.julien@yahoo.fr; Balaji Narasimhan, PhD,Professor, research interest: hydrologic modelling, Email: nbalaji@civil.iitm.ac.in; Tasuku Kato, PhD, Professor, research interest: waterenvironment, Email: taskkato@cc.tuat.ac.jp; Hiroaki Somura, PhD, AssociateProfessor, research interest: water resources management, Email:somura@okayama-u.ac.jp; Hirozumi Watanabe, PhD, Professor, researchinterest: pesticide fate and transport, Email: pochi@cc.tuat.ac.jp; Sadao Eguchi,PhD, Senior Principal Researcher, research interest: soil and water management,Email: sadao@affrc.go.jp; Yuanlai Cui, PhD, Professor, research interest: waterresources management, Email: YLCui@whu.edu.cn; Atsushi Sakaguchi, PhD,Assistant Professor, research interest: water resources management. Email:asaka@yamaguchi-u.ac.jp; Le Hoang Tu, PhD, Researcher, research interest:GIS and environmental modeling, Email: tu.lehoang@hcmuaf.edu.vn; Rui Jiang,PhD, Professor, research interest: nitrogen and carbon biogeochemical cycle andnon-point source pollution in agriculture, Email: jiangrui@nwsuaf.edu.cn;Min-Kyeong Kim, PhD, Senior Researcher, research interest: water resourcemanagement. Email: kimmk72@korea.kr; Jeffrey G. Arnold, PhD, Engineer,research interest: ecohydrological modeling and basin scale assessment, Email:jeff.arnold@usda.gov; Wei Ouyang, PhD, Professor, research interest:watershed water pollution process, Email: wei@bnu.edu.cn.*Corresponding author: Philip W Gassman, PhD, Environmental Scientist;research interest: ecohydrological modeling and water quality. Center forAgricultural and Rural Development, Iowa State University, Ames, Iowa50011-1070, USA. Tel: 1-515-294-6313, Email: pwgassma@iastate.edu.1Introduction
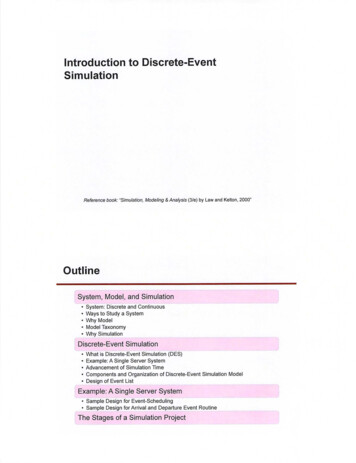
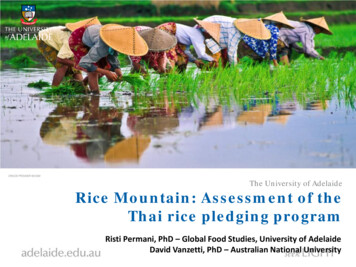
2January, 2022Int J Agric & Biol Englevels are expected to increase in several countries during2018/2019 including Bangladesh, Myanmar, Cambodia, Indonesia,Madagascar, Philippines, Sri Lanka, Tanzania, Thailand, UnitedStates and Vietnam[5]. Rice global demand is projected to reach800 million t by 2025[6]. Global reserve stocks of rice wereexpected to reach a level of 173 tonnes by the end of the 2018/2019marketing year[4], providing a strong reserve at present. However,the anticipated increasing population in Asia coupled with potentialadverse impacts of climate change and environmental problemspose significant future challenges for maintaining an adequatesupply of rice food stock in the future[6].Multiple environmental problems have been linked to modernrice production practices, including water pollution due toover-applied and improper use of fertilizers and pesticides,elimination of beneficial insects and wildlife, excessive saltbuild-up, and overuse of groundwater[2,7].Water qualitymonitoring has confirmed elevated in-stream pesticide levels due torice production in Japan[8,9], Vietnam[10,11], Philippines[12],Thailand13], and several European countries[14]. Excess nitrogenand phosphorus losses have been linked to over-fertilization andother rice production practices in several regions including riceproduction areas in South Korea[15,16], China[17-19], and Japan[20](however, reduced nitrogen exports from rice paddies can alsooccur due to retention in the paddy and denitrification resultingfrom anoxic conditions[21]). Suspended sediment generated duringpuddling procedures can also be exported from rice paddies[20].Rice production systems have been implicated as significantsources of agricultural methane (CH4) emissions, due primarily torice grown in flooded paddies which results in favorable conditionsfor methane-producing bacteria[22].Techniques focused onreducing or interrupting irrigation, including alternate wetting anddrying, can help mitigate CH4 emissions[22] but may exacerbateN2O emissions[17]. Other environmental problems attributed torice production include paddies functioning as sinks for heavymetal contamination due to agricultural chemical, wastewaterirrigation, sewage sludge, and other inputs[23] and elevated levels oferosion due to excessive tillage in upland rice fields, which arecommonly located in fragile ecosystems with vulnerable soils inmountainous or other sensitive areas[2,24,25].Numerous models have been developed to simulate differentaspects of growth, water management, and/or environmentalimpacts of rice production. Some of these models focus primarilyon simulating rice crop growth and yield, taking into accountvarious aspects of rice water, nutrient, and cultivation managementpractices[26-29]. Other models have been designed to simulate thehydrologic balance, pesticide fate, and transport dynamics, and/orcycling and transport of other pollutants, which have been appliedprimarily for single rice paddies[30-34] or for a few small watershedareas[14,30,35].The Soil and Water Assessment Tool (SWAT) is awatershed-scale ecohydrological model[36-40] which has been usedworldwide to simulate an extensive range of watershed/river basinscales, environmental conditions, and climatic, management, landuse, and other scenarios[41-47]. The use of SWAT has expandedgreatly in Asia and elsewhere during the past decade, reflecting theincreasing demand for effective and flexible tools that can be usedto evaluate options for solving challenging water resource problemsthat are occurring across the continent. These SWAT applicationshave included dozens of studies that incorporated some level of riceproduction in the overall mix of land use simulated in themodel[48-57]. Many of these studies report satisfactory to strongOpen Access at https://www.ijabe.orgVol. 15 No. 1model testing results for the watershed systems that were simulatedin the respective analysis. However, the majority of these studiesreport no or only limited details of how rice production wasaccounted for in SWAT. Furthermore, several studies stronglysuggest that typical simulation methods used in SWAT do notadequately represent the characteristics of hydrological processesand pollutant transport that occur in rice paddy systems, includingconditions where it appears that the overall watershed hydrologyappears to be reasonably well simulated[15,58-64].The previous research performed with SWAT underscores thecritical need to develop a comprehensive and flexible modulewithin SWAT that can be used to simulate rice paddy systems morerealistically. The ability to account for differences in culturalpractices, water dynamics, and pollutant cycling/transport betweenmajor types of rice production systems is an important attribute ofsuch an enhanced SWAT rice paddy module. It is envisioned herethat the development of this module would build on the foundationof existing key studies[58-64] and recent modifications made to cohydrological model[38,65,66], resulting in the APEX-Paddy modelthat supports enhanced simulation of rice paddy conditions[67].Thus, the specific objectives of this study are to provide: 1) anoverview of major rice production systems used in Asia and otherregions; 2) a review of typical applications of SWAT thatincorporate rice production including inherent weaknesses instandard simulation approaches; 3) a description of keymodifications performed in recent SWAT applications that haveresulted in more realistic representation of rice paddy systems; 4) asummary of the improvements and results that have been obtainedwith APEX-Paddy; 5) a conceptual structure for the proposedSWAT rice paddy module.2 Rice production systemsThe vast majority of rice grown globally can be categorized aseither irrigated lowland or rainfed lowland, with considerablysmaller production areas managed as rainfed upland orflood-prone systems (Table 1) [2,24]. Supplemental irrigation maybe beneficial for some rainfed lowland production systems such ashas been shown for production areas in Nigeria [68] andCambodia[69]. Table 1 lists key characteristics of each of theserice production systems including global production statistics,field management schemes, and average annual yields. Irrigatedlowland rice is by far the dominant production system, resulting in75% of the overall global rice production on about 54% of thetotal global production area. Irrigated lowland rice systems arealso the most intensively managed, relying on irrigated water tomaintain continuous flooding of rice paddies and higher chemicalinputs on average of any of the rice production systems. Rainfedlowland systems comprise 19% of the remaining total global riceproduction while rainfed upland and flood-prone systemsrepresent just 4% and 2% of the overall global rice production,respectively. Flood-prone production areas[2] are characterizedby at least one of the following conditions: 1) covered with deeplevels of water that exceed 100 cm for 10 d to a few months; 2)subjected to flash floods for 10 d or longer; 3) coastal landscapeswhere vegetation experiences tidal submergence on a daily basis,and/or 4) locations with marginal soils where problems candevelop due to excess water.The global distribution of the irrigated lowland, rainfedlowland, and rainfed upland production areas is shown in Figure 1.Irrigated lowland systems are clearly the dominant production
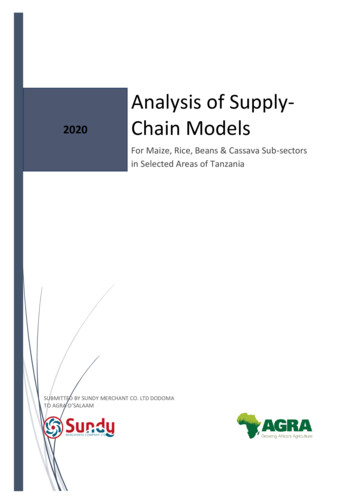
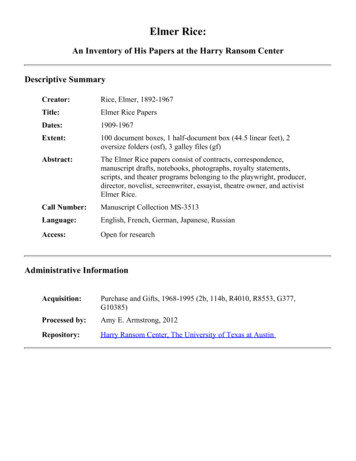
January, 2022Gassman P W, et al. Review of simulation of rice paddy systems in SWAT and proposed SWAT rice paddy moduleapproach in China, northern and southern India, the Indonesianislands of Java and Sumatra, South Korea, Japan, southern Brazil,the Malay Peninsula, and the Philippines, Madagascar, and othersmaller areas in Africa, Asia, Europe, and the United States.Rainfed lowland rice production is the primary system used inNigeria and in an arc that extends across the center of the Indiansubcontinent and into much of Southeast Asia and is also anTable 1Vol. 15 No.13important component of rice production in subareas of Indonesia,Philippines, South Korea, and Africa. Production of rainfedupland rice is the most prominent system in the western horn ofAfrica, the Democratic Republic of the Congo, and parts of CentralAmerica and South America, and also occurs in relatively smallareas of the Indian subcontinent, Southeast Asia, and theIndonesian and Philippine archipelagos.Characteristics of the three primary global rice production systemsRice production characteristicGlobal production area/million·hm-2Global production area/%Total global production/%Primary water sourceField typeExtent of flooded conditionsLevel of chemical inputsPotential total annual rice cropsAverage yields/t·hm 1Source: International Rice Research Institute (IRRI)[2].Irrigated lowlandRainfed lowlandRainfed uplandFlood .31-22.311.011.5Note: Each dot represents 10 000 hm2.Figure 1Global distribution of three primary forms of rice production[70]2.1 Issues regarding rice paddy hydrology and pollutanttransport dynamicsA wide range of rice production schemes exist within the threemain rice production systems described above. Examples ofdifferent rainfed or irrigated rice production systems are shown inFigures 2-7, which grown under differing conditions includingupland areas, lowland or valley areas, and terraced systems.Collectively, these images underscore the diverse types ofa. Rice terraces of Madagascarhydrologic conditions that rice is grown across the globe.Commonly, paddy fields retain runoff water resulting in reducedsoil erosion and sediment yield, and alleviation of downstreamflooding. They also release water slowly into the ground andrecharge groundwater.However, rice production is furtherimpacted by differing management schemes including the amountof irrigation or rain water inputs, puddling (wet tillage) or othertypes of tillage, the amount of pesticide and nutrient inputs, andb. Rainfed lowland rice paddies located in LaosFigure 2 Examples of rice production: (a) rice terraces of Madagascar, where rice is grown under different ecological conditions, fromuplands at the top of the slope, to more favorable rainfed and irrigated areas midway, to flood-prone areas at the bottom of the slope (farmersnormally grow different varieties based on adaptation to each condition)[25] and (b) rainfed lowland rice paddies located in Laos[71]
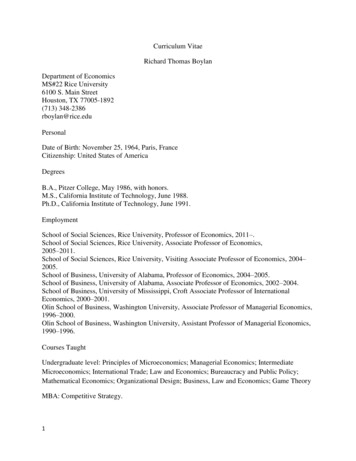
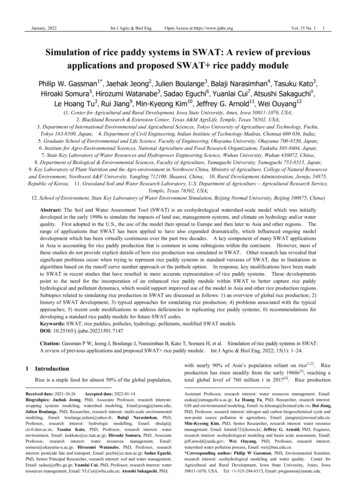
4January, 2022Int J Agric & Biol Enga. Irrigated valley lowland rice paddies in South KoreaOpen Access at https://www.ijabe.orgVol. 15 No. 1b. Irrigated rice fields in Rio Grande do Sul (RS) in southern BrazilFigure 3 Examples of rice production: (a) Irrigated valley lowland rice paddies in South Korea (Jeong J. Personal communication.Temple, Texas: Blacklands Research and Extension Center), and (b) irrigated rice fields in Rio Grande do Sul (RS) in southern Brazil(Tornquist C. Personal communication. Porto Alegre, RS, Brazil: Federal University of Rio Grande do Sul, Soil Science Department)a. Irrigated lowland rice paddies in the Aizu Regionb. Terraced rice paddies near the town of Misaki in Okayama PrefectureFigure 4 Rice production in Japan: (a) irrigated lowland rice paddies in the Aizu Region[72], and (b) terraced rice paddies near the town ofMisaki in Okayama Prefecture (Somura H. Personal communication. Okayama, Japan: Graduate School of Environmental and Life Science,Faculty of Engineering, Okayama University)a. Rainfed rice in LaosFigure 5b. Terraced rice in VietnamExamples of upland rice production: (a) rainfed rice in Laos[71], and (b) terraced rice in Vietnam[73]a. Near Fanjing Shan, Tongren District, Guizhou Province, Chinab. Yanting County, Sichuan Province, ChinaFigure 6 Examples of lowland rice production in China: (a) near Fanjing Shan, Tongren District, Guizhou Province, China (Crosby M.Personal communication. Cambridge, United Kingdom: BirdLife International), and (b) Yanting County, Sichuan Province, China [74].Figure 7Examples of Longli (Longsheng) terraced rice production[75] located in Longsheng Various Nationalities Autonomous County,Guangxi Province, China (Cheng Z, Personal communication. Yulin City, Guangxi Province, China)
January, 2022Gassman P W, et al. Review of simulation of rice paddy systems in SWAT and proposed SWAT rice paddy modulerotation and transplanting of rice seedlings versus broadcast orother seeding methods. Thus, the specific management regimesused within a given rice paddy or field have direct implicationsregarding the water quality impacts of stream systems that drain therespective rice production area.2.1.1 Taihu Lake region (China) exampleRice paddy fields occasionally release large amounts ofnitrogen and phosphorous to neighboring water bodies, mainly dueto the excessive use of fertilizers. For example, 75% of the36 500 km2 total drainage area to Taihu Lake in the Yangtze Riverdelta is dominated by rice production, which is one of the fivemajor rice production regions in China. Rice has been grown inrotation with wheat for thousands of years in this area, resulting inone of the most fertilized regions in the world and increasingconcern regarding environmental impacts due to high nitrogenloads including serious eutrophic conditions[18]. Rice and wheatseasons follow a distinct water regime within current standardfarming methods in the previously described Lake Taihu region.Flooding the field alternating with frequent draining (e.g., formidseason aerations and harvest) is a common practice during therice production periods. Contrarily, rainwater is the only sourceof soil moisture during wheat production seasons and rainfalllevels are typically lower during wheat seasons relative to the riceseasons. However, rainfall amounts are often still excessive forthe normal growth of wheat plants due to the subtropical monsoonVol. 15 No.15climate, which usually results in the need for drainage ditches toprotect the wheat plants from waterlogging injury. These distinctwater schemes can influence the transformation and migration ofN, and cause great variations in runoff and leaching N lossesbetween rice and wheat seasons. One lysimeter study reportedthat N runoff and leaching are actually greater in wheat seasonthan in rice season[19], indicating that improved nutrientmanagement is needed for the overall rice-wheat rotationalproduction system to successfully mitigate the Lake Taihueutrophic conditions.2.1.2 General schematics of rice paddy water allocationA general schematic of possible hydrologic sources for ricepaddy and subsequent discharge to potential downstream receivingwater bodies is presented in Figure 8. A paddy field can beirrigated from a single source or multiple sources during the growingseason. These irrigation sources can be reaches, aquifers, ponds,reservoirs, paddy fields or other sources. Similarly, water in thepaddy may discharge to channels, ponds, reservoirs, or anotherpaddy field via a weir. Percolation from the paddy field rechargesthe shallow aquifer underneath the paddy field. The exactconfiguration of the hydrologic dynamics for a given rice paddysystem will have further implications on water quality impacts suchas the one described for the Taihu Lake region example. However,the focus in this sub-section is on the hydrologic interactions invarious types of rice paddy systems.Figure 8 Example types of paddy irrigation sources and hydraulic connections to downstream flowPaddy Example 1: This example represents a typical lowlandpaddy field (Figure 9). The paddy field is in part irrigated from ashallow well (Aquifer 1) and it also receives irrigation water from areservoir (Res 1). The paddy drains into Channel 1.Figure 9 Graphical schematic of a paddy field having multiplesources of irrigationA common version of the system portrayed in Figure 9 involvestwo channels: one that conveys irrigation water and a second thatroutes drainage water. In Japan, after land consolidation of paddyfields, the separation of irrigation and drainage canals is typicallyinstalled, especially for lowland and large paddy field areas. However,rice paddy systems also exist in Japan that rely on the same channelfor obtaining irrigation water as well as receiving drainage water fromthe paddies. Dual-purpose canals for irrigation and drainage areinstalled for small-scale paddy field areas before land consolidation.Similarly, Choi et al.[67] describe two lowland paddy sites inSouth Korea that rely on irrigation water from irrigation canals.The water that is discharged from the paddies is routed to a drainagecanal, which is a different channel than the irrigation source channel.These types of lowland rice paddy systems are very commonthroughout South Korea.Paddy Example 2: Paddy fields are often developed in a terracesystem in steep valley areas following natural contours of the land(Figure 10). Irrigation systems in these paddies allow water to flowfrom the top floors of paddy down to lower level paddies throughweirs and drainage conduits. In this example, Paddy 1 in the upperlevel is irrigated from Channel 1. Weir discharge from Paddy 1drains to Paddy 2, the immediate lower level paddy. Paddy 2 drainsinto Channel 2.Figure 10 Graphical schematic of a cascading paddy system
6January, 2022Int J Agric & Biol EngA variant of this system is common in India without the terraces.In these systems, water is routed between two or more rice paddiesbut there is no cascading of flow between terraces because thepaddies are located in lowland locations. Small ponds are oftenused as water sources for flooding rice paddies in India. However,drainage to a second aquifer (Figure 8) usually does not occur.3 Comparisons of rice production and water qualitymodelsAs noted previously, a number of models have been developedfor either simulation of rice production or accounting of waterquality impacts for single rice paddy. Production models arecommonly used to evaluate various managements, cultivars, orclimate change effects on rice production at the field scale. Thesemodels are considered inadequate for simulating downstream wateryield, water quality, or surface-subsurface hydrologic interactions.In addition, essentially none of the rice water quality models cansimulate watershed-scale water quantity/quality impacts. Severalof the key rice production and water quality models are discussedhere in the context of comparisons with the SWAT andAPEX-Paddy ecohydrological models, which can simulate both riceproduction and water quality impacts at a watershed scale (althoughwith limitations). A more in-depth description of the use of SWATand APEX-Paddy for simulating rice production systems is providedin the following sections.3.1 Rice production modelsEfforts on simulating rice (Oryza sativa L.) have been focusedon estimating the growth and production of rice with conventionalfield-scale models. ORYZA (v3)[26] is the third-generation ricesimulation model developed by the International Rice ResearchInstitute (IRRI) which can simulate the growth and development ofthe rice based on water, carbon, and nitrogen availability in uplandand lowland rice fields under potential production, andwater-limited and nitrogen-limited conditions.This modelsimulates the growth of rice in five phenological stages includingemergence, panicle initiation, flowering, and maturity.CERES-RICE[28] is part of the Crop-Environment ResourcesSynthesis (CERES) family of crop models.CERES-RICEsimulates rice growth in nine phenological stages based on thermaltime (or growing degree days) using eight generic parameters.Aquacrop v. 6.1[29] simulates rice growth based on theproportionality between relative yield decline and relativereduction in evapotranspiration occurring in the soil root zone.Grain yield is calculated by multiplying harvest index (HI) tobiomass. During growing seasons, HI linearly increases from theflowing stage until maturity is obtained.The SWAT and APEX ecohydrological models feature cropgrowth submodels that originated in the Environmental PolicyIntegrated Climate (EPIC) field-scale environmental model[38,66,76].These submodels calculate potential daily biomass growth based onsolar radiation and heat units, then actual growth is estimated basedon stresses caused by limited water, temperature, nutrient, salinity,root aeration, and soil pH which provide less than ideal growthenvironment.These models use multiple sinusoidal curverelationships for estimating crop growth and development.Phenological stages are not considered in these submodels. Eventhough a number of studies found that these models predict grain(or biomass) yield accurately[68,76], these models are less sensitiveto stressful growth conditions during sensitive phenological periods;e.g. water stresses during the grain-filling period which wouldreduce HI.Open Access at https://www.ijabe.orgVol. 15 No. 13.2Rice water quality modelsSeveral models have been developed to analyze water qualitydynamics for a single rice paddy, most of which focus on pesticidefate and transport. Applications of multiple versions of thePADDY[77] and Pesticide Concentration in Paddy Field (PCPF)[78,79]models were described for pesticide movement in Japanese ricepaddy conditions[23}. The authors also discuss the use of the RiceWater Quality (RICEWQ) model[14] for European rice paddypesticide fate and transport assessments. Further comparisons ofRICEWQ[14], PCPF-1, and an additional model are described for arice paddy production area in northern Italy[80]. Two other studiesdescribe the simulation of pesticide transport for one or more ricepaddies in Vietnam[32] and California[33].In contrast, thePADDIMOD model was used in two studies that report simulatednutrient transport output versus measured data collected for a ricepaddy field site southeast of Seoul, Republic of Korea[34,81]. TheChemicals, Runoff, and Erosion from Agricultural ManagementSystems (CREAMS) model for rice paddies (CREAMS-PADDY)was also used to assess nutrient movement in rice paddies in SouthKorea[82]. None of these models are applicable at the watershedscale. At least three modeling systems have been developed [62]that are designed to simulate the hydrologic and pesticide transportimpacts of rice production at the watershed scale including amodified version of the PADDY model called PADDY-Large[23,28].However, these modeling systems are limited by either a focus onjust rice production areas in a given watershed, and thus other landuse is ignored, or by a constraint that the transport of only ricepesticides can be simulated (and thus other pollutants cannot beaccounted for)[62].The SWAT model has been used extensively to simulate waterquantity and/or quality impacts for watersheds in Asia andelsewhere that are at least partially characterized by rice productionas key agricultural land use. And SWAT is able to account for allland uses in a given watershed. However, the level of detail usedto represent rice systems varies greatly across these simulationswith some providing virtually no information on how rice wasrepresented. Problems have been encountered when efforts weremade to simulate rice paddy hydrological dynamics using thestructure available in standard SWAT codes[58,59]. The structurallimitations pertaining to simulating rice paddies in standard SWATcodes have resulted in several research efforts to modify the modelto better represent various aspects of rice paddyproducti
Center for Agricultural and Rural Development, Iowa State University, Ames, Iowa 50011-1070, USA; 2. Blackland Research & Extension Center, Texas A&M AgriLife, Temple, Texas 76502, USA; 3. Department of International Environmental and Agricultural Sciences, Tokyo University of Agriculture and Technology, Fuchu, Tokyo 183-8509, Japan; 4.