Transcription
Thin-wall injection molding of polystyrene parts with coated anduncoated cavitiesMasato Davidea,b, †, Sorgato Marcoa, Babenko Maksimsb, Whiteside Benb, Lucchetta GiovanniaaDepartment of Industrial Engineering, University of Padova, via Venezia 1, Padova, ItalybFaculty of Engineering and Informatics, University of Bradford, Bradford, UK†corresponding author, davide.masato@phd.unipd.it
Thin-wall injection molding of polystyrene parts with coated and uncoated cavitiesMasato Davide, Sorgato Marco, Babenko Maksims, Whiteside Ben, Lucchetta GiovanniAbstract. Low-friction mold surface coatings can be used to promote filling of thin-wall parts throughreduction of the melt flow resistance by causing wall slip at the polymer-mold interface. This workinvestigates the effects of different mold coatings (DLC, CrN and CrTiNbN) on the flow resistance ofmolten polystyrene in thin-wall injection molding. The design of the mold allowed high-speedvisualization of the molten polymer flow during the filling phase and measurement of the velocityprofile across the cavity thickness. The evaluation of the speed profiles allowed the characterization ofthe wall-slip phenomenon, indicating the absence of conventional ‘fountain-flow’ filling mechanism.The results indicate that a DLC deposited on a chrome substrate can significantly reduce the flowresistance of polystyrene, by increasing the slip velocity of polymer melt in contact with the moldsurface. Moreover, the contact angle of molten polystyrene over the considered coatings was found tobe inversely proportional to the melt flow resistance, indicating the importance of the adhesion at thepolymer-mold interface.Keywords: injection molding; wall slip; coatings; flow visualization; wetting
AbbreviationsRHCMRapid Heat Cycle MoldingPIVParticle Image VelocimetryDLCDiamond Like CarbonCrNChromium NitrideCrTiNbNChromium Titanium Niobium NitridePA-CVDPlasma Assisted – Chemical Vapour DepositionSaArithmetical mean height
1. IntroductionReducing the main thickness of injection molded parts leads to material cost savings and loweroverall environmental impact (lower resources consumed and improved efficiency). Moreover, asanalyzed by Thiriez and Gutowski, the cycle time is shorter for thinner parts making theenvironmental and economical burdens related to the process less significant too [1]. Thin-walldesigns are common in micro-structured components for optical and biomedical applications, suchas light guide plates and microfluidic devices. For instance, Masato et al. studied the manufacturingof plastic bio-MEMS for blood depletion characterized by a thin-wall substrate, indicating therelation between the filling mechanism and the replication of micro features [2].The main feature of thin-wall injection molding is the high flow-length to thickness ratio,which requires a high cavity pressure at the gate during the filling phase to achieve the designedflow length. The polymer viscosity combined with the small cross sectional area of the channelresults in a very high-pressure gradient along the component, ultimately hindering the completereplication of mold geometry at the end of flow [3]. In fact, the pressure at the gate is the mainfactor determining the filling length of a thin-wall cavity [4].For reduction of the melt flow resistance, different solutions have been considered in theliterature, focusing mostly on optimization of the most significant process parameters, such asinjection speed and mold temperature [5]. Reduction of the flow resistance has been achieved bymeans of Rapid Heat Cycle Molding (RHCM), which sustains the mold cavity surface temperatureat relatively high temperature during the filling phase, and then reduces the temperature duringcooling so the correct ejection temperature can be achieved. De Santis and Pantani suggested thatthis counteracts the development of the solidified skin layer (which effectively reduces the crosssectional area of the channel) and sustains a lower viscosity of the polymer melt (by reducingcooling rates) [6]. Using RHCM, McFarland et al. molded polystyrene cantilever beams
characterized by a thickness of 10 μm and aspect ratio higher than 170 [7]. Similarly, Chang andHwang used infrared heating to increase the flow length [8], while Sorgato et al. pursued the sameobjective using electrical heating and they obtained improvements up to 50% [9]. As an alternativeto RHCM, which requires high initial investments for the mold and complex optimization [10],high-speed injection molding can also be used to allow the polymer melt to completely fill thecavity before the thickening of the skin layer hinders the flow at the core. Masato et al. studied themorphology of a thin-wall cavity (i.e. with a thickness of 350 μm) observing that the extremelyreduced thickness results in the absence of the core layer [11]. However, the non-uniform cavitypressure distribution and high shear stresses caused by the high injection speed leads to aestheticdefects, such as flow marks, evidence of polymer degradation and sink marks [12].Recently, Lucchetta et al. evaluated the effects of mold surface coatings made from lowthermal conductivity materials on the reduction of melt flow resistance [13]. Indeed, delaying heattransfer during filling can lead to improvements on the quality of the parts, as shown by Chen et al.for ABS parts molded using TiN and PTFE coatings [14]. These studies provided new insight aboutthe effects of cavity surface coatings on the thermal and tribological boundary conditions at thepolymer-mold interface. However, the reduction of the melt flow resistance needs to be thoroughlycharacterized, especially considering its relationship with the rheology of the polymer melt duringthe injection phase. Indeed, for thin-wall injection molding the rheological behavior is morecomplex, due to the effects of pressure [15] and viscoelasticity [16] on polymer viscosity.According to Zhiltsova et al., the filling of thin-wall injection molding cavities is influenced bythe occurrence of the wall-slip effect [17]. In fact, high values of shear rate increase the shear stressat the wall, leading to the disentanglement of the bulk polymer chains [18] and consequently to theunsuitability of the no-slip hydrodynamic boundary condition, which is normally assumed for the
polymer flow in injection molding. Hatzikiriakos et al. suggested that this effect could be furtherpromoted through the use of hat are generally characterized as ‘low friction’ [19].In injection molding, the wall shear stress generally increases with shear rate for a non-slippolymer-wall interface, as indicated by Zhang and Gilchrist [20]. However, Kelly et al. observedthat when the shear rate exceeds 107 s-1, the shear stresses can be greater than the critical valuesleading to deviation from linearity due to the onset of wall-slip [21]. Chien et al. analyzed the cavitypressure drop of polymer melts flowing in injection molding cavities characterized by high shearstress distribution, observing that the wall-slip effect plays a dominant role [22]. Similarly, Chen etal. used a slit flow geometry to evaluate the reduction of the apparent viscosity that follows theonset of the wall-slip effect in thin-wall injection molding [23]. However, both experiments werecarried out under isothermal molding conditions (i.e. mold temperature equals melt temperature),which do not apply in injection molding. Moreover, the intensity of the wall-slip phenomenon andof its effect on the melt flow resistance is connected with the properties of the polymer-moldinterface [17]. Indeed, according to Yu et al., interface phenomena, such as wall slip, polymersurface tension, roughness and heat transfer, play a fundamental role in thin-wall injection moldingthat warrants further investigation [24].In this work, the influence of different mold surface coatings (diamond like carbon, chromiumnitride, chromium titanium niobium nitride) on wall slip of polystyrene was experimentallyinvestigated under injection molding process conditions. The filling flow in thin-wall coatedcavities was characterized using high-speed particle tracking of the injected polymer. The acquiredframes were analyzed by means of Particle Image Velocimetry (PIV) techniques in order toevaluate the slip velocities yielded by the different mold surface coatings. Eventually, the melt flowresistance was related the slip velocity and to the wetting properties of the coatings.
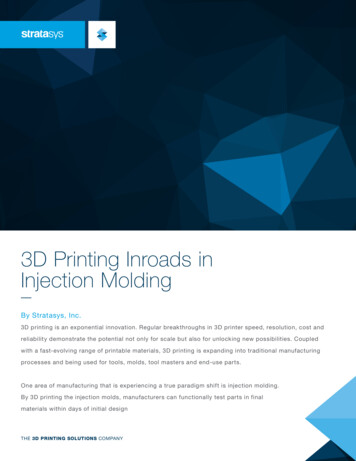
2. Materials and methods2.1 Part and mold designIn this study, the effects of wall slip in thin-wall injection molding were characterized bymonitoring the pressure drop of the polymer melt during the filling phase. Two pressure transducerswere flush mounted along the flow channel and allowed characterization of the pressure drop.The mold cavity considered for the investigation is a thin-wall open flow channel,characterized by a length of 40 mm, a width of 6 mm and a thickness of 0.4 mm. An open-flowcavity was designed in order to sustain the injection of the polymer melt until stationary flowconditions are reached within the cavity. Indeed, the pressure signal after filling the cavity reaches asteady-state value, which represents the equilibrium between the heat convected by the injectedpolymer melt and that removed by conduction through the mold surface.The mold assembly was based on a Hasco K-standard modular system. The mold was designedto allow mounting of interchangeable inserts with different coatings, on both fixed and movinghalves, as shown in Fig. 1. Several centering elements and coupling units were introduced toguarantee the accurate coupling of the two mold halves upon closing.In order to characterize the velocity profiles of the melt flow across the channel thickness, thetool allowed the direct visualization of the cavity side during the molding cycle. Two sapphirewindows (diameter: 12 mm, thickness: 7 mm) were mounted on the moving mold half (Fig. 1)allowing visualization and illumination using a transmission (rather than reflective) configuration.The mold temperature was set and controlled using two electrical cartridge heaters (diameter:6.5 mm) and a single thermocouple in each of the mold fixed and moving halves.
Fig. 1. Design of the mold inserts holders for the fixed and moving mold halves, respectively.2.2 Coating selectionThree different types of mold surface coatings were selected according to their tribology,hardness and thermal properties: (i) diamond like carbon (DLC), (ii) chromium nitride (CrN) and(iii) chromium titanium niobium nitride (CrTiNbN). All the coatings were deposited by means ofPlasma Assisted – Chemical Vapour Deposition (PA-CVD). The use of two distinct adhesion layers(i.e. Cr for DLC v01 and CrN for DLC v02) allowed the deposition of two different DLC coatings.Table 1 reports the main properties of the selected coatings.Table 1. Main properties of the selected mold surface coatings.PropertyTest MethodDLC v01DLC v02CrNCrTiNbNCoatingthickness [µm]UNI 1071 – 22.0 0.52.0 0.52.5 0.53.0 0.5Adhesion [N]UNI 1071 – 355 455 480 580 5Hardness [HV]IOS 14577 – 12200 3002200 3002050 3002973 263
FrictioncoefficientASTM G99 –040.15 0.050.15 0.020.60 0.050.65 0.05Adhesion layer-CrCrNCrCr2.3 Insert characterizationThe surface coatings were deposited onto polished mold inserts (Sa 0.2 μm beforedeposition) made of hardened and tempered H13 chromium-molybdenum steel, having a hardnessof approximately 50 HRC.In order to isolate the effects of surface coatings on the melt flow resistance, the surfaceroughness of the mold inserts was analyzed at five locations over the coated area by means of laserconfocal microscopy (Olympus, LEXT OLS4100).The average values of the surface roughness (Sa) evaluated on the different mold inserts werein the range 30 to 50 nm (Table 2). According to the literature, the effect of surface roughness onthe filling flow is significant only below a critical cavity thickness value, which was identified at150 mm [25,26]. For thicker cavities, the melt flow resistance is not affected by different roughnessvalues of the mold surface. Thus, for the purpose of the current investigation, the topography of themold inserts was considered comparable and possible effects of surface roughness on the melt flowresistance were neglected.Table 2. Roughness values for the mold inserts.CoatingUncoatedDLC v01DLC v02CrNCrTiNbNSa [nm]Avg. Val.Std. Dev.41937832114394613
The geometry of the coated inserts, assembled into the fixed and moving mold halves, wascharacterized considering form errors and depth uniformity of the coated channel, in order to avoidany significant geometrical difference among the channels.2.4 Material and manufacturing systemThe polymer selected for the injection molding experiments was an amorphous polystyrene(Total, PS Crystal 1540). Table 3 reports the main properties of the polymer.Table 3. Main properties of the polystyrene used for the molding experiments.PropertyUnitTest MethodValueDensityg/cm3ISO 1183-2:20041.04g/10minISO 1133-1:201112 CISO 11357-2:2013100Melt Flow Index(200 C – 5 kg)Tg (10 C/min)The injection molding experiments were carried out using a state-of-the-art micro injectionmolding machine (Wittmann Battenfeld, MicroPower 15) which is characterized by the separationof the metering (a 14 mm plasticizing screw) and injection systems (a 5 mm injection plunger). Themachine was selected for its performance in terms of maximum injection speed (750 mm/s) andmaximum injection pressure (2700 bar).2.5 Experimental designThe effects of mold coatings on wall slip and melt flow resistance were analyzed by varyingthe injection speed from 50 mm/s to 750 mm/s. The other main process parameters were fixed at
the values reported in Table 4, which were defined considering the literature, recommendations ofthe materials supplier and the technological limits of the available experimental setup.In order to achieve an adequate stability of the injection phase, 20 molding cycles wereperformed before the acquisition of the cavity pressure. For each molding condition 10 acquisitionswere collected, one every 5 cycles.Table 4. Process parameters selected for the injection molding 50,600,750Mold Temperature C80Melt Temperature C240Injection Speed2.6 Wetting characterizationThe wetting behavior of the surface coatings to the molten polystyrene was evaluated bymeasuring the contact angle of a melting cylindrical polymer sample. According to Lee et al., thewetting properties of the coatings were evaluated at the melt temperature adopted for the injectionmolding experiments (i.e. 240 C) [27]. The experimental setup used for the wettabilityexperiments included electrical heating of an insulated chamber, a light source and a high-speedcamera. The tests were performed by (i) heating the chamber up to the test temperature, (ii)inserting the coated surface sample and (iii) recording the wetting behavior of the melting polymerfor 10 minutes, as suggested by Sorgato et al. [9]. Images of the melting polymer sample werecollected every 90 s using a 25X magnification lens. The contour of the melt polymer drop wasdefined by fitting the base line with a straight line and the curved profile with an ellipse. Then, theleft and right contact angles were calculated at the intersection points.
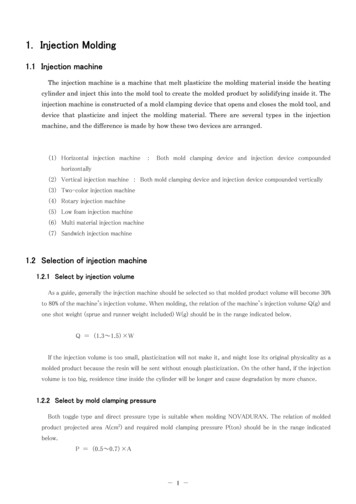
3. Process monitoring setup3.1 Cavity pressure measurementsThe effect of mold surface coatings on flow resistance was investigated by monitoring thecavity pressure drop during the injection phase. The pressure was measured in two positions (at 6mm and at 30 mm from the injection location) using Kistler 6182C piezoelectric pressuretransducers.The piezoelectric charge signal from the sensors was converted into output voltage signalusing a Kistler Type 5039A charge amplifier, which was monitored with a National Instruments NI9205 16-bit analog input module. The acquisitions were performed at a rate of 2500 s-1 (i.e. with atime step of 0.4 ms).The acquired pressure signals are characterized by a first growth characterizing the filling ofthe cavity; then, when the first polymer exits from the cavity, the pressure stabilizes to a steadystate value. The pressure measured closer to the injection location increases again at the end of theinjection stroke when the velocity of the plunger is decreased for the last few millimeters.The acquired cavity pressure curves were aligned to the beginning of the injection phase, andthe steady-state values of the cavity pressure were collected (Fig. 2). The melt flow resistance wasthen evaluated by calculating the difference between the average values of the steady–state zones ofthe two pressure signals (i.e. gate pressure, end pressure). In fact, the difference between thepressure values measured at the two extremities of the channel represents the pressure dropcharacterizing the mold cavity, which was selected as the response variable for the analysis.
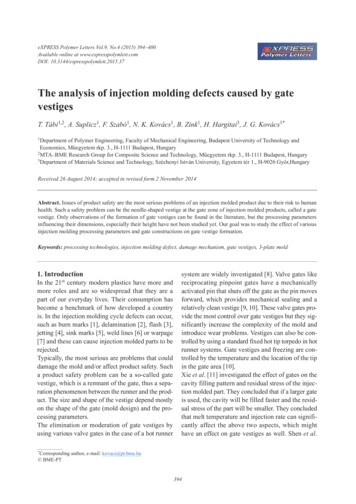
Fig. 2. Pressure evolution measured in the cavity by the two piezoelectric transducers.3.2 High-speed flow visualizationThe filling behavior of the polymer in the thin-wall cavity was characterized by direct highspeed flow visualization of the flowing polymer melt on the channel side. The main componentsand their position in the injection molding machine are shown in Fig. 3 (a). A high-speed camera(NAC, Memrecam HX-3) was aligned to the mold allowing observation through the sapphirewindow. The online monitoring of the process was performed using a compact telecentric lens (5XMitutoyo) with a 5x magnification and a working distance of 61 mm. The cavity was illuminatedby a white light LED illuminator (SugarCUBETM, LED Illuminator) connected to a fiber opticlight guide, which was positioned on the other side of the tool, aligned to the camera.The recording was triggered using a digital signal output from the machine that wassynchronous with the initial forward movement of the injection plunger during injection, after the
mold closed to the viewing position (Fig. 3 (b)). The image sequence was acquired with a framerate of 12,000 fps, a field of view of 0.53 mm x 3.2 mm and a resolution of 320 x 1920 pixels.Fig. 3. Setup used for the high-speed flow visualization of the polymer melt flow, with (a)indication of its main components and (b) detail of the field of view in the closed mold.3.3 Particle image velocimetryThe measurement of the velocity profile of the polymer melt was carried out using ParticleImage Velocimetry (PIV), which is an optical method for flow visualization used to performvelocity measurements of flowing fluids [28]. In this work, the PIV analysis of the filling phase wascarried out using silica carbide particles (particle size 17 μm), which were mixed with thepolystyrene pellets (1% weight) in the hopper of the injection molding machine.
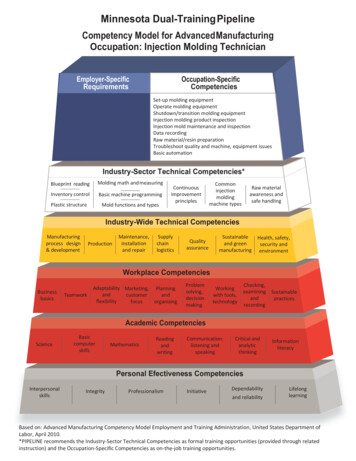
The acquired image sequences (Fig. 4) were processed using the java-based ImageJ software.For each image sequence, acquired for the different coatings at different injection speeds, thecoordinates of selected particles were tracked and then plotted against the filling time.High-speed visualization of the filling flow was carried out in order to:a) track the velocity profiles of the polymer across the cavity thickness as a function of the setinjection speed;b) evaluate the slip velocity of the polymer melt in the proximity of cavity walls and relate it tothe different mold coatings.Fig. 4. Frames of the cavity acquired (a) before the injection (empty cavity), (b) 1.2 ms after theinjection (flow front – view from its side) and (c) 4.7 ms after the injection (fully developedflow).4. Injection molding results4.1 Effect of coatings on flow resistance
The effects of the selected mold coatings on the flow resistance was analyzed considering thepressure drop in the channel, which was evaluated as the difference between the steady-state valuesof the pressure signals acquired in the two locations. Fig. 5 shows the dependence of cavity pressuredrop on injection speed and mold coating.Fig. 5. Experimental measurements of cavity pressure drop as a function of injection speed forthe different coatings.Comparing the experiments performed with the different coatings and the uncoated insert, it isclear that DLC v01 is the coating that most significantly reduces the cavity pressure drop, with anaverage reduction of about -28%. The effects of CrN (-3%) and CrTiNbN (-2%) are still positivecompared to the uncoated steel but less significant. Conversely, the results obtained with DLC v02indicated a negative effect on the cavity pressure drop ( 6%).For all the tested coatings, the observed effect of increasing the injection speed is to decreasethe cavity pressure drop until the achievement of a stabilized value at about 300 mm/s. In fact,during the injection phase, a thin layer of polymer is adsorbed at the mold surface interface thuscreating an insulating layer, whose thickness controls the pressure drop in the cavity. For increasing
flow rates, the thickness of the skin layers decreases until it reaches a minimum and so does thecavity pressure drop.The plateau observed at higher injection speed (i.e. from 300 to 750 mm/s) differs from thenormal increase that occurs in conventional injection molding. In fact, increasing the flow rate inthe cavity does not lead to higher pressure drop, which generally occurs due to the ‘fountain-flow’phenomenon [29]. Hence, the unconventional behavior observed for the cavity pressure drop as afunction of the flow rate, leads to the hypothesis that the flow conditions are affected by thepresence of slipping of the polymer melt occurring in the proximity of cavity walls (i.e. where theshear stress is maximum).4.2 Flow instability evaluationIn injection molding, when there is a non-slip condition at the mold-polymer interface, theshear stress at the wall increases for higher injection speed. However, in thin-wall injection moldingthe melt flow is characterized by an extremely high value of the wall shear stress, which can lead tothe onset of phenomena that are normally neglected for conventional injection molding, such aswall-slip [30].According to Mhetar and Archer [31], three slip regimes can be distinguished for moltenpolymers at increasing shear stress: (i) a weak-slip regime beyond a first critical stress (0.1-0.3MPa); (ii) a stick-slip regime with periodic oscillations of the melt flow; (iii) a strong slip regimecharacterized by stable flow conditions.The pressure curves acquired in the cavity, especially in the location closer to the gate, arecharacterized by the presence of periodic vibrations of the signal, as shown in Fig. 6. Theseoscillations of the plateau-value of cavity pressure indicate that the flow conditions of the injectedpolymer melt are not stable, thus suggesting the presence of wall-slip. This unstable behavior was
observed to become more evident for increasingly higher injection speed, indicating the effect ofthis process parameter on the instability of the flow conditions.Fig. 6. Cavity pressure curves acquired close to the injection location and evidence of signaloscillation for increasing injection speed.
Moreover, it was possible to observe that parts molded with injection speed up to 600 mm/s werecharacterized by the presence of small amplitude periodic distortions on their surface, which are relatedto wall slip [19]. Fig. 7 (a) shows the presence of such defects, also known as sharkskin in polymerextrusion, on the surface of a part injected at 450 mm/s. For higher injection speed (i.e. 750 mm/s), themelt flow shifts to a strong slip regime characterized by stable conditions. In fact, the surface of theinjected polymer is smoother and no sharkskin defects were observed, as shown in Fig. 7 (b).These observations agree with the findings from Münstedt et al. [32], which identified smoothflow conditions for the extrusion of polyethylene when increasing the shear rate above the stick-slipregime. Moreover, as reported by Rosenbaum et al., when flow conditions are characterized by strongslip the wall shear stress is constant for increasing shear rate [33].Fig. 7. Effect of flow instability on polymer injected at (a) 450 mm/s and (b) 750 mm/s – photoof the polymer flowed from the open-flow channel mold cavity.5. Flow visualization results
5.1 Characterization of speed profilesThe filling behavior of the polymer melt was characterized by means of high-speed directimaging of the flow. The speed profiles of the polymer melt in the uncoated cavity were evaluatedduring the injection phase by tracking the coordinates of the dispersed silica carbide particles.For each value of the injection speed, three injection molding tests with flow visualization werecarried out. The acquired image frames were analyzed with ImageJ to track the coordinates ofselected particles in at least 5 consecutive images. The camera was triggered to the forwardmovement of the injection plunger and the velocity of the polymer melt was evaluated when thepressure signal had reached its plateau-value.Fig. 8 reports the results obtained for the coordinates tracking for three repeated injectionmolding tests executed at an injection speed of 50 mm/s. The position of the silica carbide particlesadvances linearly along the channel and the slope of the plot represents the actual polymer speed.The characterization was performed by exploiting the symmetry of the cavity, and the particleswere tracked in only one half of the channel. In order to thoroughly characterize the speed profiles,for each value of the injection speed 5 particles were selected across half of the thickness of themold cavity. Thus, for each value of the injection speed 15 particles were tracked, for a total of 90.
Fig. 8. Coordinate tracking of silica carbide particles in consecutives frames along the cavity (for aninjection speed of 50 mm/s).The results of the characterization of the speed profiles for the uncoated cavity are reported inFig. 9, showing the actual polymer speed along the thickness of the cavity for injection speedranging from 50 to 600 mm/s.For all the considered injection speed values, the velocity profiles in the thin-wall cavity arequite flat, which shows that the injected polymer melt is characterized by a plug flow. This provesthe presence of wall slip in the thin-wall cavity. Wall slip could be observed for all the values of theinjection speed, indicating that the extremely reduced thickness of the cavity produced shear stressat wall that, in the investigated range of process parameters, are always above the threshold for theonset of wall slip.Two dimensionless numbers, Pe and Gz, were used to evaluate the non-isothermal process thatthe material experienced during the actual molding process. They all increase with increase ofinjection speed, as shown by Zhang and Gilchrist [20]. With 2x10⁵ Pe 3x10⁶, heat conductionalong the flow direction can be safely neglected.
The Graetz number (Gz) varies from 19 to 290; this indicates that heat convection along theflow direction is more important than transverse heat conduction. Gz can be used as a measure ofthe anticipated thickness of the skin layer. Higher values of Gz indicate the formation of thinnerskin layers. Bay and Tucker suggest that no skin will form if Gz 100 [34], which corresponds tovinj 200 mm/s in this study. Therefore the thickness of the skin layer is negligible and themeasured pressure stabilizes to a steady-state value (Fig. 2).Considering the behavior of the cavity pressure drop described in Section 4.1, it can beobserved that the thermal effect and the wall slip mechanism both contribute to the cavity pressuredrop. Specifically, for low injection speed the cavity pressure drop decreases due the combiningeffect of a smaller thickness of the skin layers and an increasing slip velocity. Increasing theinjection speeds, the thermal insulation effect decreases (cf. reduction of cavity pressure dropshown in Fig. 5 from 50 mm/s to 300 mm/s) while the slip velocity is continuously increasing (cf.Fig. 9). In fact, for higher values of the shear rate, the number of macromolecular disentanglingcontinuously increase leading to higher slip velocity, and thus smaller cavity pressure drop.When the transition to a strong slip regime occurs, the polymer macromolecular suddenlydisentangle from a monolayer of polymer chains adsorbed at the polymer-mold interface. Thus, thestrong slipping of the polymer is not occurring at a polymer-mold interface, but a polymer-polymerinterface [35].
Fig. 9. Velocity profiles for the injected polymer melt with the uncoated insert at different values of theinjection speed (0.00 mm corresponds to cavity thickness midplane and 0.20 mm to cavity wall).5.2 Slip velocitiesThe slip velocity of the polymer melt in contact with mold walls was then characterized for thedifferent mold surface coatings, by tracking the coordinates of the particles as close as possible tothe cavity walls. Indeed, due to optical limitations the minimum distance of the particles from thecavity wall was limited to 25 μm. The analysis was performed for the injection moldingexperiments carried out with an injection speed of 450 mm/s.Table 5 reports the average and standard deviation values of the slip velocity obtained from thePIV analysis of three injection molding replications. The results of the analysis show that thedifferent coatings result in different slip velocities of the polymer melt. In particular, DLC v01 isthe coating that resulted in the highest polymer slip velocity at the wall.Table 5. Slip velocity values for different coatings at an injection speed of 450 mm/s.
CoatingUncoatedDLC v01DLC v02CrNCrTiNbNSlip velocity [mm/s]Avg. Val.Std. Dev.243779265252231915320192092267189The slip velocities were then related to the cavity pressure drop measured in the inje
The mold cavity considered for the investigation is a thin-wall open flow channel, characterized by a length of 40 mm, a width of 6 mm and a thickness of 0.4 mm. An open-flow cavity was designed in order to sustain the injection of the polymer melt until stationary flow conditions are reached within the cavity.