Transcription
ANALELE ŞTIINŢIFICE ALE UNIVERSITĂŢII „ALEXANDRU IOAN CUZA” DIN IAŞITomul LII/LIIIŞtiinţe Economice2005/2006POVERTY MAPPING OF ROMANIAN COUNTIESUSING CLUSTER ANALYSISALINA MĂRIUCA IONESCU AbstractPoverty mapping plays a very important role in giving a visual representation of the intensity ofpoverty incidence by geographic area. This study tries to group Romanian counties taking intoaccount several indicators that describe the various dimensions of poverty. The method used forgrouping is cluster analysis.The main objective of this paper is to show how poverty mapping using cluster analysis can beemployed as a tool to identify homogenous poverty clusters of counties and help to reduce poverty bynecessary resource allocation. Thus, the policy-makers can easily detect the most poverty affectedareas and the poverty’s specific in these areas and can be guided to target the poor for the bestresource allocation to alleviate poverty.Key words: poverty, poverty mapping, poverty alleviation, cluster analysis1 IntroductionPoverty mapping is used for spatial identification of the poor (on which this paperconcentrates) and serves to target poverty-alleviation programs from rural anti povertyprograms to allocation of public services. It can assist practitioners in the formulation andimplementation of poverty reduction, food security and sustainable development strategies,and in the monitoring of progress in poverty alleviation.The choice of a poverty-mapping methodology depends on the objectives of thepoverty mapping exercise, philosophical views on poverty, limits on data and analyticalcapacity and cost. Data availability is a fundamental constraint in choosing a povertymapping method. This constraint has two levels: the existence of data, and access to existingdata. For example, using average values from disaggregated geographical units such ascounties/districts (as it is used in this study) instead of household-unit data has theadvantages that data requirements are less stringent and national statistical agencies may bemore likely to release county/district level averages on request.In this study, the method used for achieving poverty mapping is cluster analysis. It isapplied in order to identify homogenous poverty clusters of counties aiming to reducepoverty by necessary resource allocation.2 The method and the variables“Cluster analysis is the art of finding groups in data.” It aims “to form groups in such away that objects in the same group are similar to each other, whereas objects in differentgroups are as dissimilar as possible” [Kaufman & Rousseeuw, 1990, 1]. The measurements PhD student, Department of Statistics, Faculty of Economy and Business Administration,University “Alexandru Ioan Cuza” Iaşi, e-mail: ali.ionescu@gmail.com
Poverty Mapping of Romanian Counties Using Cluster Analysis381used in cluster analysis “can be organized in an n-by-p matrix, where the rows correspond tothe objects (or cases) and the columns correspond to the variables” [Kaufman & Rousseeuw,1990, 4]. In this example the cases are the n 41 Romanian counties for which there areconsidered p 13 continuous variables describing poverty that cover almost all thedimensions of this phenomenon: persons employed in agriculture, as a percentage of theemployed population – PAGR; persons living in rural areas, as a percentage of the totalpopulation – PRUR; poverty rate – RPOV; gross investments (thousands of millions –current prices) – GINV; life expectancy at birth (years) – LEXP; gross enrolment ratio –primary, secondary and tertiary schools (%) – GER; unemployment rate (%) – RUNP; infantmortality rate (per 1000 live births) – RINM; proportion of the population withoutsustainable access to electricity (%) – PWE; proportion of the population withoutsustainable access to water (%) – PWW; population per physician – P/PH; average netnominal monthly earnings – AVER; criminality rate (persons definitively convicted per100000 inhabitants) – RCRI.The Squared Euclidian Distance is chosen as proximity measure as it is frequentlyemployed when working with interval data. Letting xi and xj represent two cases (counties)in the p-variate space (where p 13), the squared Euclidian distance between the two items xiand xj is defined as the sum of squared differences between the values for theitems: d ij 213 (xf 1if x jf ) 2 .The variables considered in this study are expressed in different measurement units:years, persons, thousands millions of ROL, percentage etc. Therefore, data values arestandardized using z scores so as to equalize the effect of variables measured on differentscales.The reference year is 2002. For poverty rate the only available results at county levelare for 2003. The data sources are UNDP Romania's National Human Development Reportfor 2001-2002 and CASPIS’s (The Anti-Poverty and Social Inclusion Commission fromRomania) statistics.Statistical data processing was conducted using SPSS software.As the city of Bucharest presents extreme values for some of the considered variables,it is not included in the study and needs to be investigated separately.A principal components analysis was performed to verify if the chosen variables arerelevant for this study. The high values of the extraction communalities show that all thevariables fit well with the factor solution and could be kept in the analysis.Due to the fact that the investigated population’s size is relatively small (41counties),there are used hierarchical methods of clustering. In order to determine the most appropriatemethod for this study, there were applied all the seven hierarchical clustering methodsavailable in SPSS. The resulting dendograms showed that Ward’s method has differentiatedthe counties in the most clearly way and has found the most compact clusters.3 Results of cluster analysis3.1 Number of clustersThere is no exact procedure for determining the number of clusters. “To evaluate thenumber of clusters, one may always plot the criterion used to join clusters versus the numberof clusters” [Timm, 2002, 534]. For example, a shape elbow in the plot of distances versusthe number of clusters may be an indication of the number of clusters.
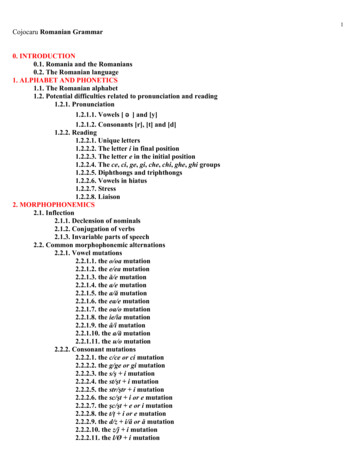
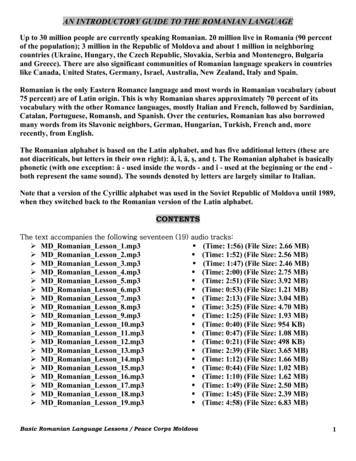
ALINA MĂRIUCA IONESCU382Stage1Cluster CombinedCluster 1 Cluster 2726Coefficients1.214Table no. 1 – Agglomeration ScheduleStage Cluster FirstNextStageCluster 1 Cluster 9174013Source: Results obtained with 63924026232931032273837333537363538394039400Table no. 1 shows how the counties are clustered together at each stage of the clusteranalysis. The Coefficients column indicates the distance between the two clusters (or cases)joined at each stage. The values here depend on the proximity measure (Squared EuclidianDistance) and linkage method (Ward’s method) used in the analysis.Fig.1 The agglomeration schedule coefficients plotFor a good cluster solution, a sudden jump can be seen in the distance coefficient as itcan be read down the table. The stage before the sudden change indicates the optimalstopping point for merging clusters. For this example, we should consider using a 9, 6 or 3cluster solution. For a better visualization of this criterion the “hockey stick” plot ofagglomeration schedule coefficients is displayed in figure 1. It can be easily seen that 9clusters remain after stage 32, 6 clusters after stage 35 and 3 clusters after stage 38.These three solutions are also illustrated in figure 2 which presents the dendogram.At a first look the dendogram shows three obvious clusters, which can be interpreted asit follows: one cluster consists of the most developed counties (AG, PH, MS, AB, DJ, IS,CT, HD, BV, SB, TM, CJ), another cluster refers to the counties with moderate intensity ofpoverty (BR, CS, CV, HR, GL, GJ, DB, OT, VL, BN, GR, SJ, IF, AR, BH, MM, SM) andthe other cluster groups the most poverty affected counties (CL, IL, TR, TL, BC, MH, NT,BZ, SV, VN, BT, VS). The counties groupings in 6 or in 9 clusters are the solutions that
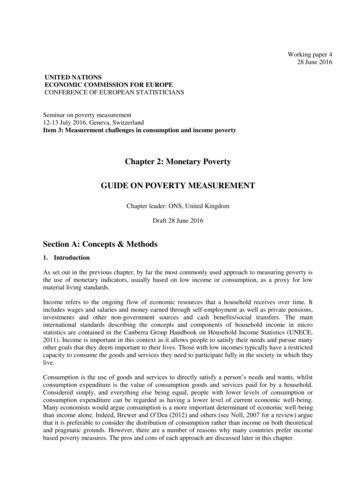
Poverty Mapping of Romanian Counties Using Cluster Analysis383differentiate the most clearly the clusters and identify the special case of Vaslui County thatforms a cluster by itself.Fig.2 Ward’s dendogram for the 3, 6 and 9 clusters solution3.2 Territorial distribution of the clustersFig. 3 Territorial distributions of the clusters for the 3 and 6 cluster solutionsThe 9 clusters – solution reproduces well enough the geographic repartition ofRomanian counties as it groups by twos and threes neighbor counties. This solution isefficient when preparing anti-poverty programs and policies that are to be applied to smallareas.If one wants to develop programs that focus on large areas (like regions of a country)then it is recommended to use the 6 clusters – classification as it reproduces more clearly thegeographical map of counties.The 3 clusters-solution provides the possibility of identifying three main directions forpoverty alleviation programs and policies: monitoring activities for the cluster that consistsof the most developed counties, specific measures for improvement of socio-economicindicators for the cluster of counties with moderate intensity of poverty and allocation ofimportant resources and implementation of radical programs for the cluster of the mostpoverty affected counties.3.3 Clusters’ profilesOnce the clusters are obtained, it is generally useful to describe each group using somedescriptive tools to create a better understanding of the differences that exist among thecreated groups. In order to characterize the clusters, there are computed descriptive statistics(means) for each cluster (table no. 2).
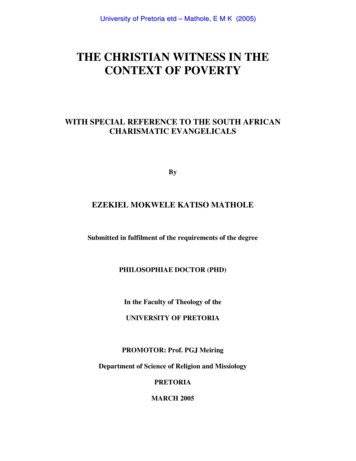
ALINA MĂRIUCA IONESCU384Table no. 2 – Descriptive statistics (means) for each of the 6 1.85P/PH832.36464.83971.00709.54397.50528.25AVER 3391392.91 3622089.00 33.6616.00 3668304.31 3793331.17 Source: Results obtained with SPSSThe highest level of poverty is registered by cluster 3, formed of Vaslui County that isextremely affected by unemployment; in 2002 unemployment rate was 15.9%. Populationsustainable access to electricity and water (essential elements for a decent life), is very low:6.8% (a great percentage comparing to other clusters) of population doesn’t have sustainableaccess to electricity and more than a half of this county population doesn’t have access tosustainable water. These facts and the very small number of physicians in this area could bethe causes for the highest infant mortality rate. The population of Vaslui County is the mostpoverty affected in almost all the dimensions of this phenomenon: the lowest grossenrolment ratio, the lowest access to health services, to water and electricity, the highestcriminality rate. The economy of Vaslui County is in crisis as it presents the lowest level ofgross investments (3 times lower than the next cluster and 11 times lower than the richestcluster). This could be a justification of the very high unemployment rate together with thehighest proportion of persons occupied in agriculture (over 56% of the total employedpopulation) and of persons living in rural areas (almost 60% of the total population).Another especially poverty affected cluster is cluster 1 (BC, MH, NT, BZ, SV, VNBT) which presents alarming values for all the variables.Cluster 5, that includes CT, HD, BV, SB, TM, CJ, presents the highest standard ofliving as it is characterized by: a very low percentage of rural population (30.7%) and ofpopulation employed in agriculture (25.44%) comparing to other clusters, the lowest povertyrate, the highest level of gross investments, the highest gross enrolment ratio, the lowestunemployment rate and infant mortality rate, the best population access to health servicesand to utilities (water and electricity). The high standard of living is also reflected by one ofthe lowest criminality rate.Another group of counties with low level of poverty is cluster 2 (AG, PH, AB, MS, DJ,IS) that presents closer values to those of cluster 5 for most of the considered variables.4 ConclusionsCluster analysis permitted to group the 41 counties of Romania in homogenous groupsconsidering the poverty dimensions such as: health, education, unemployment.According to each cluster’s profile there could be designed and developed specificpoverty alleviation programs that take into account poverty intensity in each considereddimension. Therefore, to the clusters that present deprivations in health dimension of
Poverty Mapping of Romanian Counties Using Cluster Analysis385poverty should be designed and applied appropriate programs to improve the access tohealth services. For clusters with low level of investments and high unemployment ratesthere can be allocated resources to stimulate investments so as to create new jobs and reduceunemployment. The programs that focus on infrastructure development can target thegroups of counties characterized by low sustainable access to electricity and watercorrelated with high percentage of rural population and population employed in agriculture.In conclusion, cluster analysis employed in poverty mapping may be of a real utility indesigning poverty reduction programs and policies as it permits to detect the most povertyaffected areas and the poverty’s specific in these areas and help the policy-makers to targetthe poor for the best resource allocation to alleviate poverty.BibliographyAnderberg, M. R., Cluster Analysis for applications, Academic Press, New York, 1973Davis, B., Choosing a method for poverty mapping, 2003, 20DAVIS%2013%20apr03%20sec.pdf, accessed on 3 January 2006.Everitt, B., Landau, S., Leese, M., Cluster analysis, 4th Edition, Edward Arnold PublishersLtd., London, 2001.Garson, G. D., Quantitative Research in Public Administration, PA 765 Statnotes: AnOnline Textbook, 2005, la m, accessedon 5 December 2005.Jaba, E., Statistica, Ediţia a treia, Editura Economică, Bucureşti, 2002.Kaufman, L. and Rousseeuw, P. J., Finding groups in data: An introduction to clusteranalysis, John Wiley & Sons, New York, 1990.Timm, N., Applied Multivariate Analysis, Springer Text in Statistics, 2002.*** www.caspis.ro, accessed on 10 December 2005.*** www.spss.com, accessed on 12 November 2005.*** www.undp.ro, accessed on 20 November 2005.
In this study, the method used for achieving poverty mapping is cluster analysis. It is applied in order to identify homogenous poverty clusters of counties aiming to reduce poverty by necessary resource allocation. 2 The method and the variables "Cluster analysis is the art of finding groups in data." It aims "to form groups in such a