Transcription
The Chi Square TestDiana Mindrila, Ph.D.Phoebe Balentyne, M.Ed.Based on Chapter 23 of The Basic Practice of Statistics (6th ed.)Concepts: Two-Way Tables The Problem of Multiple Comparisons Expected Counts in Two-Way Tables The Chi-Square Test Statistic Cell Counts Required for the Chi-Square Test Uses of the Chi-Square Test The Chi-Square DistributionsObjectives: Construct and interpret two-way tables. Describe the problem of multiple comparisons. Calculate expected counts in two-way tables. Describe the chi-square test statistic. Describe the cell counts required for the chi-square test. Describe uses of the chi-square test. Describe the chi-square distributions. Perform a chi-square goodness of fit test.References:Moore, D. S., Notz, W. I, & Flinger, M. A. (2013). The basic practice of statistics (6thed.). New York, NY: W. H. Freeman and Company.
ExampleQuestion: Is there an association between students’ preference for online or faceto-face instruction and their education level?Survey Items:Are you an undergraduate or graduate student?o Undergraduateo GraduateWhich method of instructional delivery do you prefer?o Face-to-faceo Online The information gathered from this survey must be organized in a data filewithin the statistical software.For each question, a categorical (or nominal) variable is created.Data File:
Cross-tabulation T tests can be used to determine whether there are significant differencesbetween undergraduate and graduate students or between face-to-face andonline instruction.However, these procedures would be conducted separately by educationlevel and then by instructional preference. This would not reveal anassociation between the two variables.Correlation analysis is typically used to measure the association betweenvariables, but correlation can only be used with quantitative variables.In order to compare categorical variables, the data can be summarized into atable, which lists the options for one variable as the rows and the options forthe other variable as the columns. This is called a crosstab because twovariables are being tabulated at the same time, and the frequency, or thepercentage of individuals in each subcategory, are being counted.Cross-tabulation of the two qualitative (nominal) variables: In this example, instructional preferences are listed as the rows andeducation levels are listed as the columns.The next step is to obtain the frequencies for each category, which can bedone using statistical software, especially for a very large sample.Although a crosstab is a helpful descriptive statistic, it is also important to beable to determine if there is an association between the two variables andwhether or not it is statistically significant.
Chi-Square Test To determine whether the association between two qualitative variables isstatistically significant, researchers must conduct a test of significance calledthe Chi-Square Test. There are five steps to conduct this test.Step 1: Formulate the hypotheses Null Hypothesis:H0: There is no significant association between students’ educational leveland their preference for online or face-to-face instruction.orH0: There is no difference in the distribution of instructional preferencesbetween undergraduate and graduate students. If there is no association between the two variables, the individuals would beuniformly distributed across the cells of the table. The alternative hypothesis for a chi-square test is always two-sided. (It istechnically multi-sided because the differences may occur in both directionsin each cell of the table). Alternative Hypothesis:Ha: There is a significant association between students’ educational level andtheir preference for online or face-to-face instruction.orHa: There is a significant difference in the distribution of instructionalpreferences between undergraduate and graduate students.
Step 2: Specify the expected values for each cell of the table (when the nullhypothesis is true) The expected values specify what the values of each cell of the table wouldbe if there was no association between the two variables.The formula for computing the expected values requires the sample size, therow totals, and the column totals.
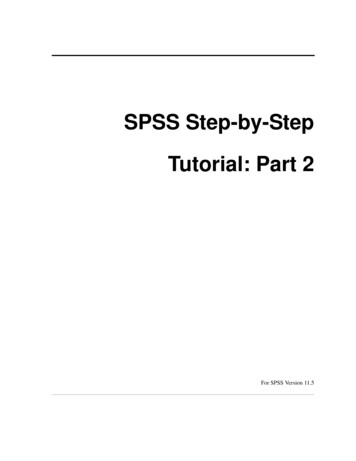
Step 3: To see if the data give convincing evidence against the null hypothesis,compare the observed counts from the sample with the expected counts, assumingH0 is true. The observed values are the actual counts computed from the sample.Statistical software will compute both the expected and observed counts foreach cell when conducting a chi-square test.The image below shows the table that SPSS creates for the two variables. Ineach cell, the expected and observed value is present.Step 4: Compute the test statistic The chi-square statistic compares the observed values to the expectedvalues.This test statistic is used to determine whether the difference between theobserved and expected values is statistically significant.
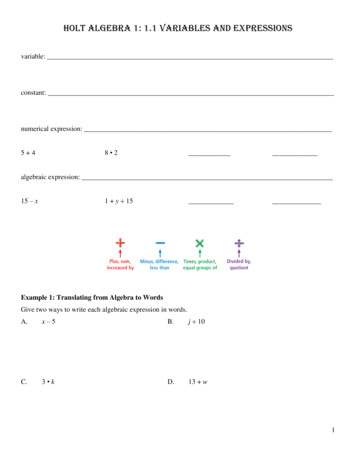
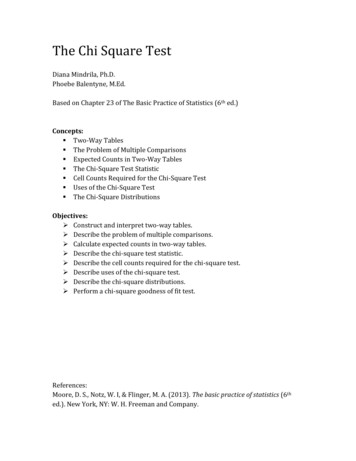
The Chi-Square DistributionsThe Chi-Square DistributionsThe chi-square distributions are a family of distributions that take only positivevalues and are skewed to the right. A particular chi-square distribution is specified bygiving its degrees of freedom.The chi-square test for a two-way table with r rows and c columns uses critical valuesfrom the chi-square distribution with (r – 1)(c – 1) degrees of freedom. The P-value isthe area under the density curve of this chi-square distribution to the right of the valueof the test statistic. The image above shows that the distribution of the chi-square statistic startsat zero and can only have positive values.The shape of the distribution is much different than the t or z statistic and isskewed to the right.The shape of the distribution changes as the degrees of freedom increases.
Chi-Square Test – Test Statistic The above example shows the observed and expected values for the exampleproblem.If these values are entered into the formula for the chi-square tests statistic,the value obtained is 28.451.Is this value high enough to reject the null hypothesis?
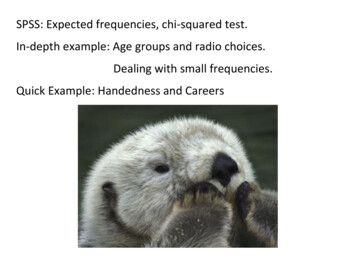
Step 5: Decide if chi-square is statistically significant The final step of the chi-square test of significance is to determine if the valueof the chi-square test statistic is large enough to reject the null hypothesis.Statistical software makes this determination much easier.For the purpose of this analysis, only the Pearson Chi-Square statistic isneeded. The p-value for the chi-square statistic is .000, which is smaller than thealpha level of .05. Therefore, there is enough evidence to reject the null hypothesis. Conclusion: Evidence from the sample shows that there is a significantdifference in the distribution of instructional preference betweenundergraduate and graduate students. A table in a statistics textbook could also be used to conduct the test by hand:The chi-square value of 28.451 is much larger than the critical value of 3.84, sothe null hypothesis can be rejected.
The Chi-Square Test InterpretationThe chi-square test is an overall test for detecting relationships between twocategorical variables. If the test is significant, it is important to look at the data tolearn the nature of the relationship. There are three ways to look at the data:1) Compare selected percents: which cells occur in very different percentagesthan the other cells?2) Compare observed and expected cell counts: which cells have more orless observations than would be expected if H0 were true?3) Look at the terms of the chi-square statistic: which cells contribute themost to the value of λ2?In the example, only 5 graduate students preferred face-to-face instruction,compared with the expected value of 18. Forty undergraduate students preferred face-to-face instruction, while theexpected value was 27. Therefore, researchers can conclude not only that there is an associationbetween the variables, but they can also describe the association. Researchers can conclude that graduate students prefer online instruction,whereas undergraduate students prefer face-to-face instruction.
Cell Counts Required for the Chi-Square Test The chi-square test is an approximate method that becomes more accurate asthe counts in the cells of the table get larger. Therefore, it is important tocheck that the counts are large enough to result in a trustworthy p-value.Fortunately, the chi-square approximation is accurate for very modestcounts.Cell Counts Required for the Chi-Square TestYou can safely use the chi-square test with critical values from the chi-squaredistribution when no more than 20% of the expected counts are less than 5 and allindividual expected counts are 1 or greater. In particular, all four expected counts in a2 2 table should be 5 or greater.
Uses of the Chi-Square Test One of the most useful properties of the chi-square test is that it tests the nullhypothesis “the row and column variables are not related to each other”whenever this hypothesis makes sense for a two-way variable.Uses of the Chi-Square TestUse the chi-square test to test the null hypothesisH0: there is no relationship between two categorical variableswhen there is a two-way table from one of these situations: Independent random samples from two or more populations, with eachindividual classified according to one categorical variable. A single random sample, with each individual classified according to both oftwo categorical variables.
The image below shows the table that SPSS creates for the two variables. In each cell, the expected and observed value is present. Step 4: Compute the test statistic The chi-square statistic compares the observed values to the expected values. This test statistic is used to determine whether the difference between the