Transcription
Implementing a Conjoint Analysis Design In QualtricsKyle A. Dropp1March 7, 2014Click here for latest version.Comments Welcome!Conjoint Analysis has been widely used in marketing research and has recently been applied to political science for choice-based research questions (e.g., Hainmueller, Hopkins and Yamamoto (2012)).Examples of its use include studying Americans’ preferences over immigrants to be admitted to theU.S. and voters selecting candidates for public office. The fully randomized, factorial design allowsresearchers to causally identify the relative importance of numerous factors, examine interactionsbetween factors, and examine interactions between factors and respondent characteristics in a costeffective, principled fashion. This document provides step-by-step instructions for implementing aconjoint analysis design on surveys. The tutorial assumes very basic knowledge of R, HTML, andJavaScript. All supporting materials are available at kyleadropp.com/conjoint.1Assistant Professor, Department of Government, Dartmouth College kyle.dropp@dartmouth.edu1
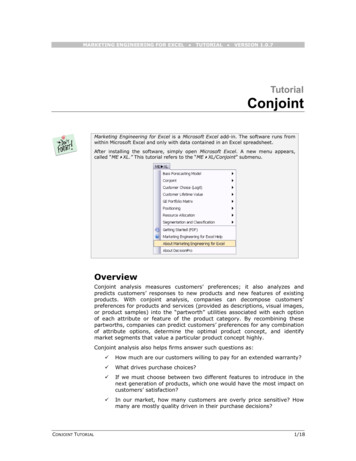
1. Qualtrics Basics1.1. Login1.2. Uploading Survey to Qualtrics1.3. Survey Outline2. Survey Programming for Conjoint Analysis2.1. Dimensions and Traits2.2. Survey Introduction2.3. Navigating to Module 12.4. Creating HTML Table2.5. Defining Dimensions and Randomizing Dimension Order2.6. Defining Traits2.7. Randomly Selecting Traits for Each Dimension2.8. Assigning Traits to Candidates2.9. Assigning JavaScript values to HTML table2.10. The Main Dependent Variable2.11. Post-Test Dependent Variables2.12. Outputing Randomizations to a .csv2.13. Adding Modules to the Conjoint Analysis3. Downloading and Analyzing the Data file with R4. Modeling and Plots3333444455666778891010Contents2Materials: kyleadropp.com/conjoint
1. Qualtrics Basics1.1. Login. Login to your Qualtrics account (e.g., http://stanforduniversity.qualtrics.com/for Stanford University), princeton.qualtrics.com for Princeton University, or tuck.qualtrics.com/ for Dartmouth College. See your department or university administrator if you cannot accessQualtrics.1.2. Uploading Survey to Qualtrics. The conjoint analysis survey is pre-programmed for thistutorial, s you can simply upload it to Qualtrics. On the ‘Edit Survey’ tab, select ‘Advanced Options’ on the far right, then select ‘Import Survey,’ and browse to the file ‘congoing analysis tutorial.qsf’online in the supporting materials folder.1.3. Survey Outline. This is a fully functional conjoint analysis design aimed at understandingthe relative weight Americans place on various candidate dimensions such as gender, policy positions, newspaper endorsements, and occupations. Scroll through the survey and familiarize yourselfwith the content.3Materials: kyleadropp.com/conjoint
The survey contains 10 blocks: 1) a welcome with informed consent (‘Welcome’), 2) introduction tothe conjoint analysis exercise (‘Block 11’), 3) conjoint module #1 (‘Conjoint Block 1’), 4) conjointmodule #2 (‘Conjoint Block 2’), 5) conjoint module #3 (‘Conjoint Block 3’), 6) conjoint module #4(‘Conjoint Block 4’), 7) conjoint module #5 (‘Conjoint Block 5’), 8) policy item battery (‘Policy’),9) newspaper readership questions (‘DC newspapers’), and 10) background characteristics such asage, race, party affiliation, and educational attainment (‘Democgraphics’).2. Survey Programming for Conjoint AnalysisThis section describes the coding for all survey components in the conjoint analysis. These includecreating an HTML table, defining the dimensions, randomizing the dimensions, creating arrayscontaining traits, randomizing traits, populating the HTML table with the traits and dimensions,and saving the data to a .csv file.2.1. Dimensions and Traits. From now on, we will describe dimensions as the key attributes weare varying (e.g., gender, endorsement) and traits as the particular values for a given dimension(e.g., male, female, Washington Post)The dimensions and traits are hard-coded in the HTML / JavaScript below. This facilitates sharingthe code and avoids dealing with server permissions. The code contains extensive comments, andall code in this section and foregoing sections can be found at kyleadropp.com/conjoint.2.2. Survey Introduction. Head to Q5 in Block 11. This is the description of the exercise.2.3. Navigating to Module 1. Navigate to Q6, the first question in the ‘Conjoint Boxes 1’module, click on the content in the question, and then select ‘HTML’ view. Your screen should looklike the figure below. You also can download the HTML code at kyleadropp.com/conjoint.4Materials: kyleadropp.com/conjoint
2.4. Creating HTML Table. The HTML code contains JavaScript and performs a number offunctions. Lines 1 through 48 create an HTML table with columns for the dimensions, Candidate1 traits, and Candidate 2 traits, respectively. The ‘id’ markers in the table serve as placeholdersfor the randomized dimension and trait content. The current table has room for six dimensions,but it is trivial to increase or decrease the number of dimensions to suit your research question,as shown in lines 1 through 48 below. See the Appendix for a discussion of adding or deletingdimensions.2.5. Defining Dimensions and Randomizing Dimension Order. Lines 49 through 63 define the dimensions (Race / Ethnicity, Newspaper Endorsements, Party Identification, Occupation,Position on Assault Weapons Ban, Position on Abortion) and then randomize the order of thedimensions. In the HTML code, we will refer to these dimensions as ‘race,’ ‘endorse,’ ‘pid,’ ‘occupation,’ ‘weapons,’ and ‘abortion,’ respectively.5Materials: kyleadropp.com/conjoint
2.6. Defining Traits. Lines 64 through 76 create the traits associated with each dimension. Thedimension traits are typically fully randomized. However, one can constrain the randomization sothat both candidates do not have an identical value. For example, in the newspaper endorsementexperiment, both candidates cannot receive an endorsement from the same newspaper.2.7. Randomly Selecting Traits for Each Dimension. Lines 78-91 uses the ‘Math.random()’command to randomly select traits for each dimension for both candidates.2.8. Assigning Traits to Candidates. Lines 93-122 create empty arrays for each candidate’straits and then assigns each trait in the proper order, based on the randomization of the dimensions.6Materials: kyleadropp.com/conjoint
2.9. Assigning JavaScript values to HTML table. Lines 123-140, the last chunk in this module, create a list of variables corresponding to the placeholders in the initial HTML table. Thereare lists of placeholders for the dimensions, for Candidate 1’s traits, and for Candidate 2’s traits.Then, the code include a for loop to assign the values in the JavaScript variables to the HTMLtable.2.10. The Main Dependent Variable. The HTML in the previous section produces the tablebelow. Column 1 displays the dimensions, Column 2 displays traits for Candidate 1 and Column 3displays traits for Candidate 3. The traits have been randomized for each candidate.22Newspaper Endorsements cannot be duplicated.7Materials: kyleadropp.com/conjoint
2.11. Post-Test Dependent Variables. Follow up questions on the same survey block ask respondents to rate how often they would support each candidate, to evaluate the qualifications ofeach candidate, and to evaluate the ideology of each candidate. These questions are designed to examine whether a newspaper endorsements influences candidate support because it affects perceivedqualifications or because it affects perceived ideology of the candidate.2.12. Outputing Randomizations to a .csv. Scroll down to Q12. This is a “Text Entry-Form”Question that will output the list of traits and the dimension order to a .csv file. Note that thisquestion has a bunch of open-ended response forms. Each of the dimensions and traits will beassigned to one of these forms, but respondents will not see this question.Click the content of Q12 and then select ‘HTML View.” You will see a few lines of CSS designedto hide this question from the respondent.The ‘QID122’ portion does not always correspond with the question identifier next to it. You canselect ‘Piped Text,’ then ‘Q12,’ then ‘All Choices - Entered Text’ to identify the correct QID thatshould be used to hide this question from respondents.Click on the orange ‘JS’ button on the left hand column of Q12. This is a list of variables fromthe HTML code in previous steps. It saves each variable to an appropriate form number, and thenthese variables are exported to a .csv file. Note: if you add or subtract dimensions, you must addcells to this form.8Materials: kyleadropp.com/conjoint
You have now completed programming module 1. It is simple to add extra modules to the survey.2.13. Adding Modules to the Conjoint Analysis. A principal benefit of using conjoint analysisis that respondents can answer multiple modules. This increases statistical power and enablesa within- and between-subjects analysis. We make a few key assumptions such as preferencestability, profile randomization, and no ordering effects, each of which can be examined empiricallyin diagnostic tests. This section details the process for adding extra modules to the survey.Navigate to Q13 in the block called ‘Conjoint Block 2.” Click on the content and select ‘HTMLView,’ or download the HTML code for module 2 at kyleadropp.com/conjoint.There are two very minor changes you must make to the HTML file from module 1. First, in Lines1 through 10, change ‘Scenario 1’ to ‘Scenario 2’ and changes the names of the candidates from 1and 2 to 3 and 4, respectively.Second, in lines 47-49, rather than defining the dimensions, you will use the same randomizeddimension order from Module 1. The embedded data variable in line 48 takes the list of dimensionsfrom open text item Q12 (identifier Q122) and line 48 splits this comma delimited list.Next, for questions Q14, Q15, Q16, and Q17, change the candidate names from ‘Candidate 1’ and‘Candidate 2’ to ‘Candidate 3’ and ‘Candidate 4,’ respectively.Continue to add modules until you have enough for your research question. You typically can click‘Block Options’ and then ‘Copy Block’ to create a module retaining the essential features of earliermodules.9Materials: kyleadropp.com/conjoint
3. Downloading and Analyzing the Data file with RNote: this section requires some familiarity with R. This section provides details for accessing anddownloading the .csv file containing results from the survey. I have uploaded a .csv file containingdata from a newspaper endorsements experiment conjoint analysis, along with the codebook, tothe supporting materials folder online ( kyleadropp.com/conjoint).Please open the file ‘read clean data.R’. In this conjoint analysis design, we assigned newspaperendorsements to individuals based on their ZIP Code. If there was no major newspaper in theirzip code, they were excluded from the study. The script file reads and processes the data, runs afew models, and then creates plots. It is heavily commented and you should be able to run it inone click from the command line.The code performs the following tasks (in order): clear workspace, load R libraries, import .csv filefrom survey data, omit rows with NAs, recode variables for weighting and append post-stratificationweights to the data frame.Respondents in this study viewed three modules, for a total of six candidates. We will createsix rows for each respondent, with each row containing the full list of a particular candidate’sattributes, whether the respondent selected that candidate, and the perceived support, qualifications, and ideology for that candidate. Then, we include columns with newspaper perceptions,policy questions, and demographic items. In our study, we were interested in understanding howthe ideological congruence between a respondent and a newspaper influences the overall effect ofa newspaper. Therefore, the next section of this R file constructs a number of distance measuresusing self-reported respondent ideology, self-reported ideology of newspapers, self-reported policypositions, and newspaper slant scores. Finally, we include variables for the respondent id and thevignette id to include in our models.4. Modeling and PlotsWe have now processed the raw data from the conjoint analysis experiment. We will now regresscandidate selection (dichotomous), candidate support (continuous), candidate qualifications, andcandidate ideology on the five dimensions varied in the conjoint analysis. The models are administered separately with survey weights (and without survey weights), control for respondentage, educational attainment, gender, ethnicity, and region, and include fixed effects by designatedmarket area and the module number.Here is a figure displaying main effects10Materials: kyleadropp.com/conjoint
Effects of Candidate Attributes on Candidate SupportAmong Those Who Read Paper Weekly Endorsement:None Newspaper Party:Democrat Republican Independent Issue positions:Pro life Favor Assault Weapon Ban Occupation:Business Owner Car Dealer Carpenter Doctor High School Teacher Lawyer Member of Congress Military Veteran 0.10.00.1Change in Candidate Support11Materials: kyleadropp.com/conjoint
Here is a table displaying the main and interaction effects (below).Table 1. The Relationship between Individuals’ Ideological Congruence and theImpact of a Newspaper Endorsement - Results from Full DatasetAllRead Local PaperRead any PaperVoters Weeklyin Past 24 Hrs.DV 1 if Selected Candidate, 0 if Did Not Select Candidate(1)(2)(3)(4)(5)(6)Endorsement0.022 * 0.071 * 0.034 * 0.078 * 0.036 *0.077 *(0.009) (0.013) (0.011) (0.017) (0.011)(0.017)0.0530.048Absolute Ideological Distance0.055 *(0.019)(0.028)(0.026)Endorsement X-0.157 *-0.143 *-0.132 *Absolute Ideological 815528R20.0100.0120.0110.0130.0130.014Resid. sd0.5020.5020.5050.5040.5040.504Models control for age, gender, education, and race. They include fixed effects for the binary comparisonorder and at the Metropolitan Statistical Area (MSA) level.Standard errors in parentheses indicates significance at p 0.05, indicates significance at p 0.1012Materials: kyleadropp.com/conjoint
for Stanford University), princeton.qualtrics.com for Princeton University, or tuck.qualtrics. com/ for Dartmouth College. See your department or university administrator if you cannot access Qualtrics. 1.2. Uploading Survey to Qualtrics. The conjoint analysis survey is pre-programmed for this tutorial, s you can simply upload it to Qualtrics.