Transcription
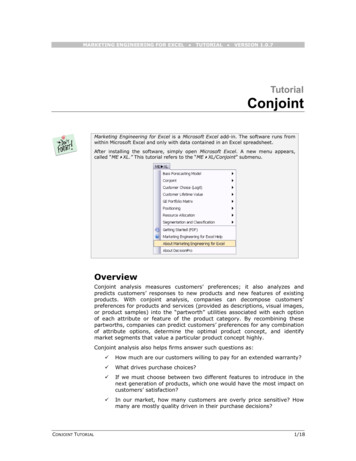
MARKETING ENGINEERING FOR EXCEL TUTORIAL VERSION 1.0.7TutorialConjointMarketing Engineering for Excel is a Microsoft Excel add-in. The software runs fromwithin Microsoft Excel and only with data contained in an Excel spreadsheet.After installing the software, simply open Microsoft Excel. A new menu appears,called “ME XL.” This tutorial refers to the “ME XL/Conjoint” submenu.OverviewConjoint analysis measures customers’ preferences; it also analyzes andpredicts customers’ responses to new products and new features of existingproducts. With conjoint analysis, companies can decompose customers’preferences for products and services (provided as descriptions, visual images,or product samples) into the “partworth” utilities associated with each optionof each attribute or feature of the product category. By recombining thesepartworths, companies can predict customers’ preferences for any combinationof attribute options, determine the optimal product concept, and identifymarket segments that value a particular product concept highly.Conjoint analysis also helps firms answer such questions as:CONJOINT TUTORIAL How much are our customers willing to pay for an extended warranty? What drives purchase choices? If we must choose between two different features to introduce in thenext generation of products, which one would have the most impact oncustomers’ satisfaction? In our market, how many customers are overly price sensitive? Howmany are mostly quality driven in their purchase decisions?1/18
Getting StartedMany Marketing Engineering for Excel models allow you to use the interactiveassistant, which prompts you for the parameters required by the model andbuilds a template spreadsheet into which you can to enter the required data.This generated template includes pre-selected cell ranges that correspond tothe parameters you enter. These recommended Marketing Engineering forExcel templates facilitate subsequent analyses.Expert users who are familiar with Marketing Engineering for Excel models anddata requirements may prefer to input data directly in an unformattedspreadsheet. Such users should begin with the interactive assistant to becomefamiliar with the data format that Marketing Engineering for Excel expects.The next section explains how to create an easy-to-use template to collect and enteryour own data.If you want to run a conjoint analysis immediately, open the example file “OfficeStarData (Conjoint, Part 1).xls” and jump to “Step 4: Estimating Preference Part Worths”(p.8). By default, the example files install in “My Documents/My MarketingEngineering/.”If you want to see conjoint analysis in action, open the example file “OfficeStar Data(Conjoint, Part 2) and jump to “Step 7: Running analyses” (p. 14). You should notchange the analysis parameters manually (they were established in Step 5) but youwill see how a conjoint process works.Step 1Creating a study design templateA conjoint study involves a complex, multi-step analysis. The first steprequires designing the study itself: By which features and characteristics arethe products under study described?In Excel, if you click on ME XL CONJOINT CREATE STUDY DESIGN TEMPLATE, adialog box appears. The first dialog box prompts you to use an interactiveassistant.Unless you are already familiar with the methodology, you should select “yes.”CONJOINT TUTORIAL2/18
Using the interactive assistantThe first step of the study design template generation process requires you tolabel and list the attributes you want to use.An attribute is a general category that you can use to build and describealternative products or services, such as ”color,” “price,” or “quality.” Theattributes listed in the dialog box below come from the OfficeStar example.After you have described the attributes, you must enter levels for each in thenext step. An attribute is a general category description, such as color, price,or warranty, whereas the levels are the particular values that an attribute cantake, such as red, 20, or 1-year warranty.Each attribute requires at least two levels.CONJOINT TUTORIAL3/18
After entering the attributes and levels for each attribute, you will be promptedwith the following dialog box:If you click “no”, a generated conjoint study design immediately appears in anew Excel workbook, as shown below. Clicking “yes” is equivalent to selectingME XL CONJOINT CREATE DATA COLLECTION TEMPLATE in the Excel menu.Not using the interactive assistantIf you decide not to use the interactive assistant, the following dialog box willappear, asking you to specify the:CONJOINT TUTORIAL Number of attributes. The OfficeStar example uses four attributes todescribe a store: location, assortment of office supplies, whether it sellsfurniture, and whether it offers computer supplies and software packages. Maximum number of levels. The OfficeStar example uses two to threelevels per attribute, so the maximum number of levels is 3.4/18
Click OK to generate a new blank spreadsheet. You must enter all attributesand levels manually in the spreadsheet.Step 2Creating a data collection templateThe first step, generating the study design, is necessary to describe theattributes and levels used in your conjoint study. After you have developedthis basic study structure, you must generate a template to collect or entercustomer data. These data will elicit customers’ preferences for the differentattribute levels and thus clarify the kind of trade-offs consumers are willing tomake.To create a data collection template, select ME XL CONJOINT CREATE DATACOLLECTION TEMPLATE in the Excel menu. Alternatively, after creating the studydesign template using the interactive assistant, you may simply confirm thatyou want the data collection template generated immediately.The following dialog box appears:CONJOINT TUTORIAL5/18
Many techniques can elicit customers’ preferences, including choice-basedconjoint, partial profile ratings, full profile ratings, and adaptive conjoint.Marketing Engineering for Excel offers two methods to elicit customers’preferences: Self-explicated is the most straightforward. Respondents distribute 100points among the different attributes (more points represent moreimportant attributes in the choice process) and rank the different levels foreach attribute in their order of preference. For example, a respondentmight allocate 8 points out of 100 to the attribute “color” (color is not avery important factor in his or her choice), and then assign ranks of 1 tothe color “blue” and 2 to the color “red” (prefers blue to red). Ratings require a more involved and complex but usually more reliablemethod to elicit respondents’ preferences. The ratings method creates alist of hypothetical products (or bundles of attributes) and asksrespondents to assign a score (say, between 0 and 100) to each bundle,such that more points represent higher preferences. Marketing Engineeringfor Excel can infer from these ratings which attributes (and levels) driveconsumer preferences, and hence their choices.The dialog box also asks you to specify the number of respondents forwhom you want to create a data collection template.When you click Next, the software will ask you to select the range of cells forthe study design.If you have selected Ratings, the software automatically generates a list ofbundles for your respondents to rate. The exact number of bundles dependson the complexity of your study design. The more attributes and levels youCONJOINT TUTORIAL6/18
have, the more bundles your respondents will need to rate to provide anestimate of their preferences.If you select Self-explicated, the software generates the template below, inwhich the first columns refer to ranking of the levels and the last columnsindicate the distribution of points to the different attributes.CONJOINT TUTORIAL7/18
Step 3Entering your dataIn this tutorial, we use the example file “OfficeStar (Conjoint Data, Part 1).xls,”which uses the ratings method. In the default condition, that file appears in “MyDocuments/My Marketing Engineering/.”To view a proper data format, open that spreadsheet in Excel. A snapshot isreproduced below.Step 4Estimating preference partworthsWhen you have entered your respondents’ answers (ratings or self-explicateddata), you must proceed to the next step of conjoint analysis: estimating yourrespondents’ preferences for each attribute and level, or preferencepartworths.To estimate preference partworths from a set of ratings (note that the samelogic applies to self-explicated data), select ME XL CONJOINT ESTIMATEPREFERENCE PARTWORTHS in the Excel menu. The following dialog box appears:CONJOINT TUTORIAL8/18
You must specify (1) what type of method (self-explicated or ratings) you usedto collect data and (2) whether your data contain identifiers for eachrespondent that need to be carried into the next steps of the analysis.If you used Marketing Engineering for Excel to generate the data collectiontemplate, these options already will be populated with the correct choices, andyou should not change them.You then must select various cell ranges in the Excel workbook, namely:CONJOINT TUTORIAL Study design template (attributes and levels). Bundles used to collect data. Ratings entered by your respondents.9/18
The newly generated spreadsheet contains respondents’ estimated preferencepartworths.To interpret the results, note that As a convention, the least preferred level of each attribute gets set to 0 forall respondents. As another convention, if you take the most preferred levels of allattributes and sum them, the total will equal 100. This rule ensures theconsistency of respondents’ scales. The importance of an attribute equals the value of the most preferred levelfor that attribute. The first respondent in the OfficeStar example considersa store within two miles worth 25 points and a store that offers a verylarge assortment of office supplies worth 50 points. Therefore, for thisrespondent, office supply assortment is twice as important as storelocation.A very important application of conjoint analysis segments customers’ needs andpreferences. You can use estimated preference partworths to identify segments ofcustomers who share similar likes and dislikes and value certain attributes toapproximately the same extent.To run a segmentation analysis, refer to the segmentation/targeting software of theMarketing Engineering for Excel suite and apply the segmentation software torespondents’ preference partworths.CONJOINT TUTORIAL10/18
Step 5Creating analysis templateIf you want to skip this section and run a conjoint analysis immediately, open“OfficeStar (Conjoint Data, Part 2).xls”. In the default condition, that file appears in“My Documents/My Marketing Engineering/.”This file contains respondents’ preference partworths, as well as an analysis templatealready filled in.Respondents’ preference partworths can be interesting to analyze in and ofthemselves: What are the most important attributes (or features), what arethe most preferred levels (or options), and so forth?To exploit the potential of conjoint analysis fully for applications such asmarket simulations, new product design optimization, or full-blown trade-offanalyses, you need to create a template in which you specify the type ofanalysis you plan to run, as well as the data needed to run it.Select ME XL CONJOINT CREATE ANALYSIS TEMPLATE in the Excel menu. Thefollowing dialog box appears:CONJOINT TUTORIAL Existing Product Profiles (or existing bundles). Some options currentlyexist in the market, such as products or services offered by competitors oryour company. You must describe these existing products if you plan tostudy the market potential of new offerings, which are gauged in referenceto what already exists in the market, or analyze cannibalization effects. With Market Share Information. If you know the current marketshares of existing products, you can infer a more precise relationshipbetween preferences (preference partworths) and choices (market shares),which enhances the predictive value of your simulations. Of course, youmust also know exactly what alternatives already exist. New Product Profiles (or new bundles). Check this option if you have apredefined list of potential candidate products that you contemplate11/18
introducing in the market. If you do not, the software will test all possiblecombinations and identify those with the highest market share potentials. Incremental Revenue Potentials. Conjoint simulations find the productsthat optimize potential market shares. However, because of costconsiderations, the customer’s “ideal” bundle is not always the choice thatresults in the highest profits for the firm. Therefore, check this option onlyif you can allocate a specific price (or revenue potential) to each level,which will enable you to run simulations based on revenue rather thanmarket share optimization. Respondents’ Weights. Some categories of customers might beoverrepresented in your sample. Check this option if you have enoughdata to correct for these biases by weighting some respondents moreheavily. For instance, if 50% of the market consists of men but yoursample is only 33% men, you can give a weight of 2.0 to all the men and adefault weight of 1.0 to all women. That is, men in the sample count twiceas much as women in the simulation, which better balances the sample. Ifin doubt, do not check this option; the software then gives a weight of 1.0to all respondents in your sample.Click Next, then select the various cell ranges in the Excel workbook.If you checked the “Existing Product Profiles” option, you now need to createthose profiles using the following dialog box. If you checked the “New ProductProfiles” option, the same procedure will apply subsequently.CONJOINT TUTORIAL12/18
These steps lead to the generation of a workbook similar to the following (inthis example, only the “Existing Product Profiles” and “Incremental RevenuePotentials” were checked):CONJOINT TUTORIAL13/18
Step 6Entering analysis dataSome cells in the data analysis template need to be filled in before proceeding,including: Market Share Information about existing product profiles. Incremental Revenue Potentials of all levels. Respondents’ Weights.In the preceding example, moving the store 5–10 miles away would increaserevenues by 30% (compared with a base level of a store within 2 miles,perhaps due to higher rent costs); offering software and computers in theCONJOINT TUTORIAL14/18
store would decrease revenues by –25% (due to higher operational costs,maintenance, and stock obsolescence). Although customers clearly prefer acloser store to a distant one, conjoint analysis indicates—on the basis of apreference analysis, market share simulations, and revenue potential—whether building a new store within two miles is worth the extra cost.Step 7Running analysesAfter you enter your data in the Excel spreadsheet using the appropriateformat, click on ME XL CONJOINT RUN ANALYSIS. The dialog box thatappears indicates the next steps required to perform a conjoint analysis ofyour data.Existing product profilesIn this area, specify whether you want to perform market share simulations: On existing product profiles only, which simply simulates the actualmarket. With new product profiles you have defined by taking into accountexisting product profiles and simulating the introduction of your manuallyspecified new product profiles. With optimal product profiles, which tests all possible combinationsof new product introductions and keeps those that lead to the highestmarket shares (or revenues, if you have checked that option), after takinginto account existing product profiles in the current market and thusidentifying new opportunities, or “holes,” in the market.OptionsThese options reflect and confirm the choices you made when you created thedata analysis template. Please refer to the previous section for explanations.Choice ruleYou can use several methods to translate preferences into choices, dependingon the product category and information available.CONJOINT TUTORIAL15/18
Maximum utility rule: Each respondent selects the product that providesthe highest utility among competing products and a specific new productconcept being evaluated. If customers buy products in the productcategory infrequently and/or are highly involved in the purchase decision(e.g., house, car, expensive computer), the maximum utility rule ispreferable. Share of utility rule: Each respondent’s share of purchases of aparticular product is a function of his or her utility for that product,compared with the total utility for all products in the competitive set. Thisanalysis option is most suitable for products that customers buy frequentlyand/or for which they are less involved in the purchase decision (e.g., ameal). Logit choice rule: The share of each product for each respondent is afunction of the weighted utility for that product, compared with the totalweighed utility for all products in the competitive set. The weighting usesan exponential function. This analysis option provides an alternative to theshare of utility model. Alpha rule: A weighted combination of the maximum utility rule and theshare of utility rule, this method chooses a weight (alpha) that ensures themarket shares computed in the simulation are as close as possible to theactual market shares of the existing products in the market. This option isavailable only if you can to provide information about the market shares ofexisting products in the segment to which you are targeting the newproduct.Next stepsWhen you click Next, you are prompted to select data ranges to run theconjoint analysis. If you followed the previous steps, all your data should becontained in the last workbook generated by Marketing Engineering for Excel,and all cell ranges should be properly pre-selected, depending on the optionsyou selected.The new generated workbook offers the results of your conjoint analysis.Step 8Interpreting the resultsFor illustration, the following workbook was generated using the followingoptions: Five optimal product profiles. No revenue potentials. Logit choice rule.Main resultsThe first sheet of the newly generated workbook reports the results of theconjoint analysis, including the market share simulations:CONJOINT TUTORIAL With the existing product profiles only. By simulating the introduction of the generated new product profiles,one at a time (optional). By simulating the introduction of as many optimal product profiles asrequested, one at a time, beginning with the one that leads to the highestmarket shares or revenues (optional).16/18
In the following chart, notwithstanding new product introductions, conjointanalysis predicts that Office Equipment captures 68% of the market (accordingto the logit rule).The introduction of a new, optimal product (see the description of “OptimalProduct 1” in the first sheet) could capture 63% of the market, and OfficeEquipment’s market shares would drop from 68% to 25%.CONJOINT TUTORIAL17/18
CONJOINT TUTORIAL18/18
(Conjoint, Part 2) and jump to “Step 7: Running analyses” (p. 14). You should not change the analysis parameters manually (they were established in Step 5) but you will see how a conjoint process works. Step 1 Creating a study design template A conjoint study


![Unreal Engine 4 Tutorial Blueprint Tutorial [1] Basic .](/img/5/ue4-blueprints-tutorial-2018.jpg)
