Transcription
“Conjoint Survey Experiments”For Druckman, James N., and Donald P. Green, eds.Cambridge Handbook of Advances in ExperimentalPolitical Science, New York: Cambridge University Press.Kirk Bansak Jens Hainmueller†Daniel J. Hopkins‡Teppei Yamamoto§September 23, 2019AbstractConjoint survey experiments have become a popular method for analyzing multidimensional preferences in political science. If properly implemented, conjoint experiments canobtain reliable measures of multidimensional preferences and estimate causal effects of multiple attributes on hypothetical choices or evaluations. This chapter provides an accessibleoverview of the methodology for designing, implementing, and analyzing conjoint survey experiments. Specifically, we begin by detailing a new substantive example: how do candidateattributes affect the support of American respondents for candidates running against President Trump in 2020? We then discuss the theoretical underpinnings and key advantagesof conjoint designs. We next provide guidelines for practitioners in designing and analyzing conjoint survey experiments. We conclude by discussing further design considerations,common conjoint applications, common criticisms, and possible future directions. Assistant Professor, Department of Political Science, University of California San Diego, 9500 Gilman Drive,La Jolla, CA 92093, United States. E-mail: kbansak@gmail.com†Professor, Department of Political Science, 616 Serra Street Encina Hall West, Room 100, Stanford, CA 943056044. E-mail: jhain@stanford.edu‡Professor, Department of Political Science, University of Pennsylvania, Perelman Center for Political Scienceand Economics, 133 S. 36th Street, Philadelphia PA, 19104. E-mail: danhop@sas.upenn.edu§Associate Professor, Department of Political Science, Massachusetts Institute of Technology, 77 MassachusettsAvenue, Cambridge, MA 02139. Email: teppei@mit.edu, URL: http://web.mit.edu/teppei/www
IntroductionPolitical and social scientists are frequently interested in how people choose between options thatvary in multiple ways. For example, a voter who prefers candidates to be experienced and opposedto immigration may face a dilemma if an election pits a highly experienced immigration supporteragainst a less experienced immigration opponent. One might ask similar questions about a widerange of substantive domains—for instance, how people choose whether and whom to date, whichjob to take, and where to rent or buy a home. In all these examples, and in many more, peoplemust choose among multiple options which are themselves collections of attributes. In makingsuch choices, people must not only identify their preferences on each particular dimension, butalso make trade-offs across the dimensions.Conjoint analysis is a survey-experimental technique that is widely used as a tool to answerthese types of questions across the social sciences. The term originates in the study of “conjointmeasurement” in 1960s mathematical psychology, when founding figures in the behavioral sciencessuch as R. Duncan Luce (Luce and Tukey, 1964) and Amos Tversky developed axiomatic theoriesof decomposing “complex phenomena into sets of basic factors according to specifiable rules ofcombination” (Tversky, 1967). Since the seminal publication of Green and Rao (1971), however,the term “conjoint analysis” has primarily been used to refer to a class of survey-experimentalmethods that estimate respondents’ preferences given their overall evaluations of alternative profiles that vary across multiple attributes, typically presented in tabular form.Traditional conjoint methods drew heavily on the statistical literature on the design of experiments (DOE) (e.g. Cox, 1958), in which theories of complex factorial designs were developed forindustrial and agricultural applications. However, conjoint designs became especially popular inmarketing (see Raghavarao, Wiley and Chitturi, 2011), as it was far easier to have prospectivecustomers evaluate hypothetical products on paper than to build various protoypes of cars orhotels. Conjoint designs were also frequently employed in economics (Adamowicz et al., 1998) andsociology (Jasso and Rossi, 1977; Wallander, 2009), often under different names such as “statedchoice methods” or “factorial surveys.” In the era before computer-assisted survey administration,respondents would commonly have to evaluate dozens of hypothetical profiles printed on paper,and even then, analysis proceeded under strict assumptions about the permissible interactionsamong the attributes.1
Only in recent years, though, have conjoint survey experiments come to see extensive use in political science (e.g. Loewen, Rubenson and Spirling, 2012; Franchino and Zucchini, 2014; Abrajano,Elmendorf and Quinn, 2015; Carnes and Lupu, 2015; Hainmueller and Hopkins, 2015; Horiuchi,Smith and Yamamoto, 2018; Bansak, Hainmueller and Hangartner, 2016; Bechtel, Genovese andScheve, 2016; Mummolo and Nall, 2016; Wright, Levy and Citrin, 2016). This development hasbeen driven partly by the proliferation of computer-administered surveys and the concurrent ability to conduct fully randomized conjoint experiments at low cost. Reflecting the explosion ofconjoint applications in academic political science publications, a conjoint analysis of Democraticvoters’ preferences for presidential candidates even made an appearance on television via CBSNews in the spring of 2019 (Khanna, 2019). A distinctive feature of this strand of empirical literature is a new statistical approach to conjoint data based on the potential outcomes frameworkof causal inference (Hainmueller, Hopkins and Yamamoto, 2014), which is in line with the similarexplosion in experimental methods in political science generally since the early 2000s (Druckmanet al., 2011). Along with this development, the past several years have also seen valuable advancements in the statistical methods for analyzing conjoint data that similarly builds on moderncausal inference frameworks (Dafoe, Zhang and Caughey, 2018; Acharya, Blackwell and Sen, 2018;Egami and Imai, 2019).In this chapter, we aim to introduce conjoint survey experiments, to summarize recent researchemploying them and improving their use, and to discuss key issues that emerge when putting themto use. We do so partly through the presentation and discussion of an original conjoint application,in which we examine an opt-in sample of Americans’ attitudes toward prospective 2020 Democraticpresidential nominees.An Empirical Example: Candidates Running against President Trump in 2020To illustrate how one might implement and analyze a conjoint survey experiment, we conducted anoriginal survey on an online, opt-in sample of 503 Amazon Mechanical Turk workers. We designedour experiment to be illustrative of a typical conjoint design in political science. Specifically,we presented respondents a series of tables showing profiles of hypothetical Democratic candi2
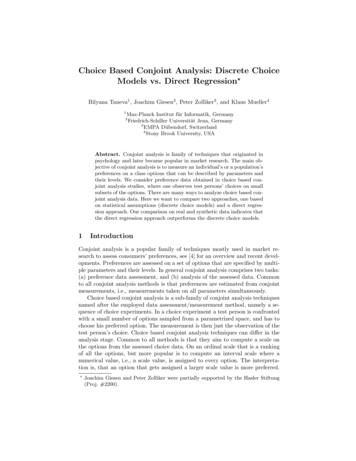
Figure 1: An Example Conjoint Table from the Democratic Primary Experiment. The full set ofpossible attribute values are provided in Table 1.dates running in the 2020 U.S. presidential election. We asked: “This study is about voting andabout your views on potential Democratic candidates for President in the upcoming 2020 generalelection.please indicate which of the candidates you would prefer to win the Democraticprimary and hence run against President Trump in the general election” (emphasis in theoriginal). We then presented a table that contained information about two political candidatesside by side, described as “CANDIDATE A” and “CANDIDATE B,” which were purported torepresent hypothetical Democratic candidates for the 2020 election. Figure 1 shows an exampletable from the experiment.As shown in Figure 1, conjoint survey experiments typically employ a tabular presentation ofmultiple pieces of information representing various attributes of hypothetical objects. This tableis typically referred to as a “conjoint table” since it combines a multitude of varying attributesand presents them as a single object. In our experiment, we used a table containing two profiles3
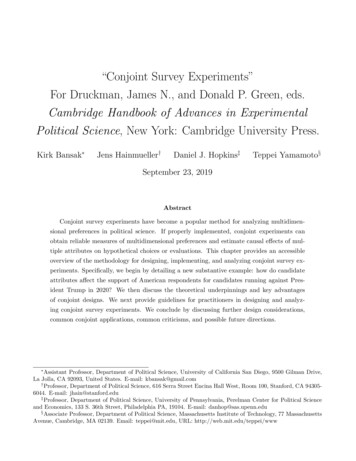
AgeGenderSexual OrientationRace/EthnicityPrevious OccupationMilitary Service ExperiencePrior Political ExperienceSupports Government Healthcare forSupports Creating Pathway to Citizenship forPosition on Climate Change37, 45, 53, 61, 77Female, MaleStraight, GayWhite, Hispanic/Latino, Black, AsianBusiness executive, College professor, High school teacher, Lawyer, Doctor, ActivistDid not serve, Served in the Army, Served in the Navy, Served in the Marine CorpsSmall-city Mayor, Big-city Mayor, State Legislator, Governor, U.S. Senator,U.S. Representative, No prior political experienceAll Americans, Only Americans who are older, poor, or disabled,Americans who choose it over private health plansUnauthorized immigrants with no criminal record who entered the U.S. as minors,All unauthorized immigrants with no criminal record, No unauthorized immigrantsBan the use of fossil fuels after 2040, reducing economic growth by 5%;Impose a tax on using fossil fuels, reducing economic growth by 3%;Promote the use of renewable energy but allow continued use of fossil fuelsTable 1: The List of Possible Attribute Values in the Democratic Primary Experiment.of hypothetical Democratic candidates varying in terms of their age, gender, sexual orientation,race/ethnicity, previous occupation, military service, and positions on healthcare policy, immigration policy, and climate change policy. Table 1 shows the full set of possible levels for each ofthe attributes. The levels presented in each table were then randomly varied, with randomizationoccurring independently across respondents, across tables, and across attributes. Each respondentwas presented 15 such randomly generated comparison tables on separate screens, meaning thatthey evaluated a total of 30 hypothetical candidates. In order to preserve a smooth survey-takingexperience, the order in which attributes were presented was held fixed across all 15 tables foreach individual respondent, though the order was randomized across respondents.After presenting each of the conjoint tables with randomized attributes, we asked respondentstwo questions to measure their preferences about the hypothetical candidate profiles just presented.Specifically, we used a 7-point rating of the profiles (top of Figure 2) and a forced choice betweenthe two profiles (bottom of Figure 2). We asked: “On a scale from 1 to 7, ., how would you rateeach of the candidates described above?” and also “Which candidate profile would you prefer forthe Democratic candidate to run against President Trump in the general election?” The order ofthese two items was randomized (at the respondent level) so that we would be able to identifyany order effects on outcome measurement if necessary.The substantive goal of our conjoint survey experiment was twofold and can be capturedby the following questions. First, what attributes causally increase or decrease the appeal ofa Democratic primary candidate on average when varied independently of the other candidateattributes included in the design? As we discuss later in the chapter, the random assignment4
Figure 2: Outcome Variables in the Democratic Primary Experiment.of attribute levels allows researchers to answer this question by estimating a causal effect calledthe average marginal component effect (AMCE) using simple statistical methods such as linearregression. Second, do the effects of the attribute vary depending on whether the respondent isa Democrat, Republican, or independent? For respondents who are Democrats, the conjoint tasksimulates the choice of their own presidential candidate to run against (most likely) PresidentTrump in the 2020 presidential election. So the main tradeoff for them is whether to choose acandidate that is electable or a candidate who represents their own policy positions more genuinely.On the other hand, for Republican respondents, considerations are likely to be entirely different (atleast for those who intend to vote for President Trump). As we show later, these questions can beanswered by estimating conditional AMCEs, i.e., the average effects of the attributes conditionalon a respondent characteristic measured in the survey, such as partisanship.5
Advantages of Conjoint Designs over Traditional SurveyExperimentsOur Democratic primary experiment represents a typical example of the conjoint survey experiments widely implemented across the empirical subfields of political science. A few factors havedriven the upsurge in the use of conjoint survey experiments. First, there has been increased attention to causal inference and to experimental designs which allow for inferences about causal effectsvia assumptions made credible by the experimental design itself (Sniderman and Grob, 1996). Atthe same time, however, researchers are often interested in testing hypotheses that go beyond thesimple cause-and-effect relationship between a single binary treatment and an outcome variable.Traditional survey experiments are typically limited to analyzing the average effects of one or tworandomly assigned treatments, constraining the range of substantive questions researchers cananswer persuasively. In contrast, conjoint experiments allow researchers to estimate the effects ofvarious attributes simultaneously, and so can permit analysis of more complex causal questions.A second enabling factor is the rapid expansion of surveys administered via computer, which enables researchers to use fully randomized conjoint designs (Hainmueller, Hopkins and Yamamoto,2014). Fully randomized designs, in turn, facilitate the estimation of key quantities such as theAMCEs via straightforward statistical estimation procedures that rely little on modeling assumptions. Moreover, commonly used web-based survey interfaces facilitate the implementation ofcomplex survey designs such as conjoint experiments.A third, critical underlying factor behind the rise of conjoint designs within political scienceis their close substantive fit with key political science questions. For example, political scientistshave long been interested in how voters choose among candidates or parties, a question for whichconjoint designs are well suited. By quantifying the causal effects of various candidate attributespresented simultaneously, conjoint designs enable researchers to explore a wide range of hypothesesabout voters’ preferences, relative sensitivities to different attributes, and biases. But beyondvoting, multi-dimensional choices and preferences are of interest to political scientists in manycontexts and issue areas, such as immigration, neighborhoods and housing, and regulatory policypackages. As we discuss later in this chapter, conjoint designs have been applied in each of thesedomains and beyond.6
Fourth, political scientists are often interested in measuring attitudes and preferences thatmight be subject to social desirability bias. Scholars have argued that conjoint designs can beused as an effective measurement tool for socially sensitive attitudes, such as biases against femalepolitical candidates (Teele, Kalla and Rosenbluth, 2018) and opposition to siting a low-incomehousing project in one’s neighborhood (Hankinson, 2018). When respondents are evaluating several attributes simultaneously, they may be less concerned that researchers will connect their choiceto one specific attribute. In keeping with this expectation, early evidence suggests that fully randomized conjoint designs do indeed mitigate social desirability bias by asking about a sociallysensitive attribute along with a host of other randomly varying attributes (Horiuchi, Markovichand Yamamoto, 2019).Finally, evidence suggests that conjoint designs have desirable properties in terms of validity.On the dimension of external validity, Hainmueller, Hangartner and Yamamoto (2015) find thatcertain conjoint designs can effectively approximate real-world benchmarks in Swiss citizenshipvotes while Auerbach and Thachil (2018) find that political brokers in Indian slums have theattributes that local residents reported valuing via a conjoint experiment. Conjoint designs havealso proven to be quite robust. For one thing, online, opt-in respondents commonly employed insocial science research can complete many conjoint tasks before satisficing demonstrably degradesresponse quality (Bansak et al., 2018). Such respondents also prove able to provide meaningfuland consistent responses even in the presence of a large number of attributes (Bansak et al., 2019).In short, conjoint designs have a range of theoretical and applied properties that make themattractive to political scientists. But, of course, no method is appropriate for all applications.Later in this chapter, we therefore flag the limitations of conjoint designs as well as the openquestions about their usage and implementation.Designing Conjoint Survey ExperimentsWhen implementing a conjoint experiment, survey experimentalists who are new to conjoint analysis face a multitude of design considerations unfamiliar to them. Here, we review a numberof key components of a conjoint design that have implications for conjoint measurement and offer guidance on how to approach them, using the Democratic primary experiment as a running7
example.Number of profiles. In the Democratic primary experiment, we used a “paired-profile” designin which each conjoint table contained two profiles of hypothetical Democratic candidates. Butother designs are also possible. One example is a “single-profile” design in which each table presentsonly one set of attribute values; another is a multiple-profile design that contains more than twoprofiles per table. Empirically, paired-profile designs appear to be the most popular choice amongpolitical scientists, followed by single-profile designs. Hainmueller, Hangartner and Yamamoto(2015) provide empirical justification for this choice, showing that paired-profile designs tend toperform well compared to single-profile designs, at least in the context of their study comparingconjoint designs against a real-world benchmark.Number of attributes. An important practical question is how many attributes to include ina conjoint experiment. Here, researchers face a difficult trade-off between masking and satisficing(Bansak et al., 2019). On one hand, including too few attributes will make it difficult to interpretthe substantive meaning of AMCEs, since respondents might associate an attribute with anotherthat is omitted from the design. Such a perceived association between an attribute included inthe design and another omitted attribute muddies the interpretation of the AMCE of the formeras it may represent the effects of both attributes (i.e., masking). In our Democratic primaryexperiment, for example, the AMCEs of the policy position attributes might mask the effect ofother policy positions that are not included in the design if respondents associate a liberal positionon the former with a similarly liberal position on the latter. On the other hand, including toomany attributes might increase the cognitive burden of the tasks excessively, inducing respondentsto satisfice (Krosnick, 1999).Given the inherent trade-off, how many attributes should one use in a conjoint experiment?Although the answer to the question is likely to be highly context dependent, Bansak et al.(2019) provide useful evidence that subjects recruited from popular online survey platforms suchas Mechanical Turk are reasonably resistant to satisficing due to the increase in the number ofconjoint attributes. Based on the evidence, they conclude that the upper bound on the permissiblenumber of conjoint attributes for online surveys is likely to be above those used in typical conjointexperiments in political science, such as our Democratic primary example in which 10 attributes8
were used. Moreover, ho
Conjoint analysis is a survey-experimental technique that is widely used as a tool to answer these types of questions across the social sciences. The term originates in the study of \conjoint measurement" in 1960s mathematical p