Transcription
VIRGINIA COMMUNITYCOLLEGE SYSTEMFINANCIAL REPORTFOR THE YEAR ENDED JUNE 30, 2021(UNAUDITED)Prepared by:Office of Fiscal ServicesVirginia Community College System300 Arboretum Place, Suite 200Richmond, Virginia 23236
VCCS Financial Report 2020‐2021STATE BOARD MEMBERSEdward Dalrymple, Jr., ChairNathaniel L. Bishop, Vice ChairDana BecktonAdnan BokhariDavid E. BroderBrenda CalderonDarren ConnerDouglas M. GarciaDarius A. JohnsonAshby KilgorePeggy LayneR J NarangRichard S. Reynolds IIIEleanor B. SaslawTerri N. ThompsonCHANCELLORGlenn DuBoisSecretary, State BoardOFFICER REPORTINGRandall B. EllisChief Accounting Officer/Controller
VCCS Financial Report 2020‐2021TABLE OF CONTENTSManagement’s Discussion and Analysis1Consolidated Financial Statements12Notes to the Financial Statements18Required Supplementary Information89Individual College Financial Statements:Blue Ridge Community CollegeCentral Virginia Community CollegeDabney S. Lancaster Community CollegeDanville Virginia Community CollegeEastern Shore Community CollegeGermanna Community CollegeJ. Sargeant Reynolds Community CollegeJohn Tyler Community CollegeLord Fairfax Community CollegeMountain Empire Community CollegeNew River Community CollegeNorthern Virginia Community CollegePatrick Henry Community CollegePaul D. Camp Community CollegePiedmont Virginia Community CollegeRappahannock Community CollegeSouthside Virginia Community CollegeSouthwest Virginia Community CollegeThomas Nelson Community CollegeTidewater Community CollegeVirginia Highlands Community CollegeVirginia Western Community CollegeWytheville Community CollegeSystem OfficeShared Services 3178183188193198203208213218223
VIRGINIA COMMUNITY COLLEGE SYSTEMManagement’s Discussion and Analysis(Unaudited)In 1965, the Virginia General Assembly established the Virginia Community College System (VCCS) as aninstitution of higher education. The System includes the State Board for Community Colleges, a SystemOffice located in Richmond, a Shared Services Center located in Daleville and twenty-three communitycolleges located on forty campuses throughout the Commonwealth. The VCCS’ mission is to provideeveryone the opportunity to obtain an education and develop the right skills to enhance lives and strengthencommunities.The following discussion and analysis provides an overview of the financial position and activities of theVCCS for the year ended June 30, 2021. Management has prepared this discussion, which should be readin conjunction with the financial statements and footnotes.The community college foundations are included in the accompanying financial statements as a discretecomponent unit in a separate column. The following discussion and analysis does not include the financialcondition and activities of the foundations.Financial HighlightsThe significant financial highlights for the VCCS in fiscal year 2021 were: Total net position increased by 4.37% as a result of both increases and decreases in severaloperating and nonoperating revenue and expense categories. The results of operations forfiscal year 2021 reflected an overall increase in net position of 38.8 million. Total operating revenues had a slight declined of 3.2%. Student tuition and fees, net ofscholarship discounts and allowances, represented 70.43% of total operating revenues whichis consistent with prior years. The State Board for Community Colleges, in May 2020, approved holding tuition rates(including the differentials at eight community colleges) steady for fiscal year 2021. From fiscal year 2020 to 2021, student full-time equivalent (FTE) enrollment decreased 2.7%from 95,592 to 92,981 FTEs. This decrease resulted in a decline in gross tuition and feecollections of approximately 18.7 million in fiscal year 2021. One FTE represents 30 credithours of classes taken by a student over an academic year and is calculated on an annualbasis by taking the total credit hours taught divided by 30. Total state appropriations revenue (non-capital) remained relatively flat at 433.6 million, andstate capital appropriations revenue decreased by 20.4 million. This decrease is attributed toconstruction activity at Eastern Shore Community College, John Tyler Community College andSouthside Virginia Community College that was substantially complete and funded at June 30,2020. Total operating expenses increased slightly by 1.43%. Expenses for employee compensationrepresented 58.74% of the total operating costs, which is consistent with prior years.1
Financial StatementsThe three financial statements presented are the Statement of Net Position, the Statement of Revenues,Expenses and Changes in Net Position, and the Statement of Cash Flows.Statement of Net PositionThe Statement of Net Position presents assets, deferred outflows of resources, liabilities, deferred inflowsof resources and the net position of the VCCS as of June 30, 2021. Net position is the residual amountequal to assets and deferred outflows of resources less liabilities and deferred inflows of resources. Netposition is presented in three categories; Net investment in capital assets, consists of capital assets, net ofaccumulated depreciation and reduced by outstanding balances of any borrowings that are attributable tothe acquisition, construction, or improvement of those assets. Restricted net position consists of restrictedassets reduced by liabilities related to those assets. Restricted net position is classified as eithernonexpendable or expendable. Nonexpendable balances consist of loan funds and permanentendowments (available for investment purposes only). Expendable balances are available for expenditureby the VCCS but must be used for purposes determined by external entities. Unrestricted net positionbalances are not subject to externally imposed restrictions and may be internally designated for specificpurposes by management of the VCCS.A summarized Statement of Net Position is as follows:Summary of the Statement ofNet Position, as of June 30:Increase (Decrease)(in thousands)2021AssetsCurrent assetsCapital assets, netOther non-current assets Total Assets380,3901,373,98259,6812020 348,4531,392,59857,123Amount %1,965,3921,924,86840,5242.11%LiabilitiesCurrent liabilitiesNon-current 568Total Liabilities933,702905,37728,325Deferred Inflows of Resources(26,561)Deferred Outflows of ResourcesTotal Assets and Deferred Outflows ofResources106,820133,381Total Liabilities and Deferred Inflows ofResources1,040,5221,038,7581,764Net PositionNet investment in capital 35,218(448,417)(9,955)4224,53024,143Total Net Position 924,8702 886,110 9.65%5.38%4.37%
Current AssetsCurrent assets consist of 340.8 million in cash, cash equivalents, and short-term investments, 20.3 millionin accounts, notes, and interest receivable, 7.6 million in amounts due from the commonwealth, 10.3million in prepaid expenses, and 1.4 million in inventories. The 31.9 million increase in current assetswas primarily attributable to an increase of 29.2 million in cash, cash equivalents, and short-terminvestments.Current assets cover current liabilities 2.32 times, an indicator of sound liquidity and the ability to weathershort-term demands on working capital. Current assets also cover over 3.91 months of total operatingexpenses, excluding depreciation. Both ratios remained consistent with prior years. For fiscal year 2021,one month of operating expenses (excluding depreciation) equaled 97.3 million.Capital Assets, Net of Accumulated DepreciationThe overall decrease of 18.6 million in net capital assets was due to the completion of construction andrenovations across several colleges, resulting in the increase in buildings at year-end decreased by normalyearly depreciation. The following table compares fiscal year 2021 to fiscal year 2020 capital assetbalances by category:Summary of Capital Assets, net(in thousands)Increase (Decrease)2021LandConstruction in progressLand improvementsInfrastructureBuildingEquipment and historical treasuresIntangiblesLibrary booksTOTAL 2111,373,982 ,392,598Amount .26%)(46.74%)(20.0%)(1.34%)Construction in Progress (CIP) increased 22.6 million due to on-going projects that had not beencompleted in fiscal year 2021. Depreciable land improvements, buildings, infrastructure, all decreased fromfiscal year 2020 due to the depreciation expense charged exceeding current year additions.A portion of the roof of Templin Hall, home of the Dr. Mary T. Christian Auditorium on Thomas NelsonCommunity College’s Hampton campus, collapsed on April 5, 2021. The VCCS is currently working withengineers and contractors on a plan to rebuild. The target date for Templin Hall reopening is Fall 2022.Other Non-Current AssetsCash equivalents held with trustees consists of balances in State Non-Arbitrage Program (SNAP) accountsrelated to pooled bond capital projects. The balance in appropriation available consists of General andCentral Capital Planning funds for capital projects.Deferred Outflows of ResourcesDeferred outflows of resources category reports consumption of resources applicable to a future reportingperiod. The balances reported for fiscal years 2021 and 2020 include amounts for certain pension and3
OPEB changes and will be recognized as pension and OPEB expenses in future fiscal years. In addition,the balances for both fiscal years include deferred losses on defeasance of debt related to refinancing ofcertain pooled bond issuances and will be recognized as expense in future fiscal years.Current LiabilitiesCurrent liabilities consist of accounts and retainage payable of 29.9 million, accrued payroll expense of 53.3 million, unearned revenues of 47.2 million, long-term obligations (current portion) of 19.3 million,and deposits totaling 11.5 million.Current liabilities decreased by 12.2 million in fiscal year 2021 primarily due to the decrease in unearnedrevenues of 16.4 million. This decrease was a result of the uncertainty of enrollment due to the ongoingpandemic. This decrease was offset slightly by an 8.3 million increase in accounts payable from thepurchases of CARES related expenditures.Non-Current LiabilitiesNon-Current liabilities consist of a net pension obligation of 549.6 million, the OPEB obligation of 119.7million, pooled bonds of 80.4 million, accrued leave of 14.6 million, and federal loan program amountsdue of 2.8 million. The increase of 40.6 million in non-current liabilities was primarily due to the increaseof the VCCS’ proportionate share of the Commonwealth’s overall VRS pension liability and OPEB liabilitiesof 45.1 million. This was offset slightly by decreases in pooled bond debt, and other non-current liabilities.Deferred Inflows of ResourcesThe financial statement deferred inflows of resources category is used to report acquisition of resourcesapplicable to a future reporting period. The balance in fiscal year 2021 reflects certain amounts related topension and OPEB and will impact pension and OPEB expenses in future fiscal years.Net PositionThe decrease in net investment in capital assets of 10 million is explained by changes in capital assets,net of accumulated depreciation and in capital asset related debt. The increase of 24.1 million in theunrestricted net position category is the result of several factors. The fluctuation of the VCCS’ proportionateshare of the Commonwealth’s overall OPEB liability and VCCS’ proportionate share of the overall VRSpension liability. Both liabilities short and long-term portions) had a combined increase of nearly 45.7million. This was offset by decreases in other liability categories and a 38.8 million increase in overalloperations. The balance in total net position is a residual amount equal to the sum of total assets anddeferred outflows of resources less the sum of total liabilities and deferred inflows of resources and isconsidered one measure of the current financial condition of an organization.Statement of Revenues, Expenses and Changes in Net PositionThe purpose of the Statement of Revenues, Expenses and Changes in Net Position is to present operatingand non-operating revenues received by the institution, operating and non-operating expenses incurredand any other revenues, expenses, gains, and losses. Changes in net position as presented on theStatement of Net Position are based on the activity presented in the Statement of Revenues, Expensesand Changes in Net Position.A summarized statement of revenues, expenses and changes in net position follows:4
Summary of the Statement of Revenues,Expenses and Changes in Net PositionFor the year ended June 30:(in thousands)Increase (Decrease)2021Operating revenue 2020447,710 2,2039.31%Income (loss) before other revenues,expenses, gains or losses(6,449)(37,140)30,69182.64%Other revenuesIncrease in net ting expensesOperating lossNon-operating revenues and expensesNet position, beginning of yearNet position, end of year 886,110924,870 Percentage 1.43%The following table is a more detailed representation and comparison of amounts included in operating,non-operating, and other (capital) revenues during the periods ended June 30, 2021, and 2020:5
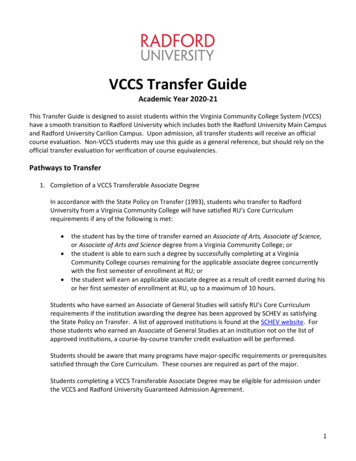
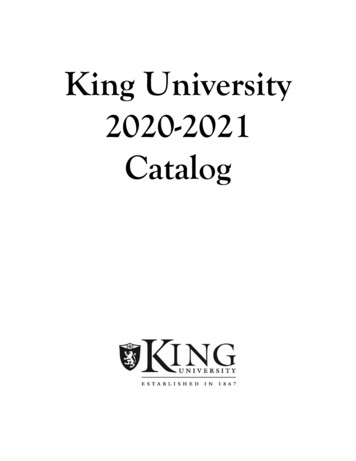
Summary Statement of Revenuesfor the year ended June 30:(in thousands)Increase (Decrease)20212020AmountPercentageOperating revenuesStudent tuition and fees, net 315,340 318,771(3,431)(1.08%)Grants and contracts90,570104,130(13,560)(13.02%)Auxiliary enterprises, net16,39922,934(6,535)(28.49%)Other operating 799)(3.20%)State operating appropriations433,649433,767(118)(.03%)Local operating 1,0934,240Interest 0562,203Capital appropriations-state30,91251,287(20,375)Capital appropriations-local6,9217,767(846)(10.89%)Capital gifts and )(33.38%)Total Operating Revenues Non-operating activityGrants and giftsInvestment incomeTotal net non-operating 43.53%)9.31%Other revenues (capital)Total other revenues (capital)Total revenues 1,223,427 1,198,675 24,752(39.73%)2.06%** Includes sales/services of education department and miscellaneous other revenuesOperating RevenuesTotal operating revenues decreased by 3.20% compared to the prior year. Gross student tuition and feerevenues (before scholarship discounts and allowances) declined by 18.7 million reflecting a 2.7% declinein enrollment. Net tuition and fees revenue decreased by 3.4 million or slightly over 1%. Tuition and feerates remained constant from FY20 contributing to this revenue decline. Other operating revenue sourcesfluctuated slightly contributing to the overall decline in operating revenues of 14.8 million.Non-operating and Other RevenuesTotal net non-operating revenue increased by 62.2 million. Grants and gifts revenue were the largestcontributing factor increasing over 65.4 million largely as a result of the CARES Act funding received. Thisincrease was offset by minor fluctuations in other non-operating categories.6
A graphic presentation of fiscal year 2021 revenues by source (per the Statement of Revenues,Expenses and Changes in Net Position) is below.7
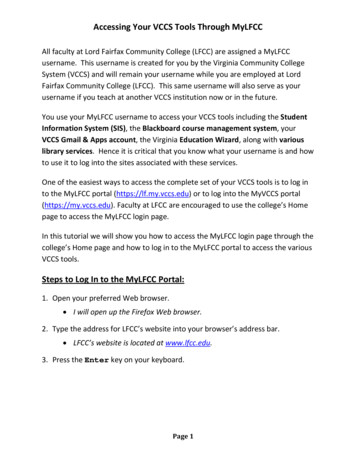
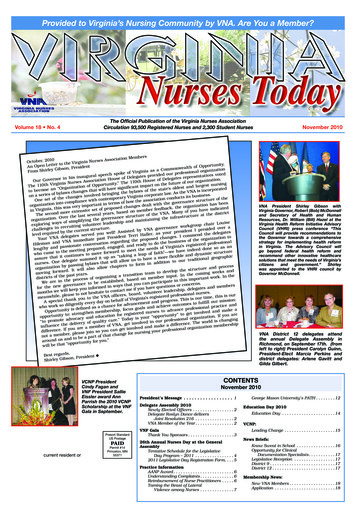
The following table is a detailed breakdown of operating expenses by function and a comparison of changesby category for the periods ended June 30, 2021, and 2020:Summary Statement of Expenses by Functionfor the year ended June 30:(in thousands)Increase (Decrease)20212020AmountPercentageOperating expenses:Instruction Public service426,303 459,348 c support112,091106,3165,7755.43%Student services100,845109,622(8,777)(8.01%)Institutional support238,154177,10461,05034.47%Operation and s and fellowships138,979130,4928,4876.50%Auxiliary enterprises8,70212,217(3,515)(28.77%)Other expenses1,146512634123.80%16,7131.43%Total operating expenses 1,184,667 1,167,954 Operating ExpensesOperating expenses totaled approximately 1.2 billion for fiscal year 2021, an increase of 16.7 million.The natural expense category, compensation and benefits, comprised 695.9 million of total VCCSoperating expenses representing a 1.88% decrease over fiscal year 2020. Scholarship expenses increased 9.6 million, due to the additional CARES Act funding received for fiscal year 2021. The net change acrossthe other natural expense categories (i.e., utilities and depreciation) remained relatively flat with theexception of supplies, services, and other expenses which increased by 23.7 million, again as a result ofadditional CARES Act expenditures.8
A graphic presentation of fiscal year 2020 operating expenses by function (per the Statement ofRevenues, Expenses and Changes in Net Position) is below.9
Statement of Cash FlowsThe Statement of Cash Flows provides additional information about the financial results of the VCCS byreporting the major sources and uses of cash.The primary sources of cash for the VCCS included tuition and fees of 302 million, operating grants andcontracts of 87.4 million, and auxiliary revenues of 16.4 million. The primary uses of operating cashincluded employee salaries, wages, fringe benefits and pension benefits of 701.2 million, operatingexpenses (payments to suppliers/others and utilities) of 277.9 million and scholarships of 142.6 million.Net cash used in operations is significantly greater than the cash received from operations on this statementdue to the required presentation of state appropriation and grants/gifts as cash flows from non-capitalfinancing activities. Net cash flows provided by non-capital financing activities increased 68.0 millionprimarily due to the influx of CARES Act funds. Net cash flows from capital and related financing activitiesdecreased 7.9 million due to a decrease of 31.5 million in state and local capital appropriations offset bya decrease in cash disbursements for capital asset purchases. Net cash provided by (used in) investingactivities increased 7.7 million as investment purchases were 15.7 million lower in fiscal year 2021 andsale of investments were 6.4 million lower in fiscal year 2021. The overall increase in cash and cashequivalents was 44.1 million at the end of fiscal year 2021.10
Economic OutlookFor fiscal year 2021, the Commonwealth predicted a 2.6% increase in general fund revenues and collectedat a rate that was 14.2% above fiscal year 2020. This overage was due to the financial impact of theCOVID-19 pandemic being much less severe than predicted.The State Board for Community Colleges has noted its intention to keep VCCS tuition and mandatory feesat less than half the rates of public four-year institutions in Virginia. The VCCS’ rate in fiscal year 2022 willbe 32.8% of the average of the four-year institutions for total tuition and mandatory fees.Effective with the fall 2019 session, the State Board for Community Colleges elected to not change tuitionrates for all students. Within the VCCS, eight colleges have (unchanged) tuition differential rates rangingfrom 1.00 per credit hour to 29.05 per credit hour.Chapter 552, 2021 Special Session I of the Virginia Acts of Assembly, authorized the funding for theconstruction of Germanna Community College Replace French Slaughter Building project. This Chapteralso authorized additional funding for the planning phase of Central Virginia Community College RenovateAmherst/Campbell Hall project. Chapter 1, 2021 Special Session II of the Virginia Acts of Assemblyauthorized 40,000,000 for two capital projects at Northern Virginia Community College.The VCCS capitalized construction expenses totaling 28.8 million during fiscal year 2021. These costsprimarily included projects that were still in construction as of June 30, 2021, but also included a few projectsthat were complete as of June 30, 2021. Construction costs for projects completed during fiscal year 2021totaled 4.6 million.The VCCS entered into contractual commitments for capital projects totaling 175.9 million prior to June30, 2021. Expenses processed against these commitments during fiscal year 2021 totaled 127.7 million,leaving an unpaid commitment balance of 48.2 million as of June 30, 2021.In March 2020, the community colleges shifted from traditional classroom teaching to online and distancelearning platforms as a result of the Governor’s executive orders that closed college campuses to respondto the COVID-19 global pandemic. For the health and safety of the public, the majority of on-campusoperations and all events were canceled or delayed resulting in faculty and staff teleworking. For the fiscalyear ending June 30, 2021, expenses related to the transition to remote education and other activities inresponse to the outbreak were incurred. This continued in fiscal year 2021 with on-campus activity slowlyreturning in the spring of 2021. The financial impact and continued duration of altered business processescannot be reasonably estimated at this time.11
CONSOLIDATEDFINANCIALSTATEMENTS12
Page 13Virginia Community College SystemConsolidatedStatement of Net PositionAs of June 30, 2021ComponentUnitsVCCSFoundationsAssetsCurrent AssetsCash and cash equivalents (Note 2)Short term investments (Note 2)Accounts receivable, net (Note 3)Pledges receivable (Note 3)Due from commonwealth (Note 4)Interest receivablePrepaid expensesInventoriesNotes receivable, net (Note 3)Total Current 18,861Noncurrent AssetsRestricted cash and cash equivalents (Note 2)Cash equivalents with trustees (Note 2)Endowment cash and cash equivalents (Note 2)Appropriation availableEndowment investments (Note 2)Other long-term investments (Note 2)Accounts receivable, net (Note 3)Investments in real estate (Note 2)Pledges receivable (Note 3)Due from commonwealth (Note 4)Notes receivable, net (Note 3)Post employment benefit assets (Note 18)Non-depreciable capital assets, net (Note 5)Depreciable capital assets, net (Note 5)Total Noncurrent 37Total Assets1,814,053,404429,359,798Deferred Outflows of Resources (Note 8)Total Assets and Deferred Outflows of iesCurrent LiabilitiesAccounts and retainage payable (Note 6)Accrued payroll expenseUnearned revenueLong-term liabilities-current portion (Note 9)Securities lending obligationPost employment benefit obligations (Note 9)DepositsTotal Current Liabilities661,5995,868,477
Page 14Virginia Community College SystemConsolidatedStatement of Net PositionAs of June 30, 2021ComponentUnitsVCCSFoundationsNoncurrent LiabilitiesLong-term liabilities (Note 9)Due to federal government (Note 9)Pension and post employment benefit obligations (Note 9)Total Noncurrent 1211,297,717Total Liabilities933,702,50617,166,194Deferred Inflows of Resources (Note 8)106,819,885Total Liabilities and Deferred Inflows of 9,66829,255,500Net PositionNet investment in capital assetsRestricted for:NonexpendableExpendableUnrestrictedTotal Net 5,556,696139,205,084108,176,324412,193,604The accompanying Notes to the Financial Statements are an integral part of this statement.
Page 15Virginia Community College SystemConsolidatedStatement of Revenues, Expenses and Changes in Net PositionFor the Year Ended June 30, 2021ComponentUnitsRevenuesOperating RevenueTuition and fees (net of scholarship allowance of 159,576,345)Federal grants and contractsState and local grantsNongovernmental grantsSales/services of education departmentAuxiliary enterprises (net of scholarship allowance of 798,201)Gifts and contributionsEndowment incomeOther operating revenuesTotal Operating 969,387ExpensesOperating ExpensesInstructionPublic serviceAcademic supportStudent servicesInstitutional supportOperation and maintenanceScholarships and fellowshipsAuxiliary enterprisesFundraisingOther expensesTotal Operating Expenses (Note 12)Operating Income 291,75339,568,62931,769,583Nonoperating Revenues(Expenses)State appropriations (Note 13)Local appropriationsGrants and giftsInvestment incomeInterest on capital asset related debtOther nonoperating revenue (expense)Net Nonoperating RevenueIncome before other revenues, expensesgains (losses)Capital appropriations-state (Note 20)Capital appropriations-localCapital gifts, grants and contractsAdditions to permanent and term endowmentsIncrease (Decrease) in Net 924,869,912350,397,266412,193,604Net PositionNet Position beginning of yearNet Position end of yearThe accompanying Notes to the Financial Statements are an integral part of this statement.
Virginia Community College SystemConsolidatedStatement of Cash FlowsFor the Year Ended June 30, 2021Page 16Cash flows from operating activities:Tuition and feesGrants and contractsPayments to suppliers and othersPayments for employee wagesPayments for employee fringes and pension benefitsPayment for scholarshipsPayments for utilitiesSales and services of education departmentAuxiliaryLoans issued to studentsLoans collected from studentsOtherNet cash used by operating ash flows from non-capital financing activities:State appropriationsLocal appropriationsGrants and giftsCustodial receiptsCustodial disbursementsPLUS, Stafford and Direct Lending loan receiptsPLUS, Stafford and Direct Lending loan disbursementsOther non-operating revenue(expense)Net cash provided (used) by non-capital financing sh flows from capital and related financing activities:Capital appropriations-stateCapital appropriations-localCapital grants and giftsPurchase capital assetsProceeds from sale of capital assetsProceeds from bond issueDebt interest paymentsDebt principal paymentsNet cash provided (used) by capital financing 2)Cash flows from investing activities:Purchases of investmentsSale of investmentsInvestment incomeNet cash provided (used) by investing 6Net increase (decrease) in cash and cash equivalentsCash and cash equivalents, beginning of yearCash and cash equivalents, End of Year44,150,962279,431,156323,582,118
Virginia Community College SystemConsolidatedStatement of Cash FlowsFor the Year Ended June 30, 2021Reconciliation of operating income (loss) to net cash used in operating activities:Operating income (loss)Adjustment to reconcile operating income (loss) to net cash used in operating activities:Depreciation expenseChanges in assets, deferred outflows, liabilities and deferred inflows:Appropriation available and accounts receivable, netPrepaid expenses and otherPost employment benefits assetAccrued compensation and leaveAccounts payable and otherUnearned revenueDeposits pending distributionPension liabilityPost employment benefits liabilityDeferred inflows of resources related to pensions and post employment benefitsDeferred outlflows of resources related to pensions and post employment benefitsNet cash used in operating activitiesReconciliation of cash and cash equivalents:Cash and cash equivalents per Statement of Net PositionLess: Securities Lending Cash EquivalentsCash and cash equivalents end of yearPage 7)323,660,60378,485323,582,118Noncash transactionsDonated fixed assetsDebt principal and interest payments made by TreasuryAmortization of bond premiumUnrealized gain/loss on investmentsAmortization of deferral on debt defeasanceThe accompanying Notes to the Financial Statements are an integral part of this )
NOTES TO THEFINANCIALSTATEMENTS18
VIRGINIA COMMUNITY COLLEGE SYSTEMNOTES TO FINANCIAL STATEMENTSAs of June 30, 20211.SUMMARY OF SIGNIFICANT A
Thomas Nelson Community College 193 Tidewater Community College 198 Virginia Highlands Community College 203 Virginia Western Community College 208 . This decrease resulted in a decline in gross tuition and fee collections of approximately 18.7 million in fiscal year 2021. One FTE represents 30 credit