Transcription
IEOR E4703: Monte-Carlo SimulationOther Miscellaneous Topics and Applications of Monte-CarloMartin HaughDepartment of Industrial Engineering and Operations ResearchColumbia UniversityEmail: martin.b.haugh@gmail.com
OutlineCapital Allocation in Risk ManagementAn ApplicationQuasi-Monte-CarloPricing Bermudan Options2 (Section 0)
Capital Allocation in Risk ManagementTotal loss given by L Pni 1Li .Suppose we have determined the risk, %(L), of this loss.The capital allocation problem seeks a decomposition, AC1 , . . . , ACn , such that%(L) nX(1)ACii 1- ACi is interpreted as the risk capital allocated to the i th loss, Li .This problem is important in the setting of performance evaluation where wewant to compute a risk-adjusted return on capital (RAROC).e.g. We might set RAROCi Expected Profiti / Risk Capitali- must determine risk capital of each Li in order to compute RAROCi .3 (Section 1)
Capital AllocationPnMore formally, let L(λ) : i 1 λi Li be the loss associated with the portfolioconsisting of λi units of the loss, Li , for i 1, . . . , n.Loss on actual portfolio under consideration then given by L(1).Let %(·) be a risk measure on a space M that contains L(λ) for all λ Λ, anopen set containing 1.Then the associated risk measure function, r% : Λ R, is defined byr% (λ) %(L(λ)).We have the following definition .4 (Section 1)
Capital Allocation PrinciplesDefinition: Let r% be a risk measure function on some set Λ Rn \ 0 such that1 Λ.Then a mapping, f r% : Λ Rn , is called a per-unit capital allocation principleassociated with r% if, for all λ Λ, we havenXrλi fi % (λ) r% (λ).(2)i 1rWe then interpret fi % as the amount of capital allocated to one unit of Liwhen the overall portfolio loss is L(λ).rThe amount of capital allocated to a position of λi Li is therefore λi fi % andso by (2), the total risk capital is fully allocated.5 (Section 1)
The Euler Allocation PrincipleDefinition: If r% is a positive-homogeneous risk-measure function which isdifferentiable on the set Λ, then the per-unit Euler capital allocation principleassociated with r% is the mappingrf r% : Λ Rn : fi % (λ) r%(λ). λiThe Euler allocation principle is a full allocation principle since a well-knownproperty of any positive homogeneous and differentiable function, r(·) isthat it satisfiesnX rr(λ) λi(λ). λii 1The Euler allocation principle therefore gives us different risk allocations fordifferent positive homogeneous risk measures.There are good economic reasons for employing the Euler principle whencomputing capital allocations.6 (Section 1)
Value-at-Risk and Value-at-Risk ContributionsαLet rVaR(λ) VaRα (L(λ)) be our risk measure function.Then subject to technical conditions can be shown thatrαfi VaR (λ) α rVaR(λ) λi E [Li L(λ) VaRα (L(λ))] ,for i 1, . . . , n.(3)Capital allocation, ACi , for Li is then obtained by setting λ 1 in (3).Will now use (3) and Monte-Carlo to estimate the VaR contributions from eachsecurity in a portfolio.- Monte-Carlo is a general approach that can be used for complex portfolioswhere (3) cannot be calculated analytically.7 (Section 1)
An Application: Estimating Value-at-Risk ContributionsRecall total portfolio loss is L Pni 1Li .According to (3) with λ 1 we know thatACi E [Li L VaRα (L)] VaRα (λ) λi wi(4)λ 1 VaRα wi(5)for i 1, . . . , n and where wi is the number of units of the i th security held inthe portfolio.Question: How might we use Monte-Carlo to estimate the VaR contribution,ACi , of the i th asset?Solution: There are three approaches we might take:8 (Section 1)
First Approach: Monte-Carlo and Finite DifferencesAs ACi is a (mathematical) derivative we could estimate it numerically using afinite-difference estimator.Such an estimator based on (5) would take the formi, i, d i : VaRα VaRαAC2δi(6)i, thwhere VaRi, α (VaRα ) is the portfolio VaR when number of units of the isecurity is increased (decreased) by δi wi units.Each term in numerator of (6) can be estimated via Monte-Carlo- same set of random returns should be used to estimate each term.What value of δi should we use? There is a bias-variance tradeoff but a value ofδi .1 seems to work well.Pn dThis estimator will not satisfy the additivity property so that i ACi 6 VaRαd- but easy to re-scale estimated AC i ’s so that the property will be satisfied.9 (Section 1)
Second Approach: Naive Monte-CarloAnother approach is to estimate (4) directly. Could do this by simulating NPn(j)portfolio losses L(1) , . . . , L(N ) with L(j) i 1 Li(j)- Liis the loss on the i th security in the j th simulation trial.(m)Could then set (why?) ACi Li where m denotes the VaRα scenario, i.e.L(m) is the dN (1 α)eth largest of the N simulated portfolio losses.Question:Will this estimator satisfy the additivity property, i.e. willPnAC VaRα ?iiQuestion: What is the problem with this approach? Will this problem disappearif we let N ?10 (Section 1)
A Third Approach: Kernel Smoothing Monte-CarloAn alternative approach that resolves the problem with the second approach is totake a weighted average of the losses in the i th security around the VaRαscenario.A convenient way to do this is via a kernel function.In particular, say K (x; h) : Kxh is a kernel function if it is:1. Symmetric about zero2. Takes a maximum at x 03. And is non-negative for all x.A simple choice is to take the triangle kernel so that xK (x; h) : max 1 ,0 .h11 (Section 1)
A Third Approach: Kernel Smoothing Monte-CarloThe kernel estimate of ACi is then given by PN(j)ˆ α ; h L(j)KL VaRikerj 1d AC: PiN(j) VaRˆ α; hj 1 K L(7)d α : L(m) with m as defined above.where VaROne minor problem with (7) is that the additivity property doesn’t hold. Caneasily correct this by instead setting PN(j)ˆ α ; h L(j) VaRikerj 1 K Ldαd AC: VaR.(8)iPN(j) VaRˆ α ; h L(j)j 1 K LMust choose an appropriate value of smoothing parameter, h.Can be shown that an optimal choice is to seth 2.575 σ N 1/5where σ std(L), a quantity that we can easily estimate.12 (Section 1)
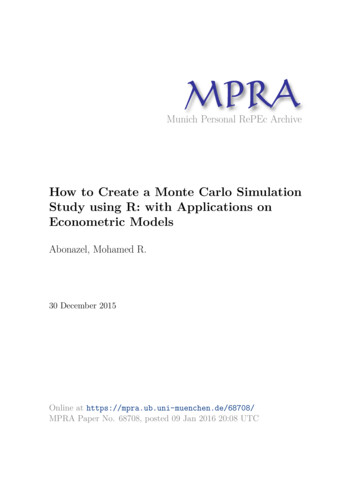
When Losses Are Elliptically DistributedIf L1 , . . . , LN have an elliptical distribution then it may be shown thatACi E [Li ] Cov (L, Li )(VaRα (L) E [L]) .Var (L)(9)In numerical example below, we assume 10 security returns are ellipticallydistributed. In particular, losses satisfy (L1 , . . . , Ln ) MNn (0, Σ).Other details include:1. First eight securities were all positively correlated with one another.2. Second-to-last security uncorrelated with all other securities.3. Last security had a correlation of -0.2 with the remaining securities.4. Long position held on each security.Estimated VaRα .99 contributions of the securities displayed in figure below- last two securities have a negative contribution to total portfolio VaR- also note how inaccurate the “naive” Monte-Carlo estimator is- but kernel Monte-Carlo is very accurate!13 (Section 1)
14 (Section 1)
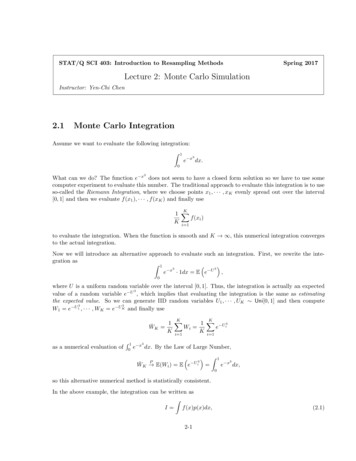
Quasi Monte-Carlo MethodsConsider problem of computing an integral over the d-dimensional unit cube. A principle advantage of Monte Carlo is the order 1/ n convergence rate- which is independent of d.In contrast, standard numerical integration schemes based on a rectangular gridof points converge as 1/(n 2/d ).But many interesting problems are high-dimensional so Monte Carlo simulationcan provide a significant computational advantage.But . a sample of uniformly distributed points in the d-dimensional unit cubecovers the cube inefficiently- see figure on next slide for example15 (Section 2)
7Uniform Random Samples in [0, 1]20.80.91
Low Discrepancy SequencesA d-dimensional low discrepancy sequence (LDS) is a deterministic sequence ofpoints in the d-dimensional unit cube that fills the cube efficiently, i.e. it has alow discrepancy.This low discrepancy property results in a convergence rate of (log n)d /n,implying in particular that they can often be much more effective than MonteCarlo methods.An example of a 2-dimensional LDS is plotted in figure on next slide.17 (Section 2)
1Low Discrepancy .50.60.70.8Dimensional Low Discrepancy Points in [0, 1]20.91
Low Discrepancy SequencesIt is clear there is nothing random about low discrepancy points.Hence the term Quasi Monte Carlo often used to refer to approaches that useLDS as an alternative to standard Monte Carlo methods.If the objective is to calculateZθ : E[f (U1 , . . . , Ud )] f (x) dx[0,1)dthen we can estimate it withθ̂ : n1 Xf (xi )n i 1where x1 , . . . , xn are a d-dimensional sequence of low-discrepancy points from theunit hypercube, [0, 1)d .19 (Section 2)
DiscrepancyDefinition: Given a collection, A, of subsets of [0, 1)d , we define the discrepancyof a set of points {x1 , . . . , xn } relative to A asD(x1 , . . . , xn ; A) : supA A#{xi A} vol(A)nwhere vol(A) denotes the volume of A.The discrepancy of a sequence, D(x1 , . . . , xn ), is then obtained by taking Ato be the collection of rectangles of the formdY[uj , vj ),0 uj vj 1.(10)j 1The star discrepancy, D (x1 , . . . , xn ) is obtained by taking uj 0 in (10).Low discrepancy sequences are sequences of points for which the stardiscrepancy is small (in a sense we do not define here).20 (Section 2)
Low Discrepancy SequencesRecall that if we wish to generate IID d-dimensional vectors of U (0, 1) randomvariables then we can simply:1. Generate a sequence of U1 , . . . , Ud , Ud 1 , . . . , U2d , . . . of IID uniforms2. Take (U1 , . . . , Ud ), (Ud 1 , . . . , U2d ), . . . as our sequence of IID vectors.This is not the case with low discrepancy sequences: the dimensionality, d, is akey component in constructing the low discrepancy points.This dependence on the dimensionality of the problem is clear when we realizethe need to specify the dimensionality of the problem before tackling any givenproblem.Question: How might you evaluate an expectationθ : E[f (X)]where X is a d-dimensional multivariate normal random vector? Consider firstthe case where the d normal random variables are independent.21 (Section 2)
Advantages of Low Discrepancy Sequences1. Their asymptotic convergence properties are superior to those of MonteCarlo simulation and their performance is often dramatically superior inpractice.2. The number of points, n, need not be known in advance. This is a propertyshared with Monte Carlo but not with numerical integration techniques thatare based on regular grids.22 (Section 2)
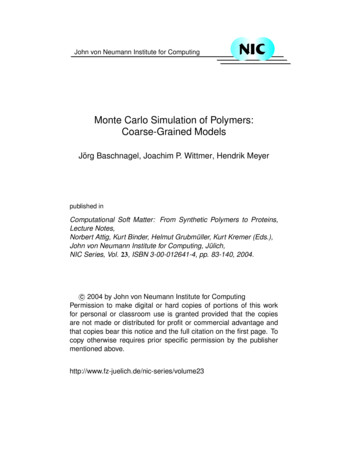
Disadvantages of Low Discrepancy Sequences1. For a fixed sample size, n, there is no guarantee that low discrepancysequences will outperform Monte Carlo simulation.e.g. Many popular LDS cover the initial coordinates, (x1 , x2 ), more or lessuniformly.But they do not cover the final coordinates, (xd 1 , xd ), in a sufficiently uniformmanner (until n is sufficiently large).Figures (a) and (b) display 2-dimensional projections of the first 2 and final 2coordinates, respectively, of the first 1, 000 points of the 32-dimensional Haltonsequence.23 (Section 2)
110.80.80.60.60.40.40.20.200.50.60.70.80.91(a) 1st 2 dimensions of 32-dimensional Haltonsequence000.20.40.60.81(b) Last 2 dimensions of the sequence.
Disadvantages of Low Discrepancy Sequencese.g. ctd. Clear the 1, 000 points fill first 2 dimensions much more uniformly thanthe final two dimensions.This behavior is not atypical and can lead to very inaccurate results if:1. An insufficient number of points is used2. Function being integrated depends to a significant extent on arguments ofthe higher dimensions- often the case when pricing derivative securities, for example- might then be necessary to raise n to an unsatisfactorily high level.There are various methods available for counteracting this problem, including theuse of leaped and scrambled sequences.Also possible to use the Brownian bridge construction and / or stratifiedsampling techniques to overcome some of these problems.25 (Section 2)
Disadvantages of Low Discrepancy Sequences2. Since LDS are deterministic, confidence intervals (CIs) are not readilyavailable- so difficult to tell whether or not an estimate is sufficiently accurate.There are now methods available to randomize LDS, however, and soapproximate CIls can be constructed.One method is to generate a uniform random vector, U1 Rd , and then setθ̂1 : n1 Xf ((xi U1 ) mod 1)n i 1where the mod 1 operation is applied separately to each of the d coordinates.Note that θ̂1 is now (why?) an unbiased estimator of θ.Can repeat this m times to obtain IID sample θ̂1 , . . . , θ̂m which can then be usedto construct CIs for θ.26 (Section 2)
Quasi Monte-CarloMore care needed when applying LDS than when applying Monte Carlo.But LDS often produce significantly better estimates- therefore worth considering for applications where computationalrequirements are very demanding.In practice LDS are often applied in very high-dimensional problems whentraditional Monte-Carlo might be too slowe.g. pricing of mortgage-backed securities.But precisely in high-dimensional applications where most care is needed whenusing LDS.Also worth noting that careful use of variance reduction techniques can oftennarrow the gap significantly between the performance of LDS and Monte-Carlo.Theory underlying LDS is based on number theory and abstract algebra and isnot probabilistic.27 (Section 2)
An Application: Pricing MBSWe consider the pricing of a principal-only (PO) and interest-only (IO) MBS.Underlying mortgage pool has the following characteristics:Initial balance of the pool is 10mEach underlying mortgage has T 30 years to maturityEach mortgage makes monthly paymentsAverage coupon rate is 10%But service and guaranty fees of .5% yield a pass-through rate of10% .5% 9.5%.We need a prepayment model and a term-structure model.28 (Section 2)
A Prepayment Model (Richard and Roll 1989)We assumeCPRk RIk AGEk MMk BMk(11)where:RIk is the refinancing incentive withRIk : .28 .14 tan 1 ( 8.57 430 (WAC rk (10)))(12)where rk (10) is the prevailing 10-year spot rate at time k.AGEk min (1, t/30) is the seasoning multiplier.MMk is the monthly multiplier with, for example,x : [.94 .76 .74 .95 .98 .92 .98 1.1 1.18 1.22 1.23 .98].Then MMk x(5) if k falls in May or MMk x(2) if k falls in February etc.BMk .3 .7Mk 1 /M0 is the burnout multiplier where Mk remainingprincipal balance at time k.29 (Section 2)
Choosing a Term Structure ModelAlso need to specify a term-structure model in order to fully specify the model.The term structure model will be used to:(i) discount all of the MBS cash-flows in the usual martingale pricing framework(ii) to compute the refinancing incentive according to (11) and (12).Will assume a Vasicek model for the term structure so thatdrt α(µ rt ) dt σ dWtwhere r0 .08, α 0.2, µ 0.1, σ .05 and Wt is a Q-Brownian motion.With this choice we can compute rt (10) analytically.30 (Section 2)
Monte-Carlo Prices of IO and PO MBSUsed N 20, 000 paths.Approximate 95% CI for the IO MBS was[ 4.009m, 4.019m].Approximate 95% CI for the PO MBS was[ 6.225m, 6.279m].Question: Can you give any intuition for why the approximate 95% confidenceinterval for the PO is much wider than the corresponding interval for the IO?31 (Section 2)
Quasi Monte-Carlo Prices of IO and PO MBSPricing IO and PO securities using 20, 000 points of a 360-dimensional LDS weobtain price estimates of 4.011m and 6.257m, respectively.Both of these estimates are inside the 95% Monte-Carlo CIs- thereby suggesting that the 20, 000 points is probably sufficient.If instead we use 10 blocks of 10, 000 low discrepancy points where we randomizeeach block, then we obtain95% CI for IO Price [ 4.013m, 4.016m]95% CI for PO Price [ 6.252m, 6.256m]Note that these CIs are inside the CIs that were obtained using Monte-Carlo.Of course five times as many points were used to obtain these LDS-based CIs butthey are narrower than the Monte-Carlo based CIs by a factor greater than 5.32 (Section 2)
Pricing Bermudan OptionsThe general Bermudan option pricing problem at time t 0 is to compute hτV0 : sup EQ0Bττ T(13)T {0 t1 , . . . , tn T } is the set of possible exercise datesBt is the value of the cash account at time tht h(Xt ) is the payoff function if the option is exercised at time tXt represents the time t (vector) value of the state variables in the model.e.g. In the case of a Bermudan swaption in the LIBOR market model Xt wouldrepresent the time t value of the various forward LIBOR rates.33 (Section 3)
Value Iteration and Q-Value IterationIn theory (13) is easily solved using value iteration:VTVt h(XT ) and BtQ max h(Xt ), EtVt 1 (Xt 1 ) .Bt 1- option price then given by V0 (X0 ).Value iteration is one of the main approaches for solving DPs.An alternative to value iteration is Q-value iteration.The Q-value function is the value of the option conditional on it not beingexercised today, i.e. the Q-value is the continuation value of the option BtQQt (Xt ) EtVt 1 (Xt 1 ) .(14)Bt 134 (Section 3)
Q-Value IterationOption value at time t 1 then given by(15)Vt 1 (Xt 1 ) max(h(Xt 1 ), Qt 1 (Xt 1 ))so that if we substitute (15) into (14) we obtain BtQt (Xt ) EQmax(h(X),Q(X)).t 1t 1t 1tBt 1(16)- this is Q-value iteration.If Xt is high dimensional, then both value iteration and Q-value iteration areimpractical- this is the so-called curse of dimensionality.But we can perform an approximate and efficient version of Q-value iterationusing cross-path regressions.35 (Section 3)
Cross-Path RegressionsFirst step is to choose a set of basis functions, φ1 (X ), . . . , φm (X ).These basis functions define a linear architecture that will be used to approximatethe Q-value functions.In particular, will approximate Qt (Xt ) withe t (Xt ) : r (t) φ1 (Xt ) . . . r (t) φm (Xt )Qm1(t)(t)where rt : (r1 , . . . , rm ) is a vector of time t parameters.36 (Section 3)
Cross-Path Regression for Approximate Q-Value Iterationgenerate N independent paths of Xt for t 1, ., Te T (X i ) 0 for all i 1 to Nset QTfor t T 1 Down to 1(t)(t)Estimate rt (r1 , . . . , rm )e t (X i ) P r (t) φk (X i ) for all iset Qttk kend for e0 (X0 ) max h(X0 ), Qe 0 (X0 )set V37 (Section 3)
Cross-Path Regression for Approximate Q-Value IterationTwo steps require further explanation: e t 1 ) on1. Estimate rt by regressing α max h(Xt 1 ), Q(X(φ1 (Xt ), . . . , φm (Xt )) where α : Bt /Bt 1 is the discount factor for period[t, t 1].Have N observations for this regression with N typically 10k to 50k.e 0 (X0 ) by2. Since all N paths have the same starting point, X0 , can estimate Qe 1 (·) evaluated at the N successor points of X0 .averaging and discounting QObviously more details are required to fully specify the algorithm.38 (Section 3)
Constructing a Lower Bound on the True Option PriceQuite common in practice to use an alternative estimate, V 0 , of V0 .V 0 obtained by simulating the exercise strategy that is defined implicity by thesequence of Q-value function approximations.That is, definee t ht }τe : min{t T : QandV 0 : EQ0 heτ.BeτQuestion: Why is V 0 is an unbiased lower bound on V0 ?Question: Can you guess why we prefer to do an approximate Q-value iterationinstead of an approximate value-iteration?39 (Section 3)
Constructing a Lower Bound on the True Option PriceThese algorithms perform extremely well on realistic high-dimensional problems.There has also been considerable theoretical work explaining why this is so.Quality of V 0 can be explained in part by noting that exercise errors are nevere t (·) lie on the same side of the optimal exercisemade as long as Qt (·) and Qboundary.e t (·) that do not impact theThis means that it is possible to have large errors in Qquality of V 0 !40 (Section 3)
Computing Upper Bounds on Bermudan Option PricesFor an arbitrary super-martingale, πt , value of the Bermudan option satisfies hτQ hτV0 sup EQ supE π πττ00BτBττ Tτ T hτ π sup EQ sup EQτ0 [πτ ]0Bττ Tτ T hτ π sup EQτ π00Bττ T ht EQ π π0(17)maxt0t TBtwhere the second inequality follows from the optional sampling theorem.Taking the infimum over πt on rhs of (17) implies htmaxV0 U0 : inf EQ π π0 .t0πt TBt(18)41 (Section 3)
Computing Upper Bounds on Bermudan Option PricesBut it is known(!) that Vt /Bt is itself a super-martingale so U0 EQmax(h/B V/B) V0 .tttt0t TSince Vt ht for all t, can conclude that U0 V0 .Therefore, V0 U0 , and equality is attained when πt Vt /Bt .Therefore an upper bound on V0 can be constructed simply by evaluating rhs of(17) for any super-martingale, πt .And if super-martingale satisfies πt ht /Bt , then V0 bounded above by π0 .42 (Section 3)
Computing Upper Bounds on Bermudan Option PricesIf πt Vt /Bt then upper bound on the rhs of (17) equals the true price, V0 .Suggests a tight upper bound can be obtained by using an accurateet , to define πt .approximation, VOne possibility is to define πt as a martingale:π0 (19)e0V"πt 1 πt #et 1etet 1etVVVV Et .Bt 1BtBt 1Bt(20)Let V 0 denote the upper bound from (17) corresponding to choice ofsuper-martingale in (19) and (20).Then easy to see the upper bound explicitly given by""#!#tet Xejej 1VVVhtQQe0 E maxV0 V Ej 1 .0t TBtBtBjBj 1j 1(21)43 (Section 3)
A principle advantage of Monte Carlo is the order 1/ n convergence rate-which is independent of d. In contrast, standard numerical integration schemes based on a rectangular grid of points converge as 1/(n2/d). But many interesting problems are high-dimensional so Monte Carlo simulation can provide a significant computational advantage.