Transcription
SERI/TP-231-2973Monte Carlo Simulationas a ResearchManagement ToolLarry J. DouglasJune 1986To be presented at the 1986 TAPPIResearch and Development Conference,September 28 - October 1, 1986,Raleigh, North CarolinaPrepared under Task No. 5250.20FTP No. 616Solar Energy Research InstituteA Division of Midwest Research Institute1617 Cole BoulevardGolden, Colorado 80401-3393Prepared for theU.S. Department of EnergyContract No. DE-AC02-83CH10093
NOTICEThis report was prepared as an account of work sponsored by the United StatesGovernment. Neither the United States nor the United States Department of Energy,nor any of their employees, nor any of their contractors. subcontractors, or theiremployees, makes any warranty, express or implied, or assumes any legal liabilityor responsibility for the accuracy, completeness or usefulness ofany information,apparatus, product or process disclosed, or represents that its use would notinf ringe privately owned rights.
TP-2973MONTE CARLO SIMULATION AS ARESEARCH MANAGEMENT.TOOLsensitive activities in a project, the simu lation will yield the most probable resultsbased on the input distributions.L arry J. Douglas, Ph. D.Manager, Strategic PlanningSolar Fuels Research DivisionSolar Energy Research InstituteGolden, CO 80401BACKGROUNDThe Solar Energy Research Institute {SERI) isthe field manager for the Department of Ener gy (DOE) program to convert lignocellulosicbiomass into ethanol.There are two funda mentalapproachestoconversion,eitherthrough acid hydrolysis of the cellulose toglucose and subsequent fermentation to eth anol or through enzymatic hydrolysis of cel lulose and fermentation to ethanol.Thereare 10 or 12 variations to these basic ap proaches, and SERI managers must choose thebest alternative from among these processesfor funding support and further development.ABSTRACTMonte Carlo simulation provides a researchmanager with a performance monitoring tool olssuchastheProgramEvaluation and Review Technique(PERT)andCritical Path Method (CPM) .The value of theMonte Carlo simulation in a research environ ment is that it 1)provides a method forranking competing processes, 2) couples tech nical improvements to the process economics,and 3) provides a mechanism to determine thevalue of research dollars.In this paper theMonte Carlo simulation approach is developedand applied to the evaluation of three com peting processes for converting lignocellulo sic biomass to ethanol.The technique isshown to be useful for ranking the processesand illus trating the importance of the time frame of the analysis on the decision pro The results show that acid hydrolysiscess.processes have higher potential for near-termapplication (2-5 years) , while the enzymatichydrolysis approach has an equal chance to becompetitiveinthelongterm(beyond10years) .In a recent SERI study titled "Fuel AlcoholTechnical and Economic Analysis," (3) a com pleteevaluationofthenumerous- processoptions was conducted.Process models weredeveloped on a Lotus 1-2-3 spreadsheet foreach of the approaches, and subsequently usedto complete parametric and sensitivity ana lyses for each process. Three processes werethe most promising:the plug flow and pro gressing batch acid hydrolysis processes andtheseparatehydrolysisandfermentationenzymatic hydrolysis process.OBJECTIVESIn this paper we explore the use of MonteCarlo simulation to compare the potential ofthese three processes for producing ethanolfrom 1ignocellulosic biomass.The technicalperformance improvement for each of the pro cesses willbe evaluated by coupling theperformancechangestoethanolproductioncosts.As will be seen later, two equallyimportant considerations in ranking the pro cesses are the technical performance improve ments to each of these processes importantand the time frame in which we evaluate theseparametric improvements.INTRODUCTIONThe managers of research development in gov ernment and private sector organizations facethe very difficult task of selecting, fromamong several potential projects, those thatmost warrant funding from an ever-diminishingresearch budget.Manag ers can use a varietyof analytical techniques to help evaluateoptions and finally select the winners fromamong the candidate processes.This pmentofcriteriarelatedtocost,schedule, and performance.Gantt charts,PERT {Program Evaluation and Review Tech nique) diagrams, and the CPM {Critical PathMethod) analysis are commonly used tools toshowscheduleand/orcostconsiderationsassociated with a project. {l,2)However,they do not provide a quantitative measure ofexpectedperformanceimprovementfortheprograms under investigation.EQ UIPMENTThe use of a Monte Carlo simulation requiresa computer model that gives a reasonablerepresentation of the process under study andthe development of a large random distribu tion of input data to run the model.One runmight have from 5 to 15 parameters and 250 to1000 random numbers for each parameter.Thelarge number of iterations {250-1000)in volved in a typical Monte Carlo simulationrequired the use of a main frame computeruntil the advent of the desktop PC.TheMonte Carlo simulation technique doesprovide a method to couple performance withthe uncertainty in research activity.Thebasic premise of the Monte Carlo technique isthat the uncertainty in a research projectcan be represented by one or more randomnormal distribution functions, and that ifthese uncertainties are coupled to the mostWith a PC and a spreadsheet program, e·. g. ,Lotus 1-2-3, it is now possible to complete aMonte Carlo analysis at your desk.The Lotus1
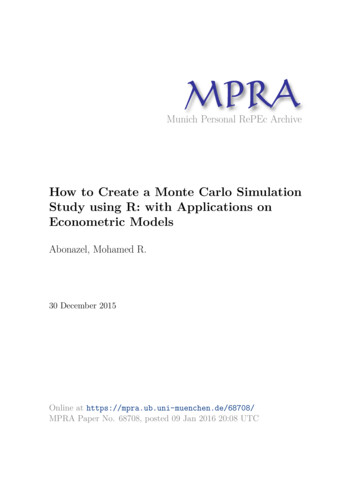
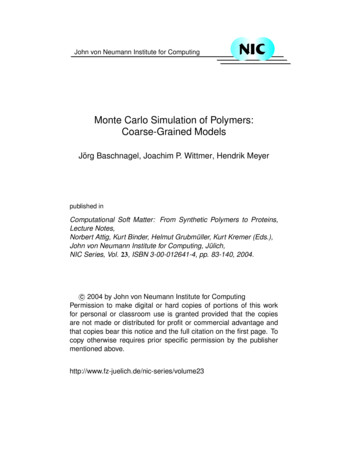
- ·S-'l' lll:gdlll. TP-2973 program is particularly useful for doing thesimulations because of its ease of modifica tion and debugging, built-in graphics capa bility, random number generator, and statis tical and distribution functions.With aprocess simulation model developed on a Lotusspreadsheet, it is possible to complete thetotal Monte Carlo simulation on the samespreadsheet and display the results in graph ical fO"rmat. Cellulose is converted to ethanol by hydro lyzing the cellulose to glucose and thenfermenting the glucose to ethanol.The hy drolysis step can be carried out either by anacidic medium or with enzymes.In this paperwe examine two dilute-acid hydrolysis ap proaches and one enzymatic hydrolysis processand compare them using the Monte Carlo simu lation technique.The two requirements for generating usefulMonte Carlo simulations are a computer modelthat is a reasonable representation of theprocess being studied, and a group of randomnormal distributions that reflect a reason able expectation value for the selected para meter.The first requirement can be satis fied by evaluating the results of the modelover the range of variables being used.Thesecond requires the best judgment of expertsin the technology under investigation andtheir concurrence with the mean values forthe parameters and the expected range of eachvariable. The Plug Flow ReactorFigure 1 is the flowsheet for the plug flowacid hydrolysis process.The plug-flow pro cess uses dilute sulfuric acid (-1% ) at hightemperature and pressure, relying on a veryshort residence time to optimize the yield ofcellulose hydrolyzed to glucose.The processuses eactorathighspeed.At the end of the tube the reactionisquenched;thetotal residence time isapproximately 4 to 6 seconds.The g lucoseyield ranges from 50% to 60% under theseconditions.The advantage of this configura tion is the concurrent production of furfuralfrom the xylose fraction of the feedstock.The favorable economics of the plug flowprocessrely heavily on thefurfural co product selling price.run fourDevelop a model for the process (es)inquestionRun parametric analyses with the model todetermine principal areas of sensitivityDevelop randomnormaldistributionsforeach of the sensitive parameters centeredabout an expectation valueCarbon re 1.Acidtheselected,evaluatethePROCESSES EVALUATEDGENERAL METHODOLOGYThe general approach to developing andning a Monte Carlo simulation involvessteps:Runthesimula 2Flowsheet--Plug- Flow Reactor
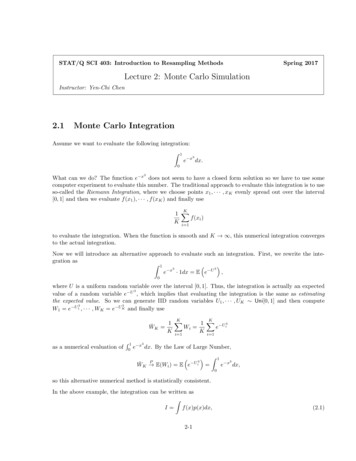
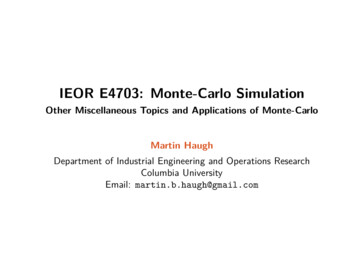
s: 1TP-2973The Progressing Batch ReactorAlcohol Technology and Economic Study.Thedesign basisfor all the models was ed by Badger Engineers{4)in 1984.The base-case plant produces 25,000,000 gal lons of ethanol per year from a feedstock ofmixed hardwoods.To assure the comparabilityof the results, all the designs were the sameexcept the pretreatment and hydrolysis sec tions, which were specific to the individualprocesses.Figure 2 is the flowsheet for the progressingbatch acid hydrolysis process.The progress ing batch process uses dilute sulfuric acidin a multireactor adaptation of the percola tion-type process, but it simulates counter current performance.The process has twotemperature zones: one at 150 C to selec tively remove the hemicellulose portion and asecond at 180 C to hydrolyze the cellulose.The residence time in this type of process isabout two hours.This approach should givehigher sugar yields and concentrations thanthe plug-flow apparatus while also reducingthe degradation of both the CS and C6 sugars.From the process designs and material bal ances, the cost of producing ethanol is cal culated.The capital costs were estimated,using the ICARU . computer-aided cost estima ting program.The base-case processes weredeveloped on a Lotus 1-2-3 spreadsheet, whichallowed easy parametric recalculation of thematerial balance.With the material balancecalculated it is easy to use the spreadsheetmodels to calculate the electrical and ther mal energy requirements of the process, theoverall plant energy balance, and the plantcapital cost.This information provides thebasis for calculating the cost of raw mate rials, utilities, labor, overhead and mainte nance, by-product credits, annualized capitalcharges, and the selling price of ethanol.These models also allow rapid calculation ofsensitivitiesandtheparametricanalysesnecessary toidentifytheparametersforinputs into the Monte Carlo simulations.Separate Hydrolysis and FermentationFigure 3 is the flowsheet for the separatehydrolysis and. fermentation(SHF)process,which is the base system for enzymatic con version of cellulose to ethanol.The processconsists of specialized units to accomplishpretreatment of the feedstock, enzyme produc tion, and hydrolysis of the cellulose toyieldglucosefollowedbyaconventionalfermentation to produce ethanol.The enzyma tic process has the advantage of high yieldsand cleaner process streams than the acidprocesses, but suffers from low rates ofhydrolysisandenzyme production and, atpresent, a prohibitively high enzyme produc tion cost.RESULTS AND DISCUSSIONMODELSWith a well-developed model we can developthe input distributions for running the simu lation.As an example, the economic perfor mance of the progressing batch process wasfound to be very sensitive to the liquidresidence time in the reactor.A consensusThe models used to complete the Monte Carlosimulations were developed on a Lotus spread sheet and were based on the models preparedin conjunction with the above-mentioned FuelCarbon dioxideN gS1ssEthanolS7EnvironmentalsaElectricityFigure 2. Acid Hydrolysis Flowsheet --Progressing Batch Reactor3
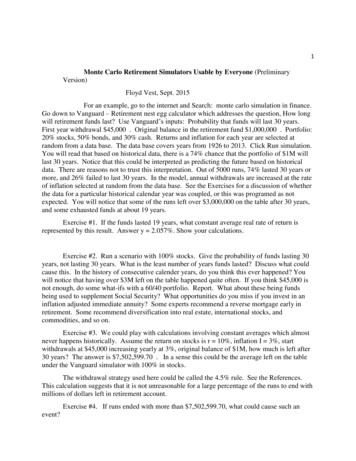
JP-2973Feedstock inputPopulation distributionj9053601-------Nutrients5460 80 100 120 140 160 180 200 220 240 260 280 300 320 340Ethanol selling price cents/gall551.0SSA Yeasts-0.8NutrientsCumulativeprobability560.60.4 Ethanol (99.5%)0.2saStill bottomsFigure 3.To waste treatment and heat generationSeparate Hydrolysistion FlowsheetandEthanol selling priceFermenta Figure 4.of experts in acid hydrolysis suggested anormal distribution to be generated that hada mean (expectation) value of 45 minutes andsigma (the standard deviation) of 10.Thisdistribution contained 250 points and wasused to run a Monte Carlo simulation usingthe Lotus 1-2-3 model for the progressingbatch process, resulting in the output shownFigure 4a shows the outputin Figure 4 .distribution histogram for the selling priceof ethanol;this curve was integrated toyield the cumulative probability curve shownin Figure 4 b. (5)The 0. 5 value on the proba bilitycurve -correspondstotheexpectedselling price for ethanol resulting from thissimulation.(cents I gallProgressing Batch Acid ProcessPoint Monte Carlo Simulation250 0. 12/pound for furfural credit the ethanolselling price dropped to 1. 29/gallon.At250 C the price for ethanol increased to 1. 38/gallon and at 280 C the selling pricedropped to 1.22/gallon.A 0.5% acid concen tration in the reactor increased the sellingprice of ethanol to 1. 32/gallon, and a 1%acid concentration in the reactor resulted inanethanolsellingpriceof 1. 29/gallon(which is the base case) . The plug flow simulations were run usingfour variables; percent solids in the reac tor, by-product credit for furfural, tem perature, and acid concentration.The economic performance of the progressingbatch acid hydrolysis process was also foundto be sensitive to the percent solids in thereactor; e.g., at 10% solids loading in thereactor the selling price of the productethanol was 2. 02/gallon, and at 18% solidsproducesanethanolsellingpriceofThe operating temperature of 1. 41/gallon.the prehydrolysis and the hydrolysis reactorswas found to impact the economics.With theprehydrolysis temperature increased from 150 to 165 C the ethanol selling price rose to 1. 52/gallon.With the hydrolysis tempera ture lowered from 189 to 165 C the sellingprice of ethanol increased to 2. 83/gallon.Reducing the liquid residence time from 4 5 to25minutesincreasedtheethanolsellirJprice to 1. 74 /gallon.The addition of xy lose fermentation to ethanol to the processThe simulations discussed in the remainder ofthepaperwererunusingmultiplevari ables.The variables were chosen based onthe results of sensitivity analyses completedfor each of the processes.The economic performance of the plug flowdilute acid hydrolysis process was found tobe very sensitive to the percent solids en tering the reactor feed pump and to theassigned selling price for the furfural co product.The plug flow system was configuredto operate using a 10% solids slurry producedethanol at a selling price of 2. 04/gallon,while a 20% solids slurry system gave ethanolat about 1. 29/gallon.When the coproductfurfural selling price was set to zero theethanol selling price was 1.99/gallon.At4
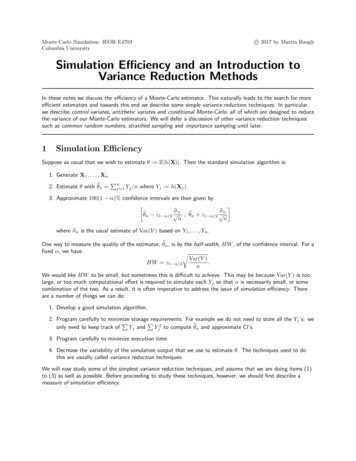
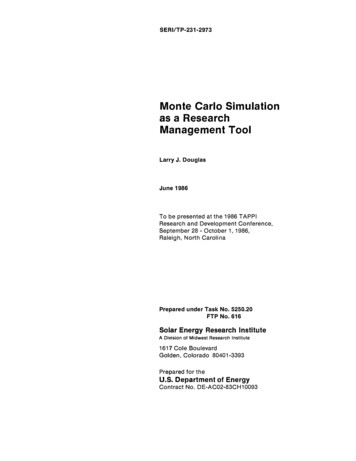
TP-29731.0reduced the selling price of the productethanol to 0. 99/gallon.The base-case pro cess configuration produces ethanol sellingfor 1. 4 1/g?llon. The progressing batch simulations were runusing five variables: reactor packing den sity, prehydrolysis temperature, hydrolysistemperature in main reactor, liquid resi dence time,andxylosefermentation toethanol.CumulativeprobabilityEthanol selling priceFigure 5.6 00800(cents IgallMonte Carlo 0.200100200Ethanol selling price400300(cents Igal lMonte Carlo Simulation,Figure 6.19851.0 mCumulativeprobabilitygacid process0.8The separate hydrolysis and fermentationsimulations were run with seven variables:percent solids in the hydrolysis reactor,enzyme loading, hydrolysis time, hydrolysisyield, xylose fermentation, enzyme produc tivity, and lignin by-product credit.0.60.40.2Figure 5 shows a comparison of the outputfrom Monte Carlo simulations for all threeprocesses in 1980, Figure 6 shows the sameprocesses in 1985, and Figure 7 shows theprojected comparison in 1990.00100200Ethanol selling priceIn 1980 there was no progressing batch pro cess and little information was available onthe then newly developed plug flow process.For the purposes of this report, the pro gressing batch process for 1980 was simulatedusing the standard percolation process as thebasis.The difference in the expectationselling price for the two acid processes in1980 was minimal; both would sell for about 2. 35/gallon.In the same time frame theexpected selling price for ethanol from theSHF process was about 6 . 80/gallon.inin0.4400Increasing the solids loading in the hydrol ysis reactor from 10% to 20% reduced theselling price of ethanol to 2. 12/gallon.Reducing the enzyme loading from 20 IU/gramof solids to 7. 5 IU/gram reduced the sellingprice of ethanol to 2. 10/gallon.Reducingthe hydrolysis time from 72 to 2 4 hours low eredtheethanolpriceto 2. redthesellingpriceofethanolto 1. 76/gallon.Increasingthehydrolysisyield to 95% reduced the price of ethanol to 2. 22/gallon.An 8X increase in the rate ofenzyme production reduces the selling priceof ethanol to 2. 23/gallon.Separating thelignin fraction of the feedstock and realiz ing a net value of 0. 07/pound coproductcredit reduces the ethanol selling price to 1. 91/gallon.The 1985 results shownsL· tethe improvement0.60.2Theeconomicperformanceof theseparatehydrolysis and fermentation enzymatic processwas found to be particularly sensitive topercent solids in the hydrolysis reactor,enzyme loading in the hydrolysis step, hy drolysis time, hydrolysis yield, enzyme pro ductivity, xylose conversion to ethanol, andlignin coproduct credit.The base-case pro cess produced ethanol at a selling price of 2. 60/gallon. acid process0.8Figure 7.300400(cents/gallMonte Carlo Simulation,1990values for all three processes.The plugflow process now is at about 1. 35/gallon andtheprogressingbatchprocessatabout 1. 50/gallon.This is a significant reduc tion compared to the 1980 values.The SHFprocess shows even a more dramatic improve ment,dropping from 6. 80/gallon to about 2. 50/gallon.By 1990 all three processes have about thesame expectation value for ethanol sellingprice, and any difference among the processesFigure 6 demon the expectation5
5- . TP-2973 I( ;. jective is not met the process will cease tobe competitive with the other approaches anddropped from further consideration.will have to be evaluated outside the para meters used to complete the Monte Carlo simu lations.In the progressing batch and separate hydrol ysis and fermentation processes t he economicscould be greatly improved with the additionof xylose fermentation to ethanol.This stepwould increase the ethanol yield by as muchas 50% to 70%.Figure 9 shows the impact ofxylose conversion on the economics of ethanolproduction for the progressing batch pro cess.If we assign a dollar figure to eachof the conversion yields and assume t hat t hiscurve i' s generated for the year 1990, thenwith no funding for research to improve xy lose fermentation we would stay at our pres ent position of no ethanol from xylose.Eachof the higher yields represents the estimatedimprovement in xylose fermentation projectedby technical experts based on three differentscenarios:budgeting 75,000/year, 150,000/year, and 3 00,000/yearforfiveyears.The argument is very convincing thatthe resulting xylose conversion yield andimpactofprocesseconomicsaredirectlycoupled to the funding level over the fiveyears of research.CONCLUS IONSThe Monte carlo simulation technique offersthe research manager a tool to monitor per formance improvement and supplement the sche dule and cost data generated by conventionalThemanagement tools such as PERT and CPM.value of t he Monte Carlo simulation in aresearch environment is that it 1) prov ides amethod for ranking competing processes, 2)couples technical improvements to the processprovides a mechanism toeconomics, and 3)determine the value of research dollars.The processes discussed above illustrate theuse of Monte Carlo simulation that produces aresult that will allow a manager to rankethanol processes according to their abilityto produce ethanol at a price c.ompetitiveIn addition, ifwith alternate approaches.t he time horizon for implementation of a newprocess is important, the ability to have asystem with time attached becomesr·ankingIn the cases above, if a plant isimportant.to be constructed in the next two or threeyears then one of the acid hydrolysis pro cesses would be preferred; however, if t henew plant was to start after 1990 all theprocesses are on equal footing and othercriteria would be used to differentiate amongthem.REFERENCESl.2.Figure 8 shows the impact of changing t hepercent solids entering the plug flow reactorfrom 12% to 18%.T his single change in tech nical performance of the hydrolysis reactorreduces the selling price of ethanol from 1.90/gallon to about 1. 45/gallon.Thistype of analysis also helps determine thedirection of future research and engineeringactivity.The development of a hydrolysisapproach and associated reactor hardware thatcan handle 20% solids is our current goal forthe plug flow acid hydrolysis process.Thesensitivi ty of t he process economics to thisparameter is so dominating that if this ob-'3.4.5.Antunes, J., and Klopp, G., "A Methodfor Performance Risk Analysis," ModelSimulation Processes, 10th Annual Pittsburgh Conference, 1979.Muglia, V.0.,"REM Management usingRisk Analysis," Proceedings, 1976 AnnualReliability and Maintainability Sympo .sium, Las Vegas,Nev., pp. 230-233.Solar Energy ResearchInstitute, FuelAlcohol Technical and Economic EvaTi:ia "tion,Draft,February1986,Golden,Colo.Badger Engineers, Inc., "Economic Feasi bility of an Acid-Based Ethanol Plant,"Subcontractto Solar EnergyResearchInstitute, Badger Engineers, Inc., OneBroadway, Cambridge, MA 021 42.Bury, K. V., Statistical Models in Ap plied Science, Chapter 2, John Wiley andSons, 1975.1.0 r---.--,--.-:::;:;:;--,.,. 1111[;:" ,-., obability0.40.40.20.2Ethanol selling price (cents/gallFigure 8. Plug Flow ReactorCarlo Simulation250PointEthanol selling price(cents/gallFigure 9. Xylose Fermentation Impactgressing Batch ReactorMonte61n·P-ro.:.:.
Monte Carlo simulation in a research environ ment is that it 1) provides a method for ranking competing processes, 2) couples tech nical improvements to the process economics, and 3) provides a mechanism to determine the value of research dollars. In this paper the Monte Carlo simulation approach is developed