Transcription
Pennock et al. BMC Medical Genomics(2019) EARCH ARTICLEOpen AccessRNA-seq from archival FFPE breast cancersamples: molecular pathway fidelity andnovel discoveryNathan D. Pennock1†, Sonali Jindal1,2†, Wesley Horton1,3†, Duanchen Sun3, Jayasri Narasimhan1, Lucia Carbone4,5,Suzanne S. Fei6, Robert Searles7, Christina A. Harrington7, Julja Burchard3, Sheila Weinmann8,Pepper Schedin1,2,9* and Zheng Xia3,10*AbstractBackground: Formalin-fixed, paraffin-embedded (FFPE) tissues for RNA-seq have advantages over fresh frozentissue including abundance and availability, connection to rich clinical data, and association with patientoutcomes. However, FFPE-derived RNA is highly degraded and chemically modified, which impacts its utilityas a faithful source for biological inquiry.Methods: True archival FFPE breast cancer cases (n 58), stored at room temperature for 2–23 years, wereutilized to identify key steps in tissue selection, RNA isolation, and library choice. Gene expression fidelity wasevaluated by comparing FFPE data to public data obtained from fresh tissues, and by employing single-gene,gene set and transcription network-based regulon analyses.Results: We report a single 10 μm section of breast tissue yields sufficient RNA for RNA-seq, and arelationship between RNA quality and block age that was not linear. We find single-gene analysis is limitingwith FFPE tissues, while targeted gene set approaches effectively distinguish ER from ER- breast cancers.Novel utilization of regulon analysis identified the transcription factor KDM4B to associate with ER disease,with KDM4B regulon activity and gene expression having prognostic significance in an independent cohort ofER cases.Conclusion: Our results, which outline a robust FFPE-RNA-seq pipeline for broad use, support utilizing FFPEtissues to address key questions in the breast cancer field, including the delineation between indolent andlife-threatening disease, biological stratification and molecular mechanisms of treatment resistance.Keywords: FFPE, Formalin fixed paraffin embedded, Breast Cancer, RNA sequencing, RNA-Seq, genomics,Archival tissue, Regulon, RNA-seq, Estrogen receptor, KDM4BBackgroundWithin oncology, the ability to rapidly characterize awhole tumor transcriptome has resulted in the increasing stratification of patient cohorts by molecular subtype. These data inform disease diagnosis, selection of* Correspondence: schedin@ohsu.edu; xiaz@ohsu.edu†Nathan D. Pennock, Sonali Jindal and Wesley Horton contributed equally tothis work.1Department of Cell, Developmental and Cancer Biology, Oregon Health &Science University, 2720 SW Moody Ave, Portland, OR 97201, USA3Computational Biology Program, Oregon Health & Science University,Portland, OR 97201, USAFull list of author information is available at the end of the articleprecision therapies, and prognosis. To date, the effortsto build molecular profiles of common malignancies,including The Cancer Genome Atlas (TCGA), utilizedfresh tumor specimens, which provide high qualityRNA analyses [1]. However, for any given cancer,only a small fraction of total cases have enough freshtissue available for unbiased exosome-level RNA expression, and further, even fewer cases associate withlong term outcomes data. For example, ER breastcancer has a 5 year survival rate of greater than 95%,but a 20–40% progression to metastasis over thecourse of 10–20 years [2–6]. To begin to address the The Author(s). 2019 Open Access This article is distributed under the terms of the Creative Commons Attribution 4.0International License (http://creativecommons.org/licenses/by/4.0/), which permits unrestricted use, distribution, andreproduction in any medium, provided you give appropriate credit to the original author(s) and the source, provide a link tothe Creative Commons license, and indicate if changes were made. The Creative Commons Public Domain Dedication o/1.0/) applies to the data made available in this article, unless otherwise stated.
Pennock et al. BMC Medical Genomics(2019) 12:195barriers of limited outcomes data, one approach is touse formalin-fixed paraffin-embedded (FFPE) tissuefor RNA sequencing, which has several advantages.First, biorepositories of FFPE tissue are maintained atall cancer care hospitals. Second, FFPE tissues can belinked to in-depth patient clinical data to create robust experimental and control groups. Third, FFPEtissue is generally archived for at least 10 years andcan thus be associated with longer-term patientoutcomes.Despite the advantages of FFPE tissues, uncertaintyabout the fidelity of FFPE RNA remains a seriouslimitation. FFPE tissue processing and sample storageare known to result in highly degraded RNA, whichlimits gene detection and introduces sequencing artifacts [7, 8]. Nonetheless, groups have made importanttechnical advances [9–12] in the analysis of patientFFPE tissues, resulting in the subdivision of patientcohorts into distinct molecular subtypes with prognostic significance [13–17]. Despite these importantadvances, concerns regarding data quality and interpretation remain, limiting the full potential of FFPEarchival specimens to advance omics-based oncologicinquiry.In this report, we define an effective FFPE-RNA-seqpipeline, identifying several key steps related to tissueselection, RNA isolation, library selection and dataanalysis. Using this optimized pipeline, we utilize truearchival FFPE breast cancer (BrCa) tissues to distinguish between ER and ER- breast cancer cases, andconfirm gene expression fidelity by comparing FFPEdata to publicly available databases obtained fromfresh tissues. Using novel analytical methodologies beyond single-gene comparisons, we identify key molecular pathways that distinguish ER and ER- breastcancers with high confidence. Further, in a proof-ofprinciple application, we identify the transcriptionalregulator KDM4B to associate positively with activeER signaling and provide prognostic significance forpatient outcomes.MethodsEthics approval and consentThe research was conducted on archived FFPE tissuesamples collected under IRB-approved protocols atUniversity of Colorado and Kaiser Permanente Centerfor Health Research. These tissue archives are comprisedof clinical samples obtained from women with invasivecancer who were receiving standard of care. For thisstudy, breast specimens from premenopausal womenaged 20–45 years were obtained under IRB approvals(OHSU IRB# 00010989, # 15361). All cases were deidentified to the research team at all points and thereforePage 2 of 18this study was considered exempt for participation consent by the participating IRBs.Sample descriptionThe obtained archival FFPE breast cancer (BrCa) tissues(n 58) had been stored at room temperature between 2and 23 years before RNA isolation was performed. Forall cases, multiple H&E slides were reviewed from eachcase by a pathologist and sections with tumor wereselected for inclusion in the study. Adjacent serialunstained sections were then submitted for RNAextraction.RNA isolationTotal RNA was extracted from recently cut 10 μm FFPEsections using the miRNeasy FFPE kit (Qiagen, Valencia,CA) according to the manufacturer’s protocol, using 1–4sections (10–40 μm) per case depending on assay. RNAyield and quality were determined by UV absorption ona NanoDrop 1000 spectrophotometer and fragment sizewas analyzed using the RNA 6000 Nano assay (AgilentTechnologies, Santa Clara, CA) run on the 2100 Bioanalyzer. DV200 values representing the percentage of RNAfragments above 200 nucleotides in length were determined according to Agilent and Illumina recommendedprotocols [18]. To determine the minimal amount of tissue needed to yield adequate RNA quantity for librarypreparation, RNA yield per 10 μm section number wastested. Based on the test results, one or two 10 μm sections of breast FFPE specimens were used for RNA isolation. RNA quality was assessed using DV200 values andcases with DV200 more than 27% were included for library preparation.Library preparation and sequencingTwo library preparation methods were tested. An input of 75 ng of total FFPE RNA was used with theTruSeq RNA Access Library Prep Kit (Illumina, SanDiego, CA) and an input of 150 ng of total FFPERNA was used with the Ovation Human FFPE RNAseq Library System (NuGEN Technologies, San Carlos, CA). Libraries were prepared in triplicate fromtwo FFPE RNA samples according to manufacturerinstructions (3 technical replicates for each sampleand method, Table 1). Libraries were quantified byreal-time PCR using KAPA Library Quantificationkits (Kapa Biosystems, Wilmington, MA) on ABIStepOne thermocycler, pooled according to librarymethod (6 libraries per lane), and sequenced on aHi-Seq 2500 (Illumina) using a 100 cycle, single endprotocol providing approximately 45 million readsper sample. Base call files were converted to fastqformat using Bcl2Fastq (Illumina). For the studies interrogating ER and ER- breast cancers, library
Pennock et al. BMC Medical Genomics(2019) 12:195Page 3 of 18Table 1 RNA-seq Sample CharacteristicsFigure:SampleYear ofDiagnosisERStatus IHCSampleTypeGEO- Accession #Figure 2: S12009PositiveFFPEGSM3737461, GSM3737462,GSM3737463,GSM3737467,GSM3737468, GSM3737469Figure 2: S22010PositiveFFPEGSM3737464, GSM3737465,GSM3737466, GSM3737470,GSM3737471, GSM3737472Figure 3-6: S12002PositiveFFPEGSM3737473, GSM3737474Figure 3-6: S22005PositiveFFPEGSM3737475, GSM3737476Figure 3-6: S32010PositiveFFPEGSM3737477Figure 3-6: S41997NegativeFFPEGSM3737478Figure 3-6: S52011NegativeFFPEGSM3737479Figure 3-6: S62009NegativeFFPEGSM3737480, GSM3737481Figure 3-6: P12000PositiveFresh-FrozenGSM1401676Figure 3-6: P22001PositiveFresh-FrozenGSM1401677Figure 3-6: P32001PositiveFresh-FrozenGSM1401678Figure 3-6: P42001PositiveFresh-FrozenGSM1401679Figure 3-6: P52001PositiveFresh-FrozenGSM1401680Figure 3-6: P62001PositiveFresh-FrozenGSM1401684Figure 3-6: P72009PositiveFresh-FrozenGSM1401713Figure 3-6: P82010PositiveFresh-FrozenGSM1401715Figure 3-6: P92002PositiveFresh-FrozenGSM1401716Figure 3-6: P102006PositiveFresh-FrozenGSM1401717Figure 3-6: P112005NegativeFresh-FrozenGSM1401719Figure 3-6: P122006NegativeFresh-FrozenGSM1401720Figure 3-6: P132003NegativeFresh-FrozenGSM1401721Figure 3-6: P142002NegativeFresh-FrozenGSM1401722Figure 3-6: P152004NegativeFresh-FrozenGSM1401724Figure 3-6: P162001NegativeFresh-FrozenGSM1401726Figure 3-6: P172009NegativeFresh-FrozenGSM1401727Figure 3-6: P182010NegativeFresh-FrozenGSM1401729Figure 3-6: P192001NegativeFresh-FrozenGSM1401733Figure 3-6: P202004NegativeFresh-FrozenGSM1401757Each sample designation is identified with relevant figures. Year of diagnosis indicates the year the specimen was collected. ER status in all cases was performedby clinical diagnostic IHC. Sample type for retrieval of RNA is indicated as either Formalin Fixed Paraffin Embedded (FFPE) or fresh tissue processed and storedfrozen (Fresh-frozen). GEO Accession number for ascribed samples is indicatedpreparations were performed using only the TruSeqRNA Access protocol with 75 ng RNA input. RNAseq libraries of six samples, ER (n 3) and ER(n 3), were generated from FFPE RNA with DV200values ranging from 27 to 44%. Libraries were quantified as described and pooled at 3 libraries per lane.Sequencing was performed on a Hi-Seq 2500 using a100 cycle, single read protocol with a depth of approximately 90 million reads per sample. Followinginitial sequencing, 3 of the 6 libraries were repooledand independently sequenced. Base call files wereconverted to fastq format using Bcl2Fastq (Illumina).Public dataA total of 20 fresh samples (10 ER and 10 ER-) wereselected from Varley et al. [19] (GEO accessionGSE58135, Table 1, P1–20).
Pennock et al. BMC Medical Genomics(2019) 12:195RNA sequence alignmentAll RNA-seq reads were aligned to the human referencegenome (GRCh38, release 84) using STAR (version 2.5.2b)[20]. The STAR “GeneCounts” module was used for genequantification, with the resulting strand counts chosendepending upon library preparation (Access – reverse;Ovation – forward; public – unstranded). Soft-clippingand mismatch tolerance were modified to evaluate thebest possible alignment (see results), with default parameters ultimately chosen.Page 4 of 18resequenced samples, using all genes output by DESeq2.VST gene expressions were filtered for top 100 differentially expressed (DE) genes or defined genes ranked byadjusted p-values. Filtered genes were plotted using‘pheatmap’ [22] and samples were clustered using defaultEuclidean distance.BrCa subtype predictionTumor biologic subtypes (Luminal A, Luminal B, Basal,HER2) were predicted using the PAM50 prediction parameters as determined by Parker et al. [23].Data processing and significance testingSTAR read counts were used as input into DESeq2 [21].Genes with counts per million (cpm) greater than 0.05in three or more cases were kept for subsequent differential expression gene (DEG) analyses. DEG analysis wasperformed with ER status as the variable of interest andDEG were called based upon a false discovery rate(FDR) less than 0.05. A log 2 fold-change threshold of 1was also set. After normalization analyses, counts weretransformed using the variance-stabilizing transformation (VST) module in DESeq2 for downstreamanalyses.Gene selection for fresh vs. FFPE comparisonWe subset FFPE samples for protein-coding genes witha cpm greater than 1 in at least 3 cases, resulting in 13,807 genes. Fresh samples were filtered for these exactgenes. All data were combined together and run throughDESeq2 with ER status as the variable of interest with alog 2 fold-change threshold of 1, as well as kept separately (e.g. all fresh samples only) and subjected to thesame analysis. In addition, all ER cases were groupedtogether and DESeq2 was performed with sample typeas the variable of interest, with the same done for ERcases.Access vs. Ovation library comparisonCounts output by STAR were normalized using a varietyof different methods. Genes with Access-identifiedprobes and counts per million (cpm) greater than 1 in50% of samples from at least one library preparationmethod (14,432 genes) were selected for visualizations.ER vs. ER-: Genes with Access-identified probes andcounts per million (cpm) greater than 1 in 50% of eitherFFPE or fresh-frozen samples (14,331 genes) were selectedfor analysis. Differential expression analysis was performedusing DESeq2 [21] with ER status as the factor of interest.Counts adjusted via the variance-stabilizing transformation were utilized for subsequent visualizations.Sample-to-sample distancesEuclidean distance, using ‘dist’ in R, was calculated basedon the VST gene expressions to produce an aggregatesample-to-sample distance matrix. To assess global similarity of FFPE and fresh-frozen gene expression profiles,pairwise Pearson correlations between all samples werevisualized using the ‘pheatmap’ R package [22]. Dendrograms were created using complete clustering of the Euclidean distances between the resulting correlations.Additionally, Principal Component Analysis (PCA) wasalso performed on all genes using the ‘plotPCA’ functionof the DESeq2 package, with ER status as the variable ofinterest. Principal component analysis (PCA) was performed on VST gene expression values using default parameters. Non-negative matrix factorization (NMF)clustering was used to cluster the original andCancer set HeatmapsTo assess the ability of previously reported cancer genesets to distinguished cohorts, transformed counts weresubset for all matching genes from the Oncotype DX,MammaPrint, and PAM50 gene sets. Gene expressiondata were z-score transformed for each gene forvisualization purposes. Dendrograms were producedusing complete clustering of the pairwise Pearson correlation values. Pearson correlation was calculated on rawvalues for the Oncotype DX and MammaPrint subsets,and z-score transformed values for the PAM50 subset,in accordance with the methodology of each gene set’sconstruction. For PAM50, subtypes as well as proliferation, ER, and HER2 scores were generated using the original prediction parameters determined by Parker et al.[23].Gene set enrichment analysis (GSEA)GSEA version 3.0 was used to identify gene sets fromthe Hallmark database (v6.1, ‘h.all.v6.1.symbols.gmt’) aswell as custom gene sets (described below) that weresignificantly enriched between ER and ER- cases or between sample storage methods. When testing for differences between ER status, FFPE and fresh-frozen sampleswere individually divided by ER phenotype and queriedagainst reference sets. When testing for differences between sample storage methods, all samples were dividedby storage method and queried against reference sets.Custom gene sets were created by determining genes
Pennock et al. BMC Medical Genomics(2019) 12:195that were unique or commonly identified as statisticallysignificant (p 0.05, Fisher’s exact test using all inputgenes (14,330) as background results in p 2.2e-16)differentially expressed genes between ER (red) andER- (blue) samples from FFPE or fresh specimens(Fig. 5).Regulon analysisWe used the master regulator inference algorithm(MARINa) [24] compiled in R ‘viper’ package [25] toperform the regulon analyses on breast cancers fromFFPE tissue and the publicly available fresh-frozen datasets, respectively. Two sources of data, gene expressionsignature and regulatory network, were required asmodel inputs. In this work, the Wald test statistics inDESeq2 that quantify the difference of ER and ERwere used as gene expression signatures. As for regulatory network, we directly used the published breastcancer regulon network ‘regulonbrca’ curated in R package ‘aracne.networks’ that was reverse-engineered byARACNe [25, 26] using TCGA breast cancer data [27].The single-sample-based regulon activities were inferred by function ‘viper’, which is an extension of MARINa [24] and transforms a gene expression matrix to aregulatory protein activity matrix. For the model input,we used the fragments per kilobase of transcript per million (FPKM) quantification of breast cancer samples inTCGA as the expression matrix and the same regulonnetwork ‘regulonbrca’ as the regulatory network.TCGA – Breast Cancer Kaplan-Meier analysisThe key genes/transcription factors determined fromBrCa regulon analyses were selected as genes of interestfor determination of gene expression or regulon activitycorrelation with survival outcome. Kaplan-Meier plotswere produced by downloading TCGA outcomes, cohortmetadata and gene expression data through the UCSCXena Functional Genomics Browser [28] tool, whichwere then plotted in GraphPad Prism Software (v7.05,La Jolla California, USA) and the numbers of samples indicated in brackets for gene expression Hi (red) and Lo(blue) cohorts with p-values displayed determined bylog-rank analysis.ResultsAssessing the amount of FFPE tissue needed for adequateRNA extractionWhile FFPE tissues are more abundant than fresh tumortissue, these archival tissues still represent a limited resource that require judicious utilization. Thus, we initially set out to determine the minimum amount ofFFPE breast tissue that will yield the quality and quantityof RNA needed for successful sequencing. Many protocols developed for extracting RNA from FFPE blocksPage 5 of 18suggest utilizing 40 micrometers (μm) of tissue, anamount that is 10 times greater than what is requiredfor immunohistochemistry (IHC) evaluation. We firstexamined the influence of the number of 10 μm sectionson overall RNA yield. 1, 2, 3 or 4 10 μm serial sectionswere used to isolate RNA from 5 separate FFPE breastcancer cases (Fig. 1a). In general, sufficient yield was obtained with a single 10 μm section, with no increasedyield observed with the inclusion of additional sections.These observations strongly suggest that RNA isolationis saturated in capacity to capture RNA at 10 μm ofFFPE breast tissue. Further, in 4 of 5 cases evaluated, theamount of RNA from a single 10 μm section was in vastexcess of the 100 ng required for RNA sequencing(Fig. 1a, 100 ng level denoted by red line).We next evaluated the quality of the isolated RNA asassessed by DV200 value. The DV200 value reports thepercentage of purified RNA with length greater than orequal to 200 nucleotide bases. As a useful predictor ofsuccessful sequencing results, a DV200 value of greaterthan or equal to 30% (Fig. 1b, red line) is recommendedby manufacturers for FFPE library preparations. Of these5 test cases, only 3 had RNA of sufficient quality required for RNA sequencing. Further, inclusion of additional sections had no impact on DV200 value (Fig. 1b).To investigate the impact of FFPE processing on theintra-case variability of RNA yield and quality, serial10 μm sections of 6 cases were processed in 2 independent runs. Analysis revealed consistent inter-run valueswith 8% variation, data consistent with FFPE tissuesbeing a reproducible source for RNA material (Additional file 1: Figure S1a and b). We next ascertained therelationship between age of block and RNA quality using58 cases of breast cancer FFPE samples collected between 1992 and 2014. We found a drop in quality incases greater than 11 years old (cases diagnosed before2006) (Fig. 1c), with only 13% (3 of 23) of these oldercases having a DV200 30% (Fig. 1c, red line). However,for the blocks 10 years of age, 82% (18 of 22) of caseshad DV200 values greater than 30%. Further, we foundevidence for possible variation in quality due to the specific institutional repository (green vs. blue circles), emphasizing the need to use empirical determination forblock quality rather than relying on simple age metrics.Further, in this larger data set of 58 cases, we confirmedlack of correlation between DV200 and RNA yield(Fig. 1d).To examine if RNA yield correlates with cellularcomposition (tumor area), sections were quantifiedfor epithelial tumor content. A clear positive relationship emerged (Fig. 1e), with cellular content being thedominant determinant of RNA yield. Given this, weassessed the utility of extracting RNA from 10 μmbiopsy sections compared to 10 -μm sections of
Pennock et al. BMC Medical Genomics(2019) 12:195Page 6 of 18Fig. 1 RNA quantity and quality are impacted by epithelial area and block age. a) Five separate archival FFPE blocks (each a different color andsymbol) of breast cancer tissue were subjected to RNA isolation from 10 to 40 μm of tissue and evaluated for overall RNA yield and b) RNAquality determined by DV200 value. c) 58 archival breast cancer tissues from two different repositories (indicated by green and blue dots) weresubjected to RNA isolation from one 10 μm section and evaluated for the relationship between DV200 and year of collection, (black line is best fitline using a centered fourth order polynomial) and d) overall RNA yield. e) Epithelial area and f) specimen type compared to yield. Red lines at100 ng and DV200 30 denote recommended minimal technical limits for successful sequencingsurgically excised tissue, as utilization of biopsy material could greatly expand patient numbers and scopeof research questions compared to surgical excisionalone. Of the 5 biopsy samples with high DV200 ( 30%) all samples except one provided 100 ng ofRNA required for advancement to sequencing (Fig. 1f,red line). In sum, these analyses confirm that single10 μm FFPE sections of biopsies or surgical samplesare suitable for advancing to RNA-sequencing.Library Preparation & Data NormalizationGiven the highly fragmented and chemically modifiedproperties of the input RNA from FFPE sources, we nextevaluated the impact of library preparation on resultinggene expression profiles. We tested Illumina-Access andNuGEN–Ovation platforms, both useful library preparation methods for FFPE samples, which differ in howRNA is enriched and amplified. The Access kit is basedupon biased, selective hybridization and enrichment ofRNA using bead-conjugated oligomers designed for 19,000 genes with 10 different probes per gene. In contrast, the Ovation platform adopts an unbiased targetingapproach utilizing both Poly A and random primerhybridization, resulting in a product with reduced ribosomal content and a more highly diverse RNA transcriptlibrary.
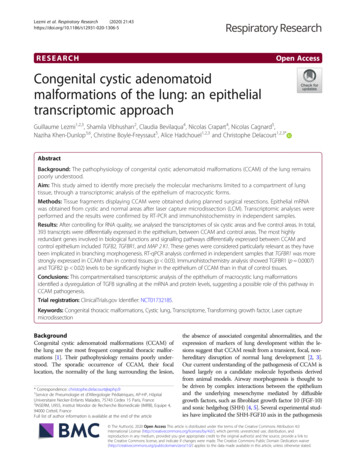
Pennock et al. BMC Medical Genomics(2019) 12:195Page 7 of 18Fig. 2 Evaluation of FFPE library preparations and data normalization approaches. a) Two FFPE samples (S1-orange, S2-green) were each preparedusing two different commercial library preparations (NuGEN-Ovation-blue, Illumina-Access-black) in triplicate and sequenced by a Illumina Hi-Seq2500 sequencer. Disparate library methodologies (Ovation (Ova-red and purple)), Access (Acc-orange and green)) resulted in clear differences inb) average raw counts per gene. Results of both libraries were subjected separately to c) Loess and VST, and d) quantile and q-spline datanormalization approaches. VST normalization was selected based upon equal performance in both libraries across the range of reads anddemonstrated success in e) normalization of average counts per gene in both libraries. f) Unsupervised hierarchical clustering of (14,432)normalized gene counts from S1 and S2 samples in triplicate reveals highest level of sample separation based upon library preparation (blue andblack), followed by sample source. The 500 genes with the highest overall mean expression are shown. g) Library-based variation was assessedby plotting the coefficient of variation (CV) from triplicate samples for each gene for each library preparation (S1-orange, S2-green). Average % CVand standard deviation of CV is presented along corresponding axes. 20% CV is indicated by red dashed lines.To compare these two library preparation platforms,two separate ER breast cancer FFPE biological samples (S1 and S2), each with a DV200 value 30% wererun in triplicate using both library preparation platforms (Fig. 2a). Sequencing reads from the Access kitprovided higher counts per gene (Fig. 2b), but fewerrelative numbers of unique reads compared to the Ovation kit (Additional file 1: Figure S1c and d). The Access kit data also lacked entire gene families, includingmitochondrial RNA. We reasoned this loss occurred asa result of the Access kit being hybridization-based tooligos selected a priori for the included genes. Forsubsequent comparative analyses related to platformsensitivity and consistency, we focused on genes detected by both platforms, and next sought to compareread normalization approaches.We compared 5 distinct normalization approaches,and the importance of considering normalizationmethodologies became apparent. Some methodologies,i.e., Loess, VST (Fig. 2c) and Limma (Additional file 1:Figure S1e and f) maintained the linear relationshipbetween the raw and transformed values in both library platforms, while other approaches, i.e., quantileand q-spline, distorted raw values to normalized
Pennock et al. BMC Medical Genomics(2019) 12:195values based upon library methodology (Fig. 2d). Ofthe normalization approaches that produced tight andlinear normalization to raw values, we elected to useVST normalization, as it is widely utilized as part ofthe DESeq2 analysis package where additional analytical tools are available. Using VST normalization, weconfirmed comparable distributions of reads per gene foreach of the 2 library preparation methodologies (Fig. 2e),highlighting the suitability of VST normalization for library performance comparison.Next we performed unsupervised hierarchical clusteringof these VST normalized gene counts and showedIllumina-Access and NuGEN–Ovation platforms clusteredsample repeats together (S1-orange vs. S2-green) (Fig. 2f).Importantly, the first branch of the clustering dendrogramis driven by library preparation platform (blue vs. black),demonstrating that library preparation is a greater driver ofgene expression differences than sample identity (S1 vs. S2).Given the aforementioned differences in library construction, this result is not surprising.Having demonstrated the utility of both platforms togenerate reproducible gene expression data from FFPEsamples, we assessed which platform is most beneficialfor our questions related to distinguishing differentialgene expression between study groups (in this case,between S1 and S2). For a gene to be differentiallyexpressed between groups, both the change in the magnitude and the degree of variability in gene expressionneed to be considered. Our experimental design of 2 independent samples assayed in triplicate is well suited fordetermining relative library variability. By plotting thecoefficient of variation for each gene from one platformcompared to the other, we observed that the Accessplatform displayed reduced variability with 11.1% of allgenes examined with a coefficient of variation (CV) ofgreater than 20% (Fig. 2g, red dashed lines), compared to23.2% in the Ovation platform. Less variance combinedwith higher raw read counts lead us to select the Accesslibrary platform for our subsequent FFPE RNA-seq pipeline optimization.Alignment parameter optimization for FFPE RNA-seqFFPE processing results in fragmented RNA and chemically altered residues that can lead to sequence alterations and read misalignment, leading to reducedaligned read counts [8, 29]. In an attempt to mitigate theimpact of these artifacts, we addressed approaches topositively impact the number of mapped reads fromFFPE-derived sequences to the reference genome. Forthese analyses, we used FFPE-derived sequences obtained from 3 ER [1–3] and 3 ER- [4–6] breast cancercases, and compared soft-clipping as well as various mismatch allowances (Fig. 3a, left panel). For mismatch allowance, we adjusted mismatch parameters to increasePage 8 of 18the permitted number of imperfect nucleic acid residuealignments, which as anticipated, progressively in
RESEARCH ARTICLE Open Access RNA-seq from archival FFPE breast cancer samples: molecular pathway fidelity and novel discovery Nathan D. Pennock1†, Sonali Jindal1,2†, Wesley Horton1,3†, Duanchen Sun3, Jayasri Narasimhan1, Lucia Carbone4,5, Suzanne S. Fei6, Robert Searles7, Christina A. Harrington7, Julja Burchard3, Sheila Weinmann8, Pepper Schedin1,2,9* and Zheng Xia3,10*