Transcription
Xu et al. Genome Biology(2022) ORT REPORTOpen AccessComprehensive benchmarking of CITE-seqversus DOGMA-seq single cell multimodalomicsZhongli Xu1,2, Elisa Heidrich-O’Hare3, Wei Chen1,4* and Richard H. Duerr3,5** Correspondence: wec47@pitt.edu;duerr@pitt.edu1Department of Pediatrics,University of Pittsburgh School ofMedicine, UPMC Children’s Hospitalof Pittsburgh, 4401 Penn Ave,Pittsburgh, PA 15224, USA3Department of Medicine, Universityof Pittsburgh School of Medicine,3550 Terrace Street, Pittsburgh, PA15261, USAFull list of author information isavailable at the end of the articleAbstractThe recently developed method TEA-seq and similar DOGMA-seq single cell trimodalomics assays provide unprecedented opportunities for understanding cell biology,but independent evaluation is lacking. We explore the utility of DOGMA-seqcompared to the bimodal CITE-seq assay in activated and stimulated humanperipheral blood T cells. We find that single cell trimodal omics measurements afterdigitonin (DIG) permeabilization were generally better than after an alternative “lowloss lysis” (LLL) permeabilization condition. Next, we find that DOGMA-seq withoptimized DIG permeabilization and its ATAC library provides more information,although its mRNA and cell surface protein libraries have slightly inferior quality,compared to CITE-seq.BackgroundMassively parallel single cell omic measurements have advanced from single modalmeasurement of transcriptomes alone; to bimodal, simultaneous transcriptome and cellsurface protein epitope measurements (CITE-seq [1] and REAP-seq [2]), transcriptomeand chromatin accessibility measurements (sci-CAR [3], SNARE-seq [4], SHARE-seq[5]), and chromatin accessibility and cell surface protein epitope measurements(ASAP-seq [6] and ICICLE-seq [7]); to trimodal, simultaneous transcriptome, cell surface protein epitope, and chromatin accessibility measurements (DOGMA-seq [6] andTEA-seq [7]). DOGMA-seq and its sibling technique TEA-seq provide unprecedentedopportunities to study complex cellular and molecular processes at single cell resolution, but a comprehensive independent evaluation is needed to compare these newtrimodal assays to existing single modal and bimodal assays. In this study, we benchmarked and compared DOGMA-seq under two permeabilization conditions, as well asDOGMA-seq versus CITE-seq, using aliquots of the same ex vivo tissue culture activated and stimulated human peripheral blood T cell populations. The Author(s). 2022 Open Access This article is licensed under a Creative Commons Attribution 4.0 International License, whichpermits use, sharing, adaptation, distribution and reproduction in any medium or format, as long as you give appropriate credit tothe original author(s) and the source, provide a link to the Creative Commons licence, and indicate if changes were made. Theimages or other third party material in this article are included in the article's Creative Commons licence, unless indicated otherwisein a credit line to the material. If material is not included in the article's Creative Commons licence and your intended use is notpermitted by statutory regulation or exceeds the permitted use, you will need to obtain permission directly from the copyrightholder. To view a copy of this licence, visit http://creativecommons.org/licenses/by/4.0/. The Creative Commons Public DomainDedication waiver ) applies to the data made available in this article, unlessotherwise stated in a credit line to the data.
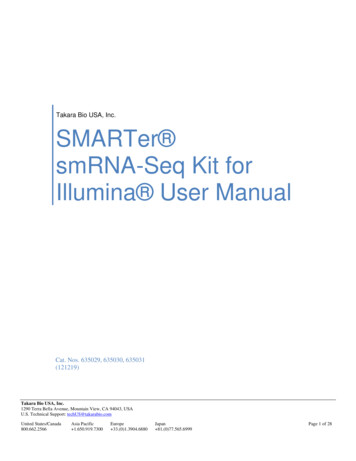
Xu et al. Genome Biology(2022) 23:135Results and discussionThe DOGMA-seq and TEA-seq protocols require a cell permeabilization step followinghashtag oligonucleotide (HTO) [8] and cell surface protein epitope antibody-derivedtag (ADT) [1] labeling to enable preparation of its assay for transposase-accessiblechromatin (ATAC) library. Alternative cell permeabilization conditions using eitherdigitonin (DIG) or paraformaldehyde fixation with “low-loss lysis” (LLL) were introduced with the development of the DOGMA-seq [6] and TEA-seq [7] assays. Theoretically, DIG permeabilization is milder and will not lyse mitochondrial membranes,because it interacts with cholesterol, and the plasma membrane has a higher cholesterolcontent compared to the mitochondrial membrane [9]. We optimized the DIG condition used by TEA-seq developers [7], where cells were incubated with 0.01% DIG onice for 5 min (min), and identified an optimal incubation time and concentration ofDIG for permeabilization of peripheral blood mononuclear cells (PBMCs). We had previously determined that incubation with 0.01% DIG for 1 min was sufficient topermeabilize all cells based on acridine orange and propidium iodide (AOPI) staining.We then proceeded to test several dilutions of DIG (0.0025%, 0.005%, 0.0075%, and0.01%) and found that incubation with 0.0075% DIG for 1 min was an optimalpermeabilization condition, since 99.5% of the cells treated with 0.0075% DIG showedred fluorescence indicative of propidium iodide entry into cells with compromisedmembranes, but lesser concentrations of DIG resulted in lower proportions of permeabilized cells.Next, we evaluated single cell trimodal omics measurements after our optimized DIGpermeabilization condition compared to the alternative LLL condition (Fig. 1A). We collected PBMC from a healthy donor, enriched untouched T cells, activated and stimulatedthem under four different ex vivo tissue culture conditions, and then split each cell population into DIG and LLL permeabilization groups. Quality control metric comparisons between the two permeabilization groups are shown in the figures (Fig. 1B–I). The numberof genes detected per cell and TSS enrichment scores are similar after DIG and LLLpermeabilization, while DIG resulted in higher protein tag complexity and fraction ofmtRNA but a lower fraction of mtDNA. These observations were consistent with thosereported by DOGMA-seq developers [6]. However, we observed higher ATAC complexitybut a lower fraction of unique molecular identifiers (UMIs) mapping to exons after DIGpermeabilization, in contrast with the reported observations [6].We calculated the fraction of cells with UMIs 0 for all 163 protein tags in the TotalSeq -A Human Universal Cocktail, V1.0 (BioLegend) to evaluate protein tag detectionrate. As expected, we found higher detection rates for all 163 protein tags after DIGpermeabilization (Fig. 1J), which is consistent with better preservation of the plasmamembrane and cell surface proteins after DIG permeabilization. However, the differences in cell surface protein detection between the two permeabilization conditions didnot attenuate differential protein tag signals upon differential stimulations at thepseudo-bulk level. For example, when we compared two groups of T cells that wereboth activated and cultured with IL-1β and IL-23, and one of the two groups was alsocultured with prostaglandin E2 (PGE2), we found high correlation of differential protein tag signals between the two permeabilization conditions (Fig. 1K).To evaluate gene detection rates, we calculated the fraction of cells with UMIs 0 forall 36,601 genes in the reference genome and found slightly higher detection rates forPage 2 of 17
Xu et al. Genome Biology(2022) 23:135Fig. 1 (See legend on next page.)Page 3 of 17
Xu et al. Genome Biology(2022) 23:135(See figure on previous page.)Fig. 1 Comparison between DIG and LLL conditions. A Overview of study design for comparison betweenDIG and LLL conditions. Each of four aliquots of T cells from a human donor were activated and stimulatedunder a different stimulation condition (total of four stimulation conditions in four tissue culture wells) in a12-h tissue culture. Each of two aliquots of cells from each of the four tissue culture wells were thenlabeled with a unique hashtag (total of eight unique hashtags). Approximately equal numbers of the eightuniquely hashtagged cell populations were then pooled and labeled with antibody cocktail. An aliquot ofthe hashtag- and antibody cocktail-labeled pool of cells was permeabilized with DIG, and another aliquot ofthe hashtag- and antibody cocktail-labeled pool of cells was permeabilized with LLL prior to thesubsequent DOGMA-seq library preparation steps. B–H Boxplot showing quality control metric comparisonsbetween DIG and LLL conditions. Median values are indicated with corresponding colors. B Protein tagcomplexity per cell. Median ratio 2.30. C ATAC fragment complexity per cell. Median ratio 5.67. DPercentage of ATAC fragments mapped to mtDNA per cell. Median ratio 0.01. E Number of genes percell. Median ratio 0.96. F Percentage of UMIs mapped to mtRNA per cell. Median ratio 1.88. GPercentage of UMIs mapped to exons per cell. Median ratio 0.71. H Percentage of UMIs mapped to exonsper cell, excluding those mapped to mtRNA. Median ratio 0.65. I TSS enrichment scores over distancefrom TSS. Maximum values are indicated with corresponding colors. J Pairwise comparison of protein tagdetection frequencies under LLL (x-axis) and DIG (y-axis) conditions. Each point represents a single proteintag. Blue points highlight isotype control protein tags. Grey points are all other protein tags. K Correlationof protein tag fold change (log2) under DIG and LLL conditions in two groups of T cells that were bothactivated and cultured with IL-1β and IL-23, and one of the two groups was also cultured with PGE2. Topupregulated protein tags are highlighted in red; downregulated protein tags are highlighted in blue. LPairwise comparison of gene detection frequencies under LLL (x-axis) and DIG (y-axis) conditions. Eachpoint represents a single gene. Blue points highlight ribosomal protein genes (RPL/S); red points highlightmitochondrial genes (MT-). Grey points are all other genes. M Correlation of gene fold change (log2) underDIG and LLL conditions in two groups of T cells that were both activated and cultured with IL-1β and IL-23,and one of the two groups was also cultured with PGE2. Top upregulated genes are highlighted in red;downregulated genes are highlighted in blue. N (i) “Harmonized” 3WNN UMAP plot showing clustersidentified in 3WNN clustering of DOGMA-seq data under DIG condition. (ii) “Harmonized” 3WNN UMAP plotshowing cell types predicted after projection into the Azimuth PBMC reference. O (i) “Harmonized” 3WNNUMAP plot showing clusters identified in 3WNN clustering of DOGMA-seq data under LLL condition. (ii)“Harmonized” 3WNN UMAP plot showing cell types predicted after projection into the Azimuth PBMCreference. P Line plots showing average ROGUE (purity of identified clusters) for clustering based on 3WNN,RNA, ADT, and ATAC spaces, with resolution ranging from 0.02 to 0.3. Number of clusters identified in eachclustering was labeled. Q Bar plot show that proportions of predicted cell types in DOGMA-seq data underDIG and LLL conditions are quite similar. R, S “Harmonized” 3WNN UMAP plots highlight canonical markersfor Th17 cells in DOGMA-seq data. ATAC marker is motif activity (the deviations in chromatin accessibilityacross the set of regions related to the motif) calculated from ATAC-seq peaks. R Under DIG condition.Cluster 1 in Fig. 1Ni is enriched for Th17 cells based on CCR4 ADT, CCR6 ADT, and RORC ATAC signals. SUnder LLL condition. Cluster 1 in Fig. 1Oi is enriched for Th17 cells based on CCR4 ADT, CCR6 ADT, andRORC ATAC signals.some genes after LLL permeabilization (Fig. 1L). By default, the RNA sequencing readsfrom DOGMA-seq libraries were aligned to both exons and introns by cellranger-arccount. We also aligned RNA sequencing reads from both conditions to exons only orintrons only and found that LLL outperformed DIG in gene detection rates when RNAsequencing reads were aligned to exons only (Additional file 1: Fig. S1D), but their performances were similar when the reads were aligned to introns only (Additional file 1:Fig. S1E). To further investigate the difference in gene detection rates, we calculatedthe proportion of exonic UMIs for each gene and dichotomized genes into exondominated genes (genes with proportion of exonic UMIs 0.5) and intron-dominatedgenes (genes with proportion of exonic UMIs 0.5), for DIG and LLL (Additional file1: Fig. S1A-B). We found that genes defined as exon-dominated genes under both conditions had the largest increases in gene detection rates for LLL compared to DIG,whereas genes defined as intron-dominated genes under both conditions had the smallest differences (Additional file 1: Fig. S1C), suggesting that the differences in gene detection rates may be primarily due to differential detection of cytoplasmic genes. WePage 4 of 17
Xu et al. Genome Biology(2022) 23:135also found that gene fold changes with the addition of PGE2 to the cultures were highlycorrelated between the two permeabilization conditions at the pseudo-bulk level (Fig.1M). Additionally, we estimated the ambient RNA contamination rate for each cellunder DIG and LLL cell permeabilization conditions using DecontX [10], and we foundthat DIG had a lower contamination rate than LLL (Additional file 1: Fig. S1G), suggesting that the plasma membrane was more intact after DIG. We also used the decontaminated RNA count matrices (generated by DecontX) to calculate gene detectionrates but found no difference (Additional file 1: Fig. S1H). We re-defined gene detection rates as the fraction of cells with UMIs 1 to reduce the impact of genes with onlyone copy, which is not common for synthesized RNA. The differences in gene detectionrates between DIG and LLL were smaller (Additional file 1: Fig. S1I) and decreased further when they were based on decontaminated RNA count matrices (Additional file 1:Fig. S1J), except for RPL/RPS genes. Based on these findings, we inferred that DIG andLLL have little difference in true gene detection rates for the majority of biologicallymeaningful genes, and that the higher observed gene detection rates in LLL were likelydue to RPL/RPS genes and ambient RNA leaked from cytoplasm.We next assessed DIG and LLL qualitatively by cluster analysis with a series of resolutions, ranging from 0.02 to 0.3. For both conditions, we performed clustering usingRNA, ADT, and ATAC data separately. We also performed trimodal weighted nearestneighbor [11] (3WNN) analysis to leverage all three types of data. The clusters identified in each cluster analysis with resolution 0.2 are shown (Additional file 1: Fig.S1Ki-iv, Li-iv). To assess their performance, we calculated an entropy-based statistic,ROGUE [12], for each cluster analysis, which is a measurement of the purity of identified clusters. We found that DIG had higher average ROGUE (higher purity of identified clusters) than LLL, given similar resolution or number of clusters, when clusteringbased on ADT and ATAC spaces. However, DIG and LLL had comparable averageROGUE, given similar resolution or number of clusters, when clustering based on3WNN and RNA spaces (Fig. 1P). These findings are consistent with our observationthat DIG had higher quality ADT and ATAC libraries than LLL. To better visualizeclusters identified in 3WNN analysis (resolution 0.2) for DIG and LLL, we utilized allthree types of data to perform embedding correction using Harmony (Fig. 1Ni, Oi) [13]and performed automatic cell annotation based on RNA data, using the AzimuthPBMC reference (Fig. 1Nii, Oii )[11]. In a head-to-head comparison, the proportions ofpredicted cell types were quite similar between DIG and LLL (Fig. 1Q, Additional file1: Fig. S1F). Leveraging ATAC data, we can also locate clusters enriched for Th17 (Fig.1R-S) and Th1 cells (Additional file 1: Fig. S1M-N) under both conditions, highlightingthe value that the ATAC library of DOGMA-seq adds to transcriptome and ADT libraries for the study of lineage-specific T helper cells. Considering all of these observations, we conclude that DIG is the preferred DOGMA-seq cell permeabilizationmethod.To further investigate the information that DOGMA-seq provides, we performed ahead-to-head comparison of DOGMA-seq with our optimized DIG permeabilizationcondition to CITE-seq (Fig. 2A). We collected PBMC from two healthy donors,enriched untouched T cells, activated and stimulated them under four different ex vivotissue culture conditions. After the stimulation experiment, the cells were subjected toCITE-seq and DOGMA-seq, respectively. Using either assay, we observed comparablePage 5 of 17
Xu et al. Genome Biology(2022) 23:135Fig. 2 (See legend on next page.)Page 6 of 17
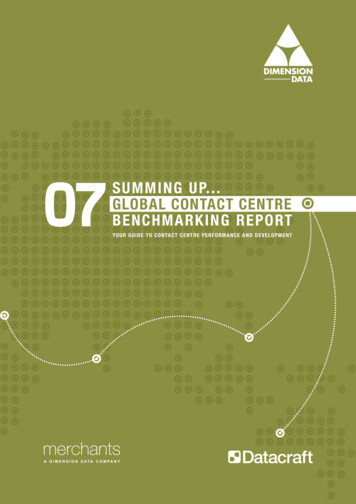
Xu et al. Genome Biology(2022) 23:135(See figure on previous page.)Fig. 2 Comparison between CITE-seq and DOGMA-seq. A Overview of study design for comparisonbetween CITE-seq and DOGMA-seq. Each of four aliquots of T cells from two human donors were activatedand stimulated under a different stimulation condition (total of four stimulation conditions in eight tissueculture wells) in a 12-h tissue culture. The cells from each of the eight tissue culture wells were thenlabeled with a unique hashtag (total of eight unique hashtags). Approximately equal numbers of the eightuniquely hashtagged cell populations were then pooled and labeled with antibody cocktail. Differentaliquots of the hashtag- and antibody cocktail-labeled pool of cells then underwent either CITE-seq orDOGMA-seq with DIG library preparation. B–D Boxplot showing quality control metric comparisonsbetween CITE-seq and DOGMA-seq. Median values are indicated with corresponding colors. B Protein tagcomplexity per cell. Median ratio 0.90. C Number of genes per cell. Median ratio 1.11. D Percentage ofUMIs mapped to mtRNA per cell. Median ratio 0.84. E Pairwise comparison of protein tag detectionfrequencies in CITE-seq (x-axis) and DOGMA-seq (y-axis). Each point represents a single protein tag. Bluepoints highlight isotype control protein tags. Grey points are all other protein tags. F (i) Correlation ofprotein tag fold change (log2) as detected by CITE-seq and DOGMA-seq in two groups of T cells fromdonor SB775372 that were both activated and cultured with IL-1β and IL-23, and one of the two groupswas also cultured with PGE2. Top upregulated protein tags are highlighted in red; downregulated proteintags are highlighted in blue. (ii) in samples from donor SB775393, as (i). G Pairwise comparison of genedetection frequencies in CITE-seq (x-axis) and DOGMA-seq (y-axis). Each point represents a single gene. Bluepoints highlight exon-dominated genes; red points highlight intron-dominated genes. An exon-dominatedgene is defined as a gene with proportion of exonic UMIs (DOGMA-seq) 0.5. An intron-dominated gene isdefined as a gene with proportion of exonic UMIs (DOGMA-seq) 0.5. NA means proportion of exonicUMIs is not available. H (i) Correlation of gene fold change (log2) as detected by CITE-seq and DOGMA-seqin two groups of T cells from donor SB775372 that were both activated and cultured with IL-1β and IL-23,and one of the two groups was also cultured with PGE2. Selected intron-dominated genes are highlightedin red; selected exon-dominated genes are highlighted in blue. (ii) in samples from donor SB775393, as (i). I(i) “Harmonized” 2WNN UMAP plot showing clusters identified in 3WNN clustering of DOGMA-seq data. (ii)“Harmonized” 2WNN UMAP plot showing cell types predicted after projection into the Azimuth PBMCreference. J (i) “Harmonized” 2WNN UMAP plot showing clusters identified in 2WNN clustering of CITE-seqdata. (ii) “Harmonized” 2WNN UMAP plot showing cell types predicted after projection into the AzimuthPBMC reference. K Line plots showing average ROGUE (purity of identified clusters) for clustering based on3WNN/2WNN, RNA, and ADT spaces, with resolution ranging from 0.02 to 0.3. Number of clusters identifiedin each clustering was labeled. L Bar plots show that proportions of predicted cell types in DOGMA-seq andCITE-seq data are quite similar. M “Harmonized” 2WNN UMAP plots highlighting canonical markers for Th17cells in DOGMA-seq data. ATAC marker is motif activity (the deviations in chromatin accessibility across theset of regions related to the motif) calculated from ATAC-seq peaks. Cluster 5 in Fig. 2Ii is enriched for Th17cells based on CCR4 ADT, CCR6 ADT, and RORC ATAC signals. N “Harmonized” 2WNN UMAP plots highlightcanonical markers for Th17 cells in CITE-seq dataquality control metrics for protein tag complexity, genes detected, and the fraction ofmtRNA (Fig. 2B–D). The observations remained unchanged even when the donor difference was considered (Additional file 1: Fig. S2A-C).To evaluate protein tag detection rates, we calculated the fraction of cells with UMIs 0 for all 163 protein tags in the TotalSeq -A Human Universal Cocktail, V1.0 andperformed a pairwise comparison. As expected, we found that the protein tag detectionrates of DOGMA-seq were lower in most cases (Fig. 2E), probably due to cell surfaceprotein and/or ADT damage during permeabilization. It is also interesting that the detection rates of isotype control protein tags were higher in CITE-seq. Fortunately, theapparent cell surface protein and/or ADT damage did not attenuate differential proteintag signals upon differential stimulations at the pseudo-bulk level. When we comparedtwo groups of T cells that were both activated and cultured with IL-1β and IL-23, andone of the two groups was also cultured with PGE2, significant upregulation and downregulation of a few markers were detectable in both assays and could be replicated insamples from the other donor (Fig. 2Fi–ii).We further compared transcript measurements by CITE-seq and DOGMA-seq. Bydefault, the RNA sequencing reads from the CITE-seq library were aligned to exonsPage 7 of 17
Xu et al. Genome Biology(2022) 23:135only by cellranger count, whereas those from the DOGMA-seq library were aligned toboth exons and introns by cellranger-arc count. This is reasonable since the leakage oftranscripts from permeabilized cells can be compensated in some way by additionalalignment to introns. We calculated the fraction of cells with UMIs 0 for all 36,601genes in the reference genome and found that each assay had its advantage in gene detection rates (Additional file 1: Fig. S2G). We also confirmed that the detection rates ofribosomal genes were lower in DOGMA-seq [7]. We additionally calculated the proportion of exonic UMIs for each gene detected by DOGMA-seq (Additional file 1: Fig.S2H) and dichotomized genes into exon-dominated genes and intron-dominated genes.We observed that CITE-seq had higher detection rates for almost all exon-dominatedgenes and some intron-dominated genes, whereas DOGMA-seq had higher detectionrates for most intron-dominated genes (Fig. 2G). Gene fold changes after the additionof PGE2 to the cultures were still correlated at the pseudo-bulk level, but exondominated genes and intron-dominated genes formed two lines with different slopes(Fig. 2Hi). This finding was replicable in samples from an independent donor using thesame protocol (Fig. 2Hii). To perform fairer comparisons, we also aligned RNA sequencing reads from both assays to both exons and introns, exons only, and introns only.Generally, CITE-seq outperformed DOGMA-seq in gene detection rates when RNA sequencing reads were aligned to both exons and introns or exons only (Additional file 1:Fig. S2D-E), but their performances were similar when aligned to introns only(Additional file 1: Fig. S2F).We next assessed CITE-seq and DOGMA-seq qualitatively by cluster analysiswith a series of resolutions, ranging from 0.02 to 0.3. For DOGMA-seq data, weperformed clustering using RNA, ADT, and ATAC data separately (Additional file1: Fig. S3Aii–iv). We also performed 3WNN analysis to leverage all three types ofdata (Additional file 1: Fig. S3Ai). For CITE-seq data, we performed clustering forRNA and ADT data separately using the same parameters (including resolution) asthose used for DOGMA-seq data (Additional file 1: Fig. S3Bii-iii). Bi-modal WNN(2WNN) analysis was also performed to leverage both RNA and ADT data (Additional file 1: Fig. S3Bi). We calculated ROGUE for each cluster analysis and foundthat CITE-seq had a higher average ROGUE than DOGMA-seq, given similar resolution or number of clusters, when clustering based on 3WNN (DOGMA-seq)/2WNN (CITE-seq), RNA, and ADT spaces (Fig. 2K). These findings are consistentwith our observation that CITE-seq had higher quality RNA and ADT librariesthan DOGMA-seq. We also realized that leveraging the ATAC library of DOGMAseq in cluster analysis cannot fully compensate DOGMA-seq’s inferior RNA andADT library quality but provides additional information in cell type annotation. Tobetter visualize clusters identified in 3WNN analysis of DOGMA-seq data and2WNN analysis of CITE-seq data (resolution 0.2), we utilized both RNA andADT data to perform embedding correction using Harmony (Fig. 2Ii, Ji) [13]. Corroborated by Azimuth PBMC reference projection based on RNA data [11], thesame cell types appeared on matched locations of “Harmonized” 2WNN UniformManifold Approximation and Projection (UMAP) [14] dimensionality reductionplots (Fig. 2Iii, Jii) and had comparable proportions in both assays (Fig. 2 L, Additional file 1: Fig. S2I), suggesting that Harmony performed well without overcorrection. The advantage of DOGMA-seq lies in its simultaneous measurement ofPage 8 of 17
Xu et al. Genome Biology(2022) 23:135chromatin accessibility, enabling the identification of subtypes of T helper cells.Based on expression of canonical markers, cluster 5 in DOGMA-seq data wasenriched for Th17 cells (Fig. 2M), and cluster 3 was enriched for Th1 cells (Additional file 1: Fig. S3C). These findings were further supported by peaks in genomicregions around canonical markers (Additional file 1: Fig. S3Ei-iv). However, Th17and Th1 cells were harder to identify in CITE-seq data (Fig. 2N, Additional file 1:Fig. S3D). Again, these observations highlighted the value of DOGMA-seq to studylineage-specific T helper cells.In addition to our comparisons of transcript measurements described above whereCITE-seq RNA libraries were aligned to exons only and DOGMA-seq RNA librarieswere aligned to both exons and introns because those are the default parameters andthe common practice in the corresponding cellranger and cellranger-arc pipelines, wealso performed alternative comparisons where CITE-seq and DOGMA-seq RNA libraries were aligned to both exons and introns. We found similar results regarding the correlation of log2FC (Additional file 1: Fig. S4Di-ii). As expected, CITE-seq has moredetected genes (Additional file 1: Fig. S4A-C) but a considerably lower average ROGUE(Additional file 1: Fig. S4E), implying more noisy RNA signals, possibly due to reducedmapping accuracy.ConclusionsIn summary, our study optimized the DIG cell permeabilization condition, performed acomprehensive comparison between the DIG and LLL cell permeabilization conditions,and found higher quality ADT and ATAC libraries after DIG permeabilization. We alsonoticed that LLL permeabilization causes higher contamination from ambient RNA,which should be considered in future analysis. We next performed a comprehensivetranscriptome and ADT comparison between CITE-seq and DOGMA-seq. We foundthat DOGMA-seq with optimized DIG permeabilization and its ATAC library providesmore information, even though its mRNA and cell surface protein libraries have slightlyinferior quality, compared to CITE-seq. We also recognized the additional value ofDOGMA-seq for studying lineage-specific T helper cells, with the potential to exploretranscriptomic and epigenetic interactions between various subtypes of T cells. Ourstudy provides a valuable and general guidance for technical and study design considerations for single cell multimodal omics experiments. Our study also shows the feasibility of using hashtags in DOGMA-seq.MethodsEnrichment of and stimulation of peripheral blood T cellsT cells were enriched from 30 ml of whole blood from healthy human subjects, ages18–35, following the MACSxpress Whole Blood Pan T Cell Isolation Kit, human (Miltenyi Biotec) protocol. Four aliquots of one million cells each per study subject werestimulated overnight for 12 h in 1 ml X-VIVO 15 Serum-free Hematopoietic CellMedium (Lonza) with 10 μl ImmunoCult Human CD3/CD28/CD2 T Cell Activator(STEMCELL Technologies), 50 ng/ml IL-1B (R&D Systems), and 50 ng/ml IL-23 (R&DSystems), and either 1 μM Prostaglandin E2 (PGE2) (Sigma) or 3 ng/ml TGFB (R&DSystems), or both, for a total of four stimulation conditions per subject. After thePage 9 of 17
Xu et al. Genome Biology(2022) 23:135overnight incubation, the cells were collected into 15 ml conical tubes through a 30-umstrainer and washed with up to 14 ml of PBS/0.2% BSA, centrifuged at 400 g for 5 minat 4 C, and resuspended in 50 μl Pharmingen Stain Buffer (BSA) (BD Biosciences). Analiquot of each cell suspension was then stained with ViaStain AOPI Staining Solution(Nexcelom Bioscience), and viability counts were obtained using a Cellometer Auto2000 Cell Viability Counter (Nexcelom Bioscience).Cell staining with barcoded antibodiesAfter the addition of 5 μl Human TruStain FcX (BioLegend), the cell suspension wasincubated for 10 min on ice, and then up to 500,000 cells from each condition werestained with a unique TotalSeq -A anti-human Hashtag antibody (BioLegend) [8] in 50μl for 30 min at 4 C on a Laminar Wash 16-well strip (Curiox Biosystems). The cellswere washed in the Laminar Wash Mini System (Curiox Biosystems) with 25 cycles at aflow rate of 10 μl/s. Following collection of each well and a cell count, up to 1 millioncells from the different conditions were pooled, centrifuged at 400g for 5 min at 4 Cand resuspended in 50 μl PBS/0.2% BSA. Fifty microliters of TotalSeq -A Human Universal Cocktail, V1.0 (BioLegend), at a 0.5 dilution, was added to the cell sus
SHORT REPORT Open Access Comprehensive benchmarking of CITE-seq versus DOGMA-seq single cell multimodal omics . (sci-CAR [3], SNARE-seq [4], SHARE-seq [5]), and chromatin accessibility and cell surface protein epitope measurements . and the source, provide a link to the Creative Commons licence, and indicate if changes were made. .