Transcription
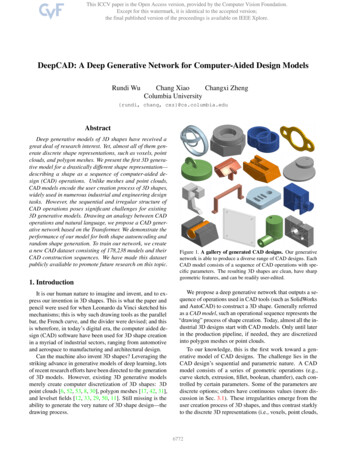
Li et al. Genome Biology(2022) HODOpen AccessA deep generative model for multi-viewprofiling of single-cell RNA-seq and ATACseq dataGaoyang Li1†, Shaliu Fu2,3†, Shuguang Wang2,3, Chenyu Zhu2,3, Bin Duan2,3, Chen Tang2,3, Xiaohan Chen2,3,Guohui Chuai2,3, Ping Wang1* and Qi Liu2,3** Correspondence: wangp@tongji.edu.cn; qiliu@tongji.edu.cn†Gaoyang Li and Shaliu Fucontributed equally to this work.1Tongji University Cancer Center,Shanghai Tenth People’s Hospital ofTongji University, Tongji University,Shanghai 200092, China2Translational Medical Center forStem Cell Therapy and Institute forRegenerative Medicine, ShanghaiEast Hospital, BioinformaticsDepartment, School of Life Sciencesand Technology, Tongji University,Shanghai, ChinaFull list of author information isavailable at the end of the articleAbstractHere, we present a multi-modal deep generative model, the single-cell Multi-ViewProfiler (scMVP), which is designed for handling sequencing data that simultaneouslymeasure gene expression and chromatin accessibility in the same cell, includingSNARE-seq, sci-CAR, Paired-seq, SHARE-seq, and Multiome from 10X Genomics.scMVP generates common latent representations for dimensionality reduction, cellclustering, and developmental trajectory inference and generates separateimputations for differential analysis and cis-regulatory element identification. scMVPcan help mitigate data sparsity issues with imputation and accurately identify cellgroups for different joint profiling techniques with common latent embedding, andwe demonstrate its advantages on several realistic datasets.BackgroundCis-regulatory elements (CREs), which are bound by combinations of transcription factors, drive cell-type-specific and time-dependent regulation of gene expression.Genome-wide mapping of CREs and their activity patterns across cells and tissues canprovide insights into the mechanisms of gene regulation. As CREs are mostly locatedin open chromatin regions, epigenomic sequencing technologies such as DNase-seq [1,2] and ATAC-seq [3] have been developed to detect open chromatin regions andmeasure chromatin accessibility in tissues and cells. The advancement of single-celltechnologies, such as scRNA-seq [4, 5] and scATAC-seq [6, 7], provides powerful toolsto uncover complex and dynamic gene regulatory networks during tissue developmentacross different cell types.Recently, several joint profiling methods that allow simultaneous measurement ofgene expression and chromatin accessibility in the same cell, such as SNARE-seq [8],sci-CAR [9], Paired-seq [10], and SHARE-seq [11] have provided accurate matching ofchromatin accessibility landscape to gene expression profiles. Moreover, 10X Genomics recently developed a “multiome” approach. This new joint profiling platform would The Author(s). 2022 Open Access This article is licensed under a Creative Commons Attribution 4.0 International License, whichpermits use, sharing, adaptation, distribution and reproduction in any medium or format, as long as you give appropriate credit tothe original author(s) and the source, provide a link to the Creative Commons licence, and indicate if changes were made. Theimages or other third party material in this article are included in the article's Creative Commons licence, unless indicated otherwisein a credit line to the material. If material is not included in the article's Creative Commons licence and your intended use is notpermitted by statutory regulation or exceeds the permitted use, you will need to obtain permission directly from the copyrightholder. To view a copy of this licence, visit http://creativecommons.org/licenses/by/4.0/. The Creative Commons Public DomainDedication waiver ) applies to the data made available in this article, unlessotherwise stated in a credit line to the data.
Li et al. Genome Biology(2022) 23:20probably extend the rapid generation and wide application of single-cell multi-modaldata. Although great advances have made in this field, these joint profiling technologiessuffer from low throughput and data sparsity. These problems impede data interpretation and limit their application in data integration and downstream analysis like cellclustering and CRE identification. Currently, several analysis methods support data integration from different modalities 12–14 and CRE interaction analysis based on eitherscRNA-seq [12] or scATAC-seq [13, 14] data. However, these methods cannot addressthe obstacle of extreme data sparsity in joint profiling technologies and use only a fraction of differentially expressed genes and differentially accessible elements in CREinteraction analysis [9]. Also, previous integration algorithms cannot address divergenceamong the heterogeneous multi-omic data, as the discrete ATAC-seq data for hundredthousands of open chromatin regions and the continuous RNA-seq data for thousandsof genes. To address these issues, several algorithms based on statistical framework [15,16] or deep generative framework [17, 18] provided different approaches for comprehensive integration of both paired and unpaired single-cell datasets. More recently,Seurat released a beta version v4.0 for integrative multimodal analysis of joint modalitysingle-cell datasets using weighted nearest neighbour (WNN) analysis [19], which is applied to 10X Genomics multiome datasets. Another work tested the application of multiple neural networks for integrative multimodal integration analysis, which useddifferent joint strategies in different datasets [20], but lacked of available tools or codefor real application to multi-modal datasets.Deep generative models have been widely applied for modeling the high-dimensiondata, such as singe-cell sequencing data [17, 18]. Among those deep generative models,the variational autoencoder (VAE), which uses a recognition module as encoder and agenerative module as decoder to learn the latent distribution of input data. The VAEmodel maximizes the similarity between generated data from decoder and input datawhile minimizing the Kullback-Leibeler divergence of the prior distribution of latentembedding and its true posterior distribution produced by the inference (encoder) network. The standard VAE model uses a multivariable Gaussian distribution as prior forthe latent variables, which is hard to fit for sparse data with complex distribution. Replacing Gaussian distribution with Gaussian Mixture Model (GMM) as the prior hasbeen applied in a recent developed method SCALE for unsupervised clustering andrealistic samples generation for scATAC-seq datasets [14]. Recent tools as MultiVI [18]and Cobolt [17] utilize symmetric multimodal VAE model for joint modality single-celldataset. However, for the multi-modal data integration, the encoder-produced latentembedding can capture the common semantic feature across modalities while decodergenerated data still preserve the modal-specific biological information, which requirethe similarity between integrated modalities. For joint profiling datasets with extremedata sparsity and random noise in either omic of dataset, the inconsistency of multiomics joint embedding will largely confuse the biological variation in cell latent embedding and exceedingly smooth the generated data from continuous distribution of generative model, impeding the explanation and downstream application of joint latentembedding. In addition, self-attention-based embedding models, such as Transformerand BERT, show high performance on extreme sparse NLP tasks [21] and sequence orstructured tasks like protein-structured prediction [22], indicating their potential incapturing the weak correlation from high-dimensional high-sparsity biological data.Page 2 of 23
Li et al. Genome Biology(2022) 23:20Here, we propose a non-symmetric deep generative model, the single-cell Multi-ViewProfiler (scMVP), which is designed for comprehensive handling sequencing data thatsimultaneously measure gene expression and chromatin accessibility in the same cell,including SNARE-seq [8], sci-CAR [9], Paired-seq [10], SHARE-seq [11], and 10X Multiome. scMVP automatically learns the common latent representation for scRNA-seqand scATAC-seq data through a clustering consistency-constrained multi-view variational auto-encoder model (VAE), and imputes each single layer data from the common latent embedding of the multi-omic data through layer-specific data generationprocess, including transformer’s self-attention-based scATAC generation channel andmask attention-based scRNA generating channel. scMVP is designed specifically to address the two main challenges in joint profiling of scRNA-seq and scATAC-seq, i.e., (1)how to overcome the difficulties in processing a highly sparse data matrix, as the sequencing data throughput of the joint profiling methods is only one-tenth to one-fifththe throughput of single modality scRNA-seq or scATAC-seq data; (2) how to jointlyutilize two omic data for downstream single-cell analyses, such as cell denoising, cellclustering, cellular trajectory inference, and CRE prediction rather than conventionalindependent analysis of scRNA and scATAC followed by integration or anchoring thetwo omics data between similar cell clusters. Compared to other tools which utilizeneural networks for embedding scRNA-seq datasets [23–27] and multi-modal datasets[15–18], scMVP provides an efficient deep generation model for joint profiling of multiple omic measurements of the same single-cell and enables simultaneous multi-modalanalysis of data normalization, clustering, joint embedding, visualization, trajectory inference, and CRE prediction for joint profiling sequencing data.ResultsThe scMVP modelTo fully utilize the joint profiling data from the same cell, we developed scMVP, whichintegrated scRNA and scATAC data into a common low-dimensional latent space forcell embedding, clustering, and imputation (Fig. 1a).The basic idea of scMVP is to introduce a Gaussian mixture model (GMM) prior toderive the common latent embedding by maximizing the likelihood of the joint generation probability of the multi-omic data, which is implemented as a multi-modal asymmetric GMM-VAE model with two extra clustering consistency modules to align eachimputed omics and preserve the common semantic information, and used to imputemissing data, cluster cell groups, assemble multiple modalities, and construct a developmental lineage.First, scMVP takes raw count of scRNA-seq and term frequency–inverse documentfrequency (TF-IDF) transformed scATAC-seq as input [28]. To auto-learn a commonlatent distribution of the joint scRNA-seq and scATAC-seq profiling, scMVP utilizesGMM as the prior distribution of latent embedding z for the multi-view VAE model,that is, the observed scRNA gene expression x and TF-IDF transformed scATAC chromatin accessibility y in each cell modeled as a sample drawn from a negative binomial(NB) distribution p(x z, c) and a zero-inflated Poisson (ZIP) distribution p(y z, c), conditioned on the common latent embedding z and cell type c, one of predefined K components of GMM. scMVP uses a two-channel Decoder neural network transformingPage 3 of 23
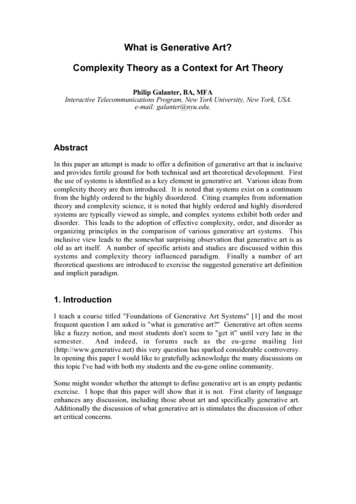
Li et al. Genome Biology(2022) 23:20Fig. 1 Overview of the scMVP framework. a Given the scRNA-seq genes expression counts and TF-IDFtransformed scATAC-seq chromatin accessibility peaks profile of each cell as input, scMVP learns the optimaljoint embedding for downstream analysis with a multi-view deep generative model. Two independentchannels of attention-based networks are utilized to the backbone of the encoder model to adapt inputs ofthe different modalities, including canonical mask attention subnetwork for scRNA and transformer derivedself-attention for TF-IDF transformed scATAC, and then joint together to derive the posterior distributionparameters of common latent embedding z following a Gaussian mixture model prior. Next, the imputedscRNA and scATAC profiles are reconstructed by an attention based two-channels decoder network, whichshares similar network structure with the encoder network. And an auxiliary attention module with input ofcluster probability of common latent embedding z (denoted as p(c z)) in the prior distribution is utilized toweight each decoder channel of the imputed scRNA and scATAC profile. Here, the imputed RNA and ATACare produced by the mean value of Gamma distribution for scRNA data and the Poisson distribution forscATAC data, respectively. To guarantee the embedding consistency between the original and imputeddata, two single-channel encoders are used to embed the imputed RNA and ATAC separately to minimizethe KL divergence between common latent embedding z and each imputed embedding. b ARI metrics ofclustering accuracy along with the varying of latent embedding dimensions in a range from 2 to 20. cRunning times for training models on the resampling SHARE-seq cell line datasets with a set of 8000 genesand 23,000 peaks. scMVP, scVI, WNN, and cisTopic are tested on a server with one 10-core Intel Xeon E52680 with 32 GB RAM and one NVIDIA 1080TI GPU with 11 GB RAMthe common latent embedding z into the parameters of NB and ZIP distribution, witha cell type c guided attention module to capture the potential correlation between thescRNA and scATAC data within same cell (see Fig 1a and method). Then, the generated scRNA and scATAC data are denoised and imputed by the mean of the corresponding output distribution, respectively, while the embedded common latent code zcan be used for a series of downstream analysis, e.g., visualization, trajectory analysis,and which is inferenced through a variational process by maximizing the variationalpðx;y;z;cÞ : scMVP estievidence lower bound (ELBO), that is, Lelbo ðx; yÞ ¼ E qðz;cjx;yÞ ½ log qðz;cjx;yÞmates the distribution parameters of the q(z, c x, y) according to another joint Encoderneural network, e.g., the mean μz and variance σz for z μc σcI, I N(0, 1) using aPage 4 of 23
Li et al. Genome Biology(2022) 23:20reparameterization trick for the gradient back-propagation. To better capture the feature correlations intra-omic and extract the biological intrinsic semantic embedding ofinter-omics, we introduce the multi-heads self-attention-based transformer encoderand decoder modules for ATAC sub-network branch and mask attention-based encoder and decoder modules for RNA sub-network branch (see Fig. 1a and method).scMVP introduces the multi-heads self-attention module to capture the local longdistance correlation from sparse and high-dimension scATAC profile of joint dataset,and the mask attention to focus on the local semantic region of cells. Next, scMVP usesa cycle-GAN like auxiliary network module for consistency of latent embedding distribution between imputed and raw joint profiling data, and this auxiliary network module will enforce the latent embedding contain the common biological semantics as cellclusters across modalities rather than a simple alignment in canonical VAE and perverse the reversibility and uniqueness of each imputed omics (Fig. 1a and methods). Finally, the proposed model is trained using a back-propagation algorithm in a minibatch way and generates latent embedding, scRNA-seq imputation, and scATAC-seqimputation simultaneously as output. The details of scMVP design can be found in the“Methods” section.We further explored the optimal variable for latent dimensions. We constructed twodatasets with well labelled cells from Paired-seq and sci-CAR cell line datasets and evaluated the clustering accuracy using adjusted Rand Index (ARI) metric depending ondifferent dimensions of latent embedding. The higher ARI score indicates higher clustering accuracy, and the ARI score equals to 1 when the cluster is exactly matched tothe reference standards. scMVP showed best performance with 10 dimensions of latentembedding, which is set as default size for latent embedding (Fig. 1b).scMVP model evaluationWe evaluated scMVP along with a set of benchmark methods on several single-celljoint profiling datasets with variable biological or technological characteristics [8–11].We first tested the scalability of scMVP model on different joint profiling datasets. Toestimate the time and memory consumption in the training step, we randomly sampleda range of 1000 to 100,000 cells from the 67,418 cells of SHARE-seq GM12878 cell linedataset and filtered dataset to 8000 genes and 23,000 peaks with highest expression,and tested the datasets of scRNA-seq in scVI, scATAC-seq in cisTopic and both inscMVP and Seurat v4 WNN. scMVP took the 752 MB for 1000 cells and 8.5 GB for100,000 cells, which is similar with scVI, cisTopic, and WNN testing on 100,000 cells.Benefit from the GPU parallel computing technique and stochastic optimization in aminibatch way in the neural network model training, deep models as scMVP and scVItook similar training time with the general machine learning method WNN, whichused less than 1 h for 100,000 cells dataset, while cisTopic based on Monte Carlo sampling model took more than 5 h for 20,000 cells dataset (Fig. 1c). To evaluate the capacity of scMVP for batch correction, we used the SHARE-seq GM12878 cell linedataset [11] containing 2 replicates of 2973 cells and 8803 cells, which showed batchesbetween replicates in both scRNA-seq and scATAC-seq datasets (Additional file 1: Fig.S1a). scMVP successfully removed the batch from replicates without the label ofbatches (Additional file 1: Fig. S1a). In addition, convergence analysis showed scMVPPage 5 of 23
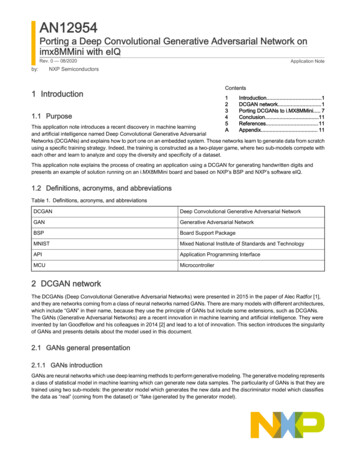
Li et al. Genome Biology(2022) 23:20reaching stable loss within 30 epochs for the SHARE-seq dataset, which would also behelpful to reduce the model training time (Additional file 1: Fig. S1b).Next, we evaluated whether imputation from generative models such as scMVP andscVI can help mitigate data sparsity issue in joint profiling dataset. We first evaluatedthe ability to accurately capture real gene expression profiles by comparing imputedand real scRNA-seq profile of each cell type to gene expression in bulk cell line datasetsof corresponding cell type. For each cell type, we used the correlation between the geneexpression in every cell and the gene expression in bulk cell line RNA-seq, as higherthe correlation of all genes in each cell from scRNA-seq indicating better capture ofreal gene expression of bulk RNA-seq in distinct cell type. We found scMVP showedhigher imputation correlation than scVI and raw scRNA count in A549 cells treatedwith DEX for 0h, 1h, and 3h from sci-CAR dataset and four cell types SNARE-seq dataset (Fig. 2a). For HepG2 cell from Paired-seq scRNA-seq imputation of scMVP andscVI were consistently better than raw scRNA-seq count, indicating the improvementof scRNA-seq imputation for three joint profiling techniques.Fig. 2 scMVP mitigates data sparsity in joint profiling datasets. a Correlation between original and imputedgene expression of each cell from scRNA of joint profiling datasets and gene expression in correspondingbulk RNA-seq dataset. A549 cell lines treated with DEX for 0h (ENCSR632DQP), 1h (ENCSR656FIH), 3h (ENCSR624RID) in sci-CAR dataset, HepG2 cell line (ENCSR058OSL) in Paired-seq dataset and H1 (ENCSR670WQY),BJ (ENCSR000COP), K562 (ENCSR530NHO), and GM12878 (ENCSR000CPO) cell lines in SNARE-seq datasetwere used for benchmark. b Number of bulk ATAC peaks identified by raw and imputed scATAC in eachcell. c Ratio of raw and imputed scATAC peaks identified in bulk ATAC peaks. DNase-seq signal files for H1(ENCSR000EMU) and BJ (ENCSR000EME), and ATAC-seq signal files for K562 (ENCSR868FGK) and GM12878(ENCSR095QNB) were used for benchmarkPage 6 of 23
Li et al. Genome Biology(2022) 23:20We further evaluated imputation of scATAC-seq from scMVP by comparing peaksidentified in each cell to bulk ATAC-seq or bulk DNase-seq signal in correspondingcell line. Compared to raw scATAC-seq profile, scMVP scATAC imputation capturedmore peaks than raw scATAC-seq (p value 10-10), with median of 4114, 3778, 1017,and 1251 imputed peaks versus 918, 922, 404, and 442 raw peaks in BJ, H1, K562, andGM12878 cell lines (Fig. 2b). As scMVP imputed more scATAC-seq peaks in each cellthan raw scATAC-seq profile, the ratio imputed peaks identified in bulk DNase-seq(H1, BJ) or bulk ATAC-seq (K562, GM12878) were higher in BJ, GM12878, and K562cells and similar in H1 cells to the ratio of raw peaks in bulk dataset (Fig. 2c), which indicates enhancement of true ATAC-seq signal and mitigation of data sparsity forscATAC-seq profile of joint profiling dataset.scMVP accurately identified cell clusters from joint profiling cell line dataWe next evaluated the extent to which the joint latent space inferred by scMVPreflected real biological similarity among cells. We benchmarked scMVP with singleview scRNA-seq tools as Monocle3 [29], scVI [25], single view scATAC-seq tools asMonocle3 [29] and cisTopic [30], universal integration tools as MOFA [16], scAI [15],MultiVI [18], Cobolt [17], and paired dataset integration tools for multi-modalities insame cell as Seurat v4 WNN [19]. We assessed the accuracy of these methods by applying K-means clustering (using the same k as number of major cell types in dataset) andtesting consistency with annotated cell labels.Firstly, we applied these algorithms to well-labeled cell line mixture data from sciCAR, which included the 293T cell line, 3T3 cell line, 293T/3T3 cell mixture, andA549 cell line treated with dexamethasone (DEX) for 0 h, 1 h, and 3 h. scMVP, scVI,scRNA, and scATAC from Monocle3 grouped cells into three distinct clusters (293T,3T3, and A549) from same cell annotations (Fig. 3a, Additional file 2: Table S1), andARI scores of cells of annotated labels ranged from 0.92 to 1 (Additional file 1: Fig. S3,Additional file 1: Table S4), more accurate than cell clusters of WNN (0.42), cisTopic(0.36), and universal integration tools (0.37–0.42).Next, we applied these algorithms to Paired-seq cell line data including two labelledcell types and their mixture. We first evaluated the cell clusters from these algorithmsfor cell annotated as HepG2 and HEK293. scMVP displayed a similar accuracy withscVI, cisTopic, and scATAC from Moncole3, better than Seurat v4 WNN and scRNAfrom Monocle3 but relatively lower than ARI scores of algorithms in sci-CAR dataset(Additional file 1: Fig. S3, Additional file 2: Table S4). However, all universal toolsshowed limit discrimination power of two cell types using their latent embedding withARI scores ranged from 0.01 to 0.11, indicating the severe impact of data sparsity tocurrent universal integration tools.We further investigated UMAP visualization and found different number of cell subpopulations in these algorithms (Fig. 3b, Additional file 1: Table S2). Rather than thetwo cell clusters identified in UMAP results of other single-view algorithms and WNN,scMVP, and cisTopic yielded three cell clusters (Additional file 1: Fig. S2a-b), two ofwhich identified as HEK293 cells and HepG2 cells, and another cluster that containedboth cell types were largely consistent in two algorithms (Additional file 1: Fig. S2c).Then, we evaluated the gene and chromatin accessibility levels of each cell in the newPage 7 of 23
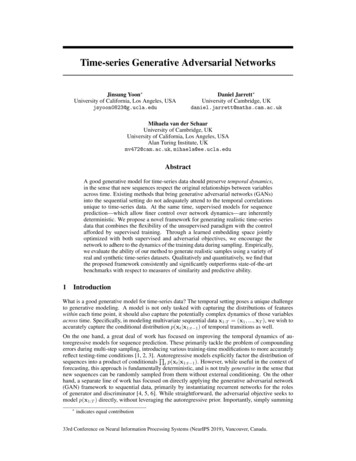
Li et al. Genome Biology(2022) 23:20Fig. 3 scMVP identifies accurate cell clusters from joint profiling cell line data. a–c Visualization ofalgorithms latent embeddings of three groups, algorithms specifically for joint modality datasets (shown as“Paired only”), algorithms of single omic (shown as “Single view”), and algorithms designed from bothpaired and unpaired datasets (shown as “Universal”) a UMAP visualization of scMVP, scVI, cisTopic, WNN,MultiVI, Cobolt, MOFA , and scAI by Seurat v4 on the sci-CAR cell line dataset of A549, 293T, and 3T3 cells.b UMAP visualization of scMVP, scVI, cisTopic, WNN, MultiVI, Cobolt, MOFA , and scAI by Seurat v4 on thePaired-seq cell line dataset of HEK293 and HepG2 cells. c UMAP visualization of scMVP, scVI, cisTopic, WNN,MultiVI, Cobolt, MOFA , and scAI by Seurat v4 on the SNARE-seq cell line dataset of H1, BJ, K562, andGM12878 cells. d ARI scores for clustering on latent embeddings of benchmark algorithmscell cluster from scMVP and cisTopic. The new cluster showed relatively lower totalRNA expression (p value 10-10) and relatively higher total expression in the scATACseq (p value 10-10) than the other two clusters (Additional file 1: Fig. 2d). These findings indicate that multi-omic integrated clustering in scMVP can be exploited to identify and cluster cells of abnormal state in either omic of joint profiling dataset afterPage 8 of 23
Li et al. Genome Biology(2022) 23:20conventional methods that filter cells by extraordinarily high or low sequencing coverage threshold are used.Then, we applied these algorithms to SNARE-seq cell line data including four labeledcell types. scMVP displayed a similar high accuracy with Seurat v4 WNN and scRNAfrom Monocle3 (Additional file 2: Table S3), which got four distinct subpopulationsfrom same annotations in their UMAP visualization (Fig. 3c, Additional file 1: Fig. S2c).Rather than four clusters in scMVP and the other two algorithms, cisTopic, and scATAC from Monocle3 only got three clusters and grouped K562 and GM12878 intosame cluster, which indicates that SNARE-seq could not distinguish K562 andGM12878 cells well with the single view of scATAC-seq, but could be well separatedby integrated of both scRNA-seq and scATAC-seq by scMVP and Seurat v4 WNN.Four universal integration tools could not get four identical cell clusters in their latentembedding, although MOFA with better visualization discrimination of four cell typesand higher clustering performance than other three integration tools.We also evaluated the performance of algorithms designed for integration of differentmodalities in different cells as Seurat v3 [31] and Liger [32] for joint profiling cell linedatasets. Seurat v3 cannot integrate scATAC and scRNA into consistent clusters in sciCAR and Paired-seq cell line datasets and Liger cannot found consistent clusters in sciCAR dataset (Additional file 1: Fig. S3-S5). And cells from same annotations cannot bedistinguished into distinct subpopulations for Seurat v3 in SNARE-seq dataset andLiger in Paired-seq and SNARE-seq dataset, even if two algorithms can integrate theview of scRNA and scATAC from same cells.Overall, analyzing joint profiling dataset with scMVP has proven to be helpful inidentifying accurate grouping of cell clusters taking advantage of joint deep models andlearning the characteristics from both layers of omic data.scMVP recovered major cell types in realistic datasetsTo further examine the performance of scMVP on realistic joint profiling dataset, weused scMVP and other tools to analyze a 0-day postnatal (P0) mouse cerebral cortexdataset with 5081 cells generated by droplet-based SNARE-seq [8]. We first evaluatedcells latent embedding and clustering accuracy of scMVP and other benchmark algorithms with reference cell annotations from Chen’s paper [8] (Fig. 4a, Additional file 1:Fig. S6, Additional file 2: Table S5). The ARI score of Monocle3 scATAC got only0.002, and the UMAP visualization showed no discrimination among reference celltypes, which indicates limited contribution of scATAC to cell clustering. However, bothscMVP and WNN, which also integrated the data from scATAC, achieved higher clustering accuracy than other algorithms using only scRNA data of the joint profiling dataset. Among four universal integration tools, scAI could not complete the analysiswithin 48 h, and other three algorithms showed low clustering performance with ARIscores ranging from 0.03 to 0.08, suffering from low sequencing depth of the scATACview of the dataset.We next evaluated the performance of scMVP for 10X Multiome, which is the mostpopular multi-omics technology. We analyzed 7039 T cells in the 10X Lymph Nodedataset with scMVP and other benchmark tools, as these T cells were well annotatedby 10x Genomics, but difficult to distinguish the T cell subtypes by the view of scRNAPage 9 of 23
Li et al. Genome Biology(2022) 23:20Fig. 4 scMVP recovers major cell types in realistic datasets. a Adjusted rand index for nine benchmarkalgorithms in SNARE-seq mouse P0 dataset, 10X Genomics PBMC dataset, 10X Genomics Lymph Nodedataset, and SHARE-seq mouse skin dataset. b Consistency between DEGs from SNARE-seq paper and topDEGs computed from scVI and scMVP scRNA imputation. c Aggregation profile of mouse forebrain P0H3K4me3 ChIP-seq signal (ENCSR094TTT) in gene proximal cis-regulatory peaks computed by Cicero orLASSO for raw expression or scMVP imputed expression. d Aggregation profile of mouse forebrain P0H3K27ac ChIP-seq signal (ENCFF695KNJ) in gene distal cis-regulatory peaks computed by cicero or LASSOfor raw expression or scMVP imputed expressionor scATAC with ARI scores of 0.28 and 0.08 (Fig. 4a, Additional file 1: Fig. S7, Additional file 1: Table S5). The clustering accuracy of scMVP (0.28) was similar to the accuracy of Monocle3 scRNA, and higher than scVI (0.23), cisTopic (0.06), WNN (0.21),and universal integration tools, ranging from 0.03 to 0.13.To test the performance scMVP on more complex realistic datasets, we then appliedscMVP to two larger datasets; PBMC joint profiling dataset with 11,909 cells from 10Xgenomics multiome dataset, and mouse skin dataset with 34,773 cells from SHARE-seqdataset [11]. Compared to benchmark algorithms, scMVP showed consistent highagreement with the reference in both 10X PBMC dataset and SHARE-seq skin dataset(Fig. 4a, Additional file 1: Table S5), and most of the major references have corresponding cluster identified by scMVP (Additional file 1: Fig. S8-S9). Among four universal integration tools, scAI still could not complete the analysis within 48 h. However,MultiVI, Cobolt, and MOFA showed relative higher clustering performance comparedto
SNARE-seq, sci-CAR, Paired-seq, SHARE-seq, and Multiome from 10X Genomics. . in open chromatin regions, epigenomic sequencing technologies such as DNase-seq [1, 2] and ATAC-seq [3] have been developed to detect open chromatin regions and . and the source, provide a link to the Creative Commons licence, and indicate if changes were made. The