Transcription
Turnbull et al. BMC Bioinformatics(2020) ARCH ARTICLEOpen AccessUnlocking the transcriptomic potential offormalin-fixed paraffin embedded clinicaltissues: comparison of gene expressionprofiling approachesArran K. Turnbull1,2, Cigdem Selli1,3, Carlos Martinez-Perez1,2, Anu Fernando1,2, Lorna Renshaw2, Jane Keys2,Jonine D. Figueroa4, Xiaping He5, Maki Tanioka5, Alison F. Munro1, Lee Murphy6, Angie Fawkes7, Richard Clark7,Audrey Coutts7, Charles M. Perou5, Lisa A. Carey5, J. Michael Dixon2 and Andrew H. Sims1*AbstractBackground: High-throughput transcriptomics has matured into a very well established and widely utilisedresearch tool over the last two decades. Clinical datasets generated on a range of different platforms continue tobe deposited in public repositories provide an ever-growing, valuable resource for reanalysis. Cost and tissueavailability normally preclude processing samples across multiple technologies, making it challenging to directlyevaluate performance and whether data from different platforms can be reliably compared or integrated.Methods: This study describes our experiences of nine new and established mRNA profiling techniques includingLexogen QuantSeq, Qiagen QiaSeq, BioSpyder TempO-Seq, Ion AmpliSeq, Nanostring, Affymetrix Clariom S orU133A, Illumina BeadChip and RNA-seq of formalin-fixed paraffin embedded (FFPE) and fresh frozen (FF) sequentialpatient-matched breast tumour samples.Results: The number of genes represented and reliability varied between the platforms, but overall all methodsprovided data which were largely comparable. Crucially we found that it is possible to integrate data for combinedanalyses across FFPE/FF and platforms using established batch correction methods as required to increase cohortsizes. However, some platforms appear to be better suited to FFPE samples, particularly archival material.Conclusions: Overall, we illustrate that technology selection is a balance between required resolution, samplequality, availability and cost.Keywords: FFPE, Fresh-frozen, Gene expression, Microarray, Sequencing, TranscriptomicsBackgroundSince their inception microarrays have been adopted asa major tool for the study of clinical samples to improveour understanding of diseases, development of molecularsubtyping and prognostic signatures for clinicaldecision-making [1]. A crucial consideration for manyclinical studies is whether new data generated can bedirectly compared or integrated with pre-existing datasets for robust classification and response prediction.* Correspondence: andrew.sims@ed.ac.uk1Applied Bioinformatics of Cancer, Cancer Research UK Edinburgh Centre,MRC Institute of Genetics and Molecular Medicine, Edinburgh, UKFull list of author information is available at the end of the articleRNA sequencing (RNAseq) has somewhat supplantedmicroarrays for transcriptome analysis. However, intranslational research when the focus is often restrictedto identifying differentially expressed genes and pathways, rather than detecting specific isoforms and splicevariants, decisions on which platform to use are oftenbased upon cost, rather than resolution, particularly ifthis means more samples can be examined to maximisestatistical power for a fixed budget. Indeed, RNAseq isnot without its limitations, Robert and Watson recentlydemonstrated that RNAseq is unable to accurately measure expression of hundreds of genes in the humangenome [2]. The Author(s). 2020 Open Access This article is distributed under the terms of the Creative Commons Attribution 4.0International License (http://creativecommons.org/licenses/by/4.0/), which permits unrestricted use, distribution, andreproduction in any medium, provided you give appropriate credit to the original author(s) and the source, provide a link tothe Creative Commons license, and indicate if changes were made. The Creative Commons Public Domain Dedication o/1.0/) applies to the data made available in this article, unless otherwise stated.
Turnbull et al. BMC Bioinformatics(2020) 21:30Page 2 of 10Many high-throughput profiling studies rely on sampleavailability and cost rather than statistical power [1].Direct integration of datasets enables meta-analysis andhas the potential to improve statistical power and thegeneralisability of results for robust classification and response prediction. However, non-trivial systematic biasor ‘batch effects’ can occur within and between microarray platforms [3–6]. Contrary to The MicroArrayQuality Control guidelines [7], gene expression data canbe directly integrated and robust results can be produced from fundamentally different technologies such asAffymetrix GeneChips and Illumina BeadChips [3]. Thisfinding has since been supported by other studies [8, 9].Early microarray studies involving clinical samples weredependent on relatively large amounts of high quality RNAand thus relied heavily on the availability of fresh frozen(FF) tissue. However, collection and storage of FF tissue iscostly and can be logistically prohibitive. Protocols andtechnologies capable of generating high quality wholegenome transcriptomic data from archival formalin fixedparaffin embedded (FFPE) tissues are in demand [10]. FFPEtissues are available routinely in the clinical setting and canbe stored at ambient temperature for many years, allowingeasy transportation. A large number of studies have compared matched FF and FFPE samples, with some reportingreduced efficacy or numbers of detected transcripts andbatch effects similar to those reported for different profilingtechnologies (recently reviewed [11]). Most studies concludethat the data can be compared to some extent, subject tocertain considerations, accepting that RNA from FFPE samples is often degraded and continues to degrade with age[10]. Whilst earlier microarray technologies performedpoorly with degraded RNA, newer kits and platforms haveemerged using targeted sequencing such as Ion AmpliSeqTranscriptome and BioSpyder TempO-Seq or 3′ sequencing from Lexogen QuantSeq. Other technologies such asTable 1 Comparison of traditional and new microarray platforms with sequencing approachesTechnology Technology/PlatformBiochemistry3′ RNALexogensequencing QuantSeqRNA RT, oligodT priming from 3′ 96 samplesend, random priming towards 3′per 5 daysend amplification and barcoding sequencingQiaSeq UPXRNA RT, oligodT priming for3′cDNA synthesis templateTranscriptome switching for 2nd strand synthesispriming fragmentation endrepair addition, adapter ligation PCR to add indices cingRNA annealed 50 bp detectoroligos are ligated then amplifiedand barcoded sequencingIon Ampliseq RNA RT, multiplex PCR Transcriptome sequence barcoding emulsionPCR sequencing of 150 bptargetsApprox.Max.Throughput no.probes/primerpairsNo. ofmappedENSGIDsReadInputDepths FFPERNA(ng)*Approx.cost persample( )**Successrate ofFFsamples(n)Successrate ofFFPEsamples(n)55,76525,61010 M50090N/A98%(318)96 samplesper 5 days42,55320,00015 M1050N/A94% (48)192samplesper 4 days19,30019,30012 M20 μm 160FFPESectionN/A95% (38)96 samplesper 5 days20,80219,0598M10160100%(108)76% RNA hybridisation to fluorescentbarcoded probes in solution immobilised in nCounter cartridge scan12 samples 800per day(800 genes)NewerMicroarrayAffymetrixClariom SRNA cRNA amplification hybridisation to GeneChip scan192samplesper 4 days211,300 20,000N/A50100100% (3) 100% (8)TraditionalMicroarrayAffymetrixU133A192 perday250,833 %(348)21%(206)18,57s1136 Mpairedreads2000250–500 100%(52)100%(87)IlluminaRNA RT, amplification,96 samples 47,323BeadChip HT- biotinylation (NuGEN WT Ovationper 1.5 days12 v3 / v4kit) hybridisation to 50 bp probeson chip scanFull RNARNA-seqSequencingRNA fragmentation RT barcoded library construction genome-wide full RNA sequencing8 samplesper 5 days20,025*Input RNA reflects quantities used in this study – for input ranges refer to the manufacturer’s guidelines**Estimated costs ( , UK December 2019) include library preparation and sequencing. Costs can vary by sample numbers and sequencing infrastructure
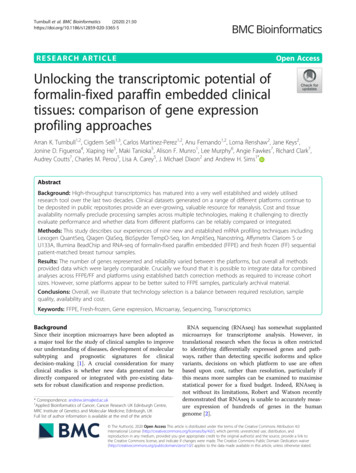
Turnbull et al. BMC BioinformaticsFig. 1 (See legend on next page.)(2020) 21:30Page 3 of 10
Turnbull et al. BMC Bioinformatics(2020) 21:30Page 4 of 10(See figure on previous page.)Fig. 1 Comparison of gene expression profiling approaches (a) Schematic of probe/primer designs for each technology. A table showing whichsamples were processed on each technology is provided in Additional file 1: Table S1. b Number of overlapping Ensembl gene identifiersdetected in each dataset (Nanostring and Affymetix U133 were omitted as they do not represent the whole transcriptome and the Clariom S wasexcluded as only three samples were processed). c Summary of FFPE sample processing success rates by sample age usingwhole-transcriptome platformsNanoString are promising, but are limited to panels of genesrather than whole genome transcriptome. In this study, anumber of gene expression profiling platforms werecompared.MethodsClinical samplesAll patients gave informed consent and the study was approved by the local ethics committee (LREC; 2001/8/80and 2001/8/81). RNA was extracted from primary humanbreast cancer samples collected over 15 years at the Edinburgh Breast Unit from post-menopausal women with estrogen receptor positive disease, treated with 3-months ofneoadjuvant endocrine therapy. Sequential biopsies weretaken pre-treatment, early (14-days) on-treatment and atsurgery 3–6 months later (late on-treatment) from eachpatient. Part of the biopsy material collected was snapfrozen in liquid nitrogen and part was fixed in formalinand embedded in paraffin. RNA was extracted from freshfrozen tissue using the Qiagen miRNeasy kit and from 2 20 μm FFPE tissue sections using the RNeasy FFPE kitusing the manufacturer’s standard protocols for each kit.Agilent RIN values for fresh frozen tissue were 7 and forFFPE tissue were 3.TranscriptomicsBuilding upon large scale clinical studies to investigatethe effects of endocrine therapy on breast cancer usingAffymetrix U133A arrays [12] and Illumina HT12-V4BeadChips [13], this study, utilised patient-matched setsof samples across a range of transcriptomic technologies:Affymetrix Clariom S, NanoString, Ion AmpliSeq Transcriptome, BioSpyder TempO-seq [14] Lexogen QuantSeq and RNA-seq (Table 1). Microarray samples wereprocessed as directed by the manufacturer’s instructions.Nanostring profiling was performed using nCountertechnology as per the manufacturer’s instructions. Sequencing was performed as described: Ion Ampliseqsamples were processed using an Ion a PI Chip Kit v3and sequenced using an Ion Proton System. QiaSeqsamples were sequenced using the NextSeq 500/550High-Output v2 (150 cycle) Kit on the NextSeq 550 platform. For TempoSeq samples, single read (1x75bp) sequencing was performed using the NextSeq 500/550High-Output v2 (75 cycle) Kit on the NextSeq 550 platform. For QuantSeq samples were either processed viasingle read (1x75bp) sequencing performed using theNextSeq 500/550 High-Output v2 (75 cycle) Kit on theNextSeq 550 platform or via Ion a PI Chip Kit v3 andsequenced using an Ion Proton System. For RNASeqsamples the TruSeq Stranded Total RNA Library PrepKit with Ribo-Zero Gold (Illumina) was used and sequencing was performed on an Illumina HiSeq 2500using a 2x50bp configuration with an average of 136million read pairs per sample. All data is publicly available from NCBI GEO (www.ncbi.nlm.nih.gov/geo/)under super-series accession GSE130645.Data analysisIllumina and Affymetrix data were pre-processed and normalised as described previously [3]. NanoString data weregenerated using the nSolver 3.0 software. Ion AmpliSeqTranscriptome data were generated using the AmpliSeqRNA plugin in the Torrent Suite Software and normalisedusing RPM (reads assigned per million mapped reads)method. QiaSeq FASTQ files were uploaded to the GeneGlobe Data Analysis Center, an online platform providedby QIAGEN. The primary analysis module for the UPX 3′Transcriptome Kit was used to generate UMI-based geneexpression estimates from the reads for all samples. QuantSeq raw data in .bcl format was transferred from the NextSeq instrument to a Linux system, where demultiplexedFASTQ files were generated using Bcl2fastq2 v2.17.1.14software provided by Illumina. The lane-splitting featurewas disabled to create a single FASTQ file for each library.FASTQ files were then uploaded to the BlueBee genomicsplatform (https://www.bluebee.com) and read-trimmingand alignment was performed using the QuantSeq plugin.TempoSeq FASTQ files were sent to BioCalvis (the manufacturer of BioSpyder), who performed the alignment andthen generated the raw (un-normalised) gene counts fileusing their proprietary software. For RNAseq, alignmentwas performed using STAR74. Transcript abundance estimates for each sample were performed using Salmon, anexpectation-maximization algorithm using the UCSC genedefinitions. Raw read counts for all RNAseq samples werenormalized to a fixed upper quartile.All sequence data were aligned to the human referencehg19 genome. For all data, probes or genes were thenmapped to Ensembl gene annotations: Affymetrix datasetswere mapped using a chip definition file (CDF) [15] andall other datasets were mapped using BioMart. All data
Turnbull et al. BMC BioinformaticsFig. 2 (See legend on next page.)(2020) 21:30Page 5 of 10
Turnbull et al. BMC Bioinformatics(2020) 21:30Page 6 of 10(See figure on previous page.)Fig. 2 Batch correction allows robust direct integration of transcriptomic data across platforms. a Dissimilarity heatmaps based upon Pearsoncorrelations ranging from 0.4 (red) through shades of orange and yellow to 1.0 (white). Left triangle shows the combined dataset of 6844 genesacross 7 gene expression platforms. Right triangle shows the same data following batch correction with Combat. Coloured bars belowdendrograms denote the platform. b Enlargement of the dendrogram to demonstrate that the majority of the same time-point patient samplesprocessed on different platforms cluster together following batch correction. c Scatter plots before (grey) and after batch correction (pink) of thesame sample, either FF or FFPE processed across different platforms. In each case the Pearson correlations increase substantially following batchcorrection. Patient samples are denoted 1 for pre-treatment, 2 for early on-treatmentwere Log2 transformed and filtered for those expressed in70% of samples using the cluster 3.0 software then quantile normalised using the R/Bioconductor software andpackages [16]. Following data integration, correction ofsystematic bias was performed using ComBat as describedpreviously [3].with several hundred samples processed on the IlluminaBeadChip, Affymetrix U133A chips and RNAseq (Table 1).As shown previously [10], older FFPE samples were foundto perform very poorly with the more established technologies (Fig. 1c) whereas NanoString, Lexogen QuantSeq andRNA-seq were found to work well with old FFPE tissuederived RNA.ResultsPerformance and cost comparison of platforms for FF andFFPE tissueIntegration of datasets across platforms while preservingbiological variabilityEach of the nine technologies evaluated here have differentmRNA input requirements, probe designs (Fig. 1a) andprotocols (summarised in Table 1). Although the totalnumber and position of probes/primers/counts varieswidely among the transcriptome-wide approaches (Table 1,Fig. 1a), a common set of 7365 Ensembl transcripts wererepresented across the six whole transcriptome platforms(Fig. 1b). Nanostring and Affymetrix U133 were omitted asthey do not represent the whole transcriptome and theClariom S was excluded as only three samples were processed). RNAseq may have the highest resolution, but alsothe highest RNA input requirement (100-4000 ng) and it isthe most expensive whole transcriptome technology at twoto five times the cost of other approaches (Table 1). TheNanoString platform could be cost-effective for a smallnumber of genes, but compares poorly on price for largenumbers of genes (costed for maximum coverage in a single experiment: 770 genes). The newest and least expensivetechnologies are Affymetrix Clariom S array with WT Picokit and Lexogen QuantSeq. Success rate is an importantconsideration for clinical studies, particularly with beforeand on-treatment matched samples considered in thisstudy. Looking at the numbers of samples which have failedusing different technologies based on the respective manufacturers quality control criteria we found that success ratesfor generating robust expression profiles from FFPE tissueswere excellent ( 95%) for the latest Lexogen QuantSeq,Qiagen Qiaseq, BioSpyder TempO-Seq methods. This isdespite the RNA integrity number (RIN) values for freshfrozen tissue normally being above 7, but for FFPE tissueswere generally less than 3. However, success rate was moderate for the Ampliseq RNA Transcriptome (83%) and poorfor the older Illumina BeadChip (22%). By comparisonRNA from FF tissue had a high success rate (91–100%)To evaluate how newer technologies with desirable featuressuch as lower costs or RNA input requirements comparedto the more established methodologies, we profiled thesame RNA from a subset of samples to directly comparegene expression measurements across the platforms (Additonal file 1: Table S1). These comparisons have two purposes; firstly to determine whether the new technologyprovides similar quality results to the established method.Secondly, to evaluate whether it will be possible to directlyintegrate datasets generated on the new platform withexisting local or publicly available data from another platform, as we have done previously [3, 4, 6]. Indeed, while itis altruistic to minimise measurement error by using thesame platforms, with constantly evolving technologies andlower associated costs this is not often realistic. Therefore,the ability to implement approaches to increase validityacross platforms is of great importance.Not surprisingly, when all samples were integrated together low correlations (r 0.4–0.6) were observed betweenpairs of samples processed on different technologies. Hierarchical clustering showed clearly that gene expressionvalues group by technology and technical artefacts, ratherthan by genuine biology (Fig. 2a, left). Following batch correction using the well-established and highly cited ComBatmethod [17], correlations were much higher and the majority of ‘paired’ samples clustered together, indicating greatervariation between biological samples than between gene expression measurement platforms (Fig. 2a, right). Lookingmore closely, instances of the same time-point processedon different platforms clustered closely (if not together) anddifferent time points from the same patients showed variation (due to treatment), whilst also often clustering withother time points from the same patient (Fig. 2b), as hasbeen previously shown for sequential patient-matched
Turnbull et al. BMC BioinformaticsFig. 3 (See legend on next page.)(2020) 21:30Page 7 of 10
Turnbull et al. BMC Bioinformatics(2020) 21:30Page 8 of 10(See figure on previous page.)Fig. 3 Robust gene expression measurement across platforms following batch correction. Correction of systematic platform bias and integrationof data from fresh frozen and FFPE tissues. a 3D multi-dimensional scaling (MDS) before (left) and after (right) batch correction of 6844 commongenes. Samples coloured by platform and shapes indicates time point. b MDS plot of the batch corrected data with samples coloured by timepoint clearly demonstrates a consistent treatment effect seen across sequential patient-matched samples. c Ultrasound measurements of theeleven breast tumours which relate to the sequential patient-matched samples indicating consistent reductions in tumour volume over timeacross the patients. d Ranking patient samples by the expression of 42 common proliferation genes (listed in Additional file 2: Table S2) illustratesconsistent changes resulting from endocrine therapy, which appears to be independent from profiling platform. Pre-treatment samples tend tohave relatively high proliferation, whilst as expected early, and particularly late on-treatment samples have lower proliferation. Heatmap coloursare Red High, Green lowsamples [13]. These results are consistent with our previousresults showing a reduction in technical artifacts, withoutloss of biological variation [3].Clear batch effects were evident when comparing mRNAextracted from FF samples across Illumina HT12, IonAmpliseq Transcriptome and Affymetrix Clariom S, withlow Pearson correlations (r 0.4–0.58). However standardbatch correction approaches such as ComBat [17] minimised technical bias effect and increased correlation to r 0.9 for paired samples. Similar low correlations and improved correlations following batch correction wereobserved for different technologies with FFPE samples andfor comparisons of matched FF and FFPE or for the samesample across different platforms (Fig. 2c). Comparison ofmeasurements of the 56 overlapping genes assayed usingNanoString, whole-genome (Illumina HT12) and partgenome (Affymetrix U133A) expression microarrays werealso significantly improved following batch correction.Looking at the samples more closely by multidimensional scaling it is clear that whilst they cluster byplatform before batch correction (Fig. 3a), afterwardsthey do not (Fig. 3b) and more importantly, instead theycluster by time point (Fig. 3c). Pre-treatment samplesare most clearly separated from late on-treatment samples, with early on treatment samples in-between, aswould be expected.For further confirmation of the validity of the batchcorrected data, we ranked samples by expression of 42proliferation genes, previously reported by us [12] thatchange with endocrine therapy (list of gene provided inAdditional file 2: Table S2). Molecular changes in the tumours reflect the ultrasound measurements across theeleven breast tumours, concordant with consistent reductions in tumour volume over time across the patients (Fig.3c). Ranked by proliferation genes the samples are orderedby time point, consistent with our previous results [12],and not by platform or preservation method (Fig. 3b).These results suggest that comparable gene expressionprofiles can be generated across the platforms using FFPEmaterial and FFPE is a reliable alternative to FF (Fig. 3d).DiscussionOverall we find that gene expression data from the newertechnologies is largely concordant with that from the moreestablished methods. The newer 3′ sequencing approachesfrom Lexogen and Qiagen appear highly reliable and costeffective for old FFPE samples, this potentially allows valuable data to be generated from clinical samples that wouldnot have been previously possible. The TempO-Seqmethod [14] from BioSpyder is an interesting approach asyou can analyse expression without pre-amplification directly from a micro-dissected area of interest taken from asingle FFPE section, maximizing utilization of precious orlimited samples. Full RNAseq analysis is often consideredthe gold standard, however when tissue samples are particularly small or there is a desire to perform a range of assays or multi-omic approaches, the newer targetedsequencing approaches with many fold smaller input requirements may be a much more attractive proposition. Anumber of previous studies have conducted comparisons ofthe same samples generated from fresh and archived tissues[18, 19]. The numbers of detected genes from FFPE samples has previously been shown to be lower than from freshtissue [19], however protocols have continued to improve[10]. It is important to remember that in all pairwise tissuecomparisons where RNA is extracted separately that theycannot represent exactly the same material and are onlyever adjacent, leading to inevitable potential minor variations in tissue composition. Despite this, the wellestablished Combat method for batch correction [17] wasagain found to perform well to integrate data from differentsample types or technologies, this approach has been foundto be superior in a many of previous studies [20].A general finding of most platform comparison approaches is that although the correlation values between different microarray or sequencing approaches may be poor tomoderate, which may relate to differences in dynamic rangeof the technologies, there is generally very high concordancewhen considering differentially expressed genes [3, 6, 21]. Acomprehensive study of TCGA data found only 1.2% ofgenes were inconsistent by fold change [21]. A wider issuewith transcriptomic studies that there is no optimal analysispipeline for every single analysis [22].This single study perhaps considers the widest rangeof gene expression technologies using FF and FFPE tissues published to date, but we acknowledge that thisstudy documents a translational research group’s experiences, rather than being a definitive, comparison study.
Turnbull et al. BMC Bioinformatics(2020) 21:30Not every sample was tested on every platform andsome leading technologies remain to be tested, includingAgilent, TaqMan and Fluidigm - due to local availabilityand opportunities.ConclusionThis study highlights the relative merits and limitations ofa range of new and established gene expression profilingplatforms and demonstrates that transcriptomic data fromFFPE archival samples can be reliably integrated with datafrom FF samples, even if different measurement platformsare used. Ultimately, the choice of technology will dependupon the required resolution and coverage, throughput,sample quality, availability and budget.Supplementary informationSupplementary information accompanies this paper at https://doi.org/10.1186/s12859-020-3365-5.Page 9 of 10Ethics approval and consent to participateAll patients provided written informed consent and sample collection wasapproved by the local research ethics committee (Lothian NHS LocalResearch Ethics Committee 03, REC Reference number 07/S1103/26, approvaldate 13/08/2007).Consent for publicationNot applicable.Competing interestsThe authors declare that they have no competing interests.Author details1Applied Bioinformatics of Cancer, Cancer Research UK Edinburgh Centre,MRC Institute of Genetics and Molecular Medicine, Edinburgh, UK.2Edinburgh Breast Unit, Western General Hospital, Edinburgh, UK.3Department of Pharmacology, Faculty of Pharmacy, Ege University, 35040Izmir, Turkey. 4Usher Institute of Population Health Sciences and Informatics,Old Medical School, Teviot Place, Edinburgh, UK. 5Lineberger ComprehensiveCancer Center, University of North Carolina, Chapel Hill, NC, USA. 6Host andTumour Profiling Unit, Cancer Research UK Edinburgh Centre, MRC Instituteof Genetics and Molecular Medicine, University of Edinburgh, Edinburgh, UK.7Edinburgh Clinical Research Facility, Western General Hospital, Edinburgh,UK.Additional file 1 : Table S1. Table demonstrating the directlyoverlapping samples across the nine gene expression platforms colouredby sample type, Pink FFPE, yellow fresh frozen.Received: 4 July 2019 Accepted: 14 January 2020Additional file 2 : Table S2. List of the 42 proliferation-related genesshowing reduction on endocrine treatment [12].References1. Sims AH. Bioinformatics and breast cancer: what can high-throughputgenomic approaches actually tell us? J Clin Pathol. 2009;62:879–85.2. Robert C, Watson M. Errors in RNA-Seq quantification affect genes ofrelevance to human disease. Genome Biol. 2015;16:177.3. Turnbull AK, Kitchen RR, Larionov A, Renshaw L, Dixon JM, Sims AH. Directintegration of intensity-level data from Affymetrix and Illumina microarraysimproves statistical power for robust reanalysis. BMC Med Genet. 2012;5:35.4. Sims AH, Smethurst GJ, Hey Y, Okoniewski MJ, Pepper SD, Howell A, MillerCJ, Clarke RB. The removal of multiplicative, systematic bias allowsintegration of breast cancer gene expression datasets - improving metaanalysis and prediction of prognosis. BMC Med Genet. 2008;1:42.5. Leek JT, Scharpf RB, Bravo HC, Simcha D, Langmead B, Johnson WE, GemanD, Baggerly K, Irizarry RA. Tackling the widespread and critical impact ofbatch effects in high-throughput data. Nat Rev Genet. 2010;11:733–9.6. Kitchen RR, Sabine VS, Simen AA, Dixon JM, Bartlett JM, Sims AH. Relativeimpact of key sources of systematic noise in Affymetrix and Illumina geneexpression microarray experiments. BMC Genomics. 2011;12:589.7. Shi L, Reid LH, Jones WD, Shippy R, Warrington JA, Baker SC, Collins PJ, deLongueville F, Kawasaki ES, Lee KY, et al. The MicroArray quality control(MAQC) project shows inter- and intraplatform reproducibility of geneexpression measurements. Nat Biotechnol. 2006;24:1151–61.8. Lin S-H, Beane L, Chasse D, Zhu KW, Mathey-Prevot B, Chang JT. Cross-platformprediction of gene expression signatures. PLoS One. 2013;8:–e79228.9. Larsen MJ, Thomassen M, Tan Q, Sørensen KP, Kruse TA. Microarray-basedRNA profiling of breast Cancer: batch effect removal improves crossplatform consistency. Biomed Res Int. 2014;2014:1–11.10. Kokkat TJ, Patel MS, McGarvey D, LiVolsi VA, Baloch ZW. Archived formalinfixed paraffin-embedded (FFPE) blocks: a valuable underexploited resourcefor extraction of DNA, RNA, and protein. Biopreserv Biobank. 2013;11:101–6.11. Stewart JP, Richman S, Maughan T, Lawler M, Dunne PD, Salto-Tellez M.Standardising RNA profiling based biomarker application in cancer—theneed for robust control of technical variables. Biochim Biophys Acta - RevCancer. 2017;1868:258–72.12. Miller WR, Larionov A, Renshaw L, Anderson TJ, Walker JR, Krause A, Sing T, EvansDB, Dixon JM. Gene expression profile
paraffin embedded (FFPE) tissues are in demand [ 10]. FFPE tissues are available routinely in the clinical setting and can be stored at ambient temperature for many years, allowing easy transportation. A large number of studies have com-pared matched FF and FFPE samples, with some reporting reduced efficacy or numbers of detected transcripts and