Transcription
NIRS-SPM: Statistical Parametric Mappingfor Near-infrared SpectroscopyVersion 4User’s GuideRelease December 16th, 2011Sungho Tak, Ph.DBio Imaging Signal Processing (BISP) Lab.Dept. of Bio and Brain Engineering, KAISTKorea1
Copyright 2011, Sungho Tak and Jong Chul Ye, KAISTNIRS-SPM is free software; you can distribute it and/ or modify it under the terms of theGNU General Public License (GPL) as publishing by the Free Software Foundation, eitherversion 3 of the License, or any later version. For the copy of the GNU General PublicLicense, see http://www.gnu.org/licenses/ Additional Note from AuthorsYou can get the software freely – including source code – by downloading it here. Weappreciate if you cite the following papers in producing the results using NIRS-SPMtoolbox.[1] Ye, J. C., Tak, S., Jang, K. E., Jung, J., Jang, J., 2009, NIRS-SPM: Statisticalparametric mapping for near-infrared spectroscopy. NeuroImage 44, 428-447.[2] Jang, K. E., Tak, S., Jung, J., Jang, J., Jeong, Y., and Ye, J. C., 2009, Wavelet-MDLdetrending for near-infrared spectroscopy (NIRS),” Journal of Biomedical Optics, vol.14, no. 3, pp. 1-13.[3] Tak, S., Jang, J., Lee, K., and Ye, J. C., 2010, Quantification of CMRO2 withouthypercapnia using simultaneous near-infrared spectroscopy and fMRI measurements.Physics. Med. Biol. 55, 3249-3269.[4] Tak, S., Yoon, S. J., Jang, J. Yoo, K., Jeong, Y., and Ye, J. C., 2011, Quantitativeanalysis of hemodynamic and metabolic changes in subcortical vascular dementia usingsimultaneous near-infrared spectroscopy and fMRI measurements. NeuroImage 55, 176184.[5] Li, H., Tak, S., and Ye, J.C., 2012. Lipschitz Killing curvature based expected Eulercharacteristics for p-value correction in fNIRS. J. Neurosci. Meth. 204, 61-67.NIRS-SPM is a SPM5 (http://www.fil.ion.ucl.ac.uk/spm/) and MATLAB-based softwarepackage for statistical analysis of near-infrared spectroscopy (NIRS) signals. Based on thegeneral linear model (GLM), and Sun’s tube formula / Lipschitz-Killing curvature (LKC)based expected Euler characteristics, NIRS-SPM not only provides activation maps of oxyhemoglobin (HbO), deoxy-hemoglobin (HbR), and total-hemoglobin (HbT), but also allowsfor super-resolution activation localization. More details are described in Ye et al., 2009 andLi et al., 2012.To remove the unknown global trends due to breathing, cardiac, vaso-motion, or otherexperimental errors, NIRS-SPM provides a wavelet-minimum description length (MDL)detrending algorithm (Jang et al., 2009).In addition, we have developed a method to estimate cerebral metabolic rate of oxygen(CMRO2) without hypercapnia by using simultaneous measurements of NIRS and fMRI (Taket al., 2010). Using the optimization framework, many assumed parameters such as baselinehemoglobin concentration and hypercapnia can be readily estimated, which promise moreaccurate estimation of cerebral blood flow (CBF) and CMRO2.H2
Some specific features of the NIRS-SPM software package are as follows:1. NIRS file format: NIRS-SPM was initially developed for the analysis of optical datafrom the continuous wave 24-channel NIRS system (OXYMON MKⅢ, Artinis). NIRSSPM has been recently updated for analyzing the optical density data from the othersystems including the ETG 4000 (Hitachi Medical Systems), the ImagentTM (ISS,Champaign, Illinois), the NIRO 200 (Hamamatsu Photonics), DYNOT-232 (NIRxMedical Technologies, LLC.), Spectratech OEG-16, FOIRE-3000 (Shimadzu OMM),fNIR (BIOPAC Systems, Inc.), and CW6 (Techen Inc.). Furthermore, NIRS-SPM allowsfor the optical density changes or HbO, HbR concentration changes as for the manualinput of HbO and HbR. To read other NIRS data formats from other venders, please senda data set and file format to shtak@kaist.ac.kr. We will update NIRS-SPM packages toinclude the data format.2. Spatial registration of NIRS channel locations: NIRS-fMRI alignment:NIRS channel positions in real coordinates obtained from a 3D digitizer are localizedonto the cerebral cortex of an anatomical MR image using Horn's algorithm (Horn,1987). At least three measured real coordinates of reference positions, such as amarker capsule, nasion, and inion, are necessary to elicit the relationship between theMR coordinates and real coordinates in the 3-D digitizer. Real coordinates ofreference positions and optodes should be saved in a Microsoft Excel 97-2003 fileformat (.xls) or a text file format (.txt). Specifically, column indexes are x, y, and zcoordinates, respectively. (Please refer to the sample Excel or text file.)NIRS-SPM provides several channel configurations such as:1) OXYMON MKⅢ 4x4 (1set), 2) ETG 4000 3x11 (1set), 3) ETG 4000 4x4 (2sets),4) ETG 4000 3x5 (2sets). Stand-alone NIRS:The spatial registration of NIRS channels to MNI space with MNI coordinate input isavailable. NIRS-SPM provides two methods for receiving MNI coordinates: 1)manual input of MNI coordinate, 2) choice of MNI coordinates from SPM templateimages. Also, NIRS-SPM allows the spatial registration of NIRS channels to MNIspace without MRI using NFRI’ fNIRS tools (Singh et al., 2005).3. Wavelet-MDL detrending: Wavelet-MDL detrending algorithm effectively removes anunknown global trend due to breathing, cardiac, vaso-motion, or other experimentalerrors. Specifically, the wavelet transform is applied to decompose NIRS measurementsinto global trends, hemodynamic signals and uncorrelated noise components as distinctscales. The minimum description length (MDL) principle thereupon plays an importantrole in preventing over- or under- fitting and facilitates optimal model order selection forthe global trend estimate. (See Jang et al., 2009)4. In estimating the temporal correlations, NIRS-SPM provides both precoloring andprewhitening methods. In our data set, we showed that precoloring is more appropriatefor estimating temporal correlation of NIRS data than the prewhitening method. Hence,we recommend using the precoloring method. (See Ye et al., 2009). In addition, channel3
residual covariance estimation was modified to consider channel-wise least-squareresidual correlation (See Li et al., 2012).5. In making inference about brain activation, NIRS-SPM provides Sun's tube formulaand Lipschitz-Killing curvature based expected Euler characteristics for p-valuecorrection. In the case of Sun's tube formula correction, p-values are calculated as theexcursion probability of an inhomogeneous random field on a representation manifoldthat is dependent on the structure of the error covariance matrix and the interpolatingkernels. However, Sun’s tube formula cannot be used for general random fields such asF-statistics from either individual or group analysis. To overcome these difficulties, wealso provide the expected Euler characteristic approach based on Lipschitz-Killingcurvature to control the family-wise error rate.6. CMRO2 estimation without hypercapnia: Estimation of the CMRO2 and CBF isimportant to investigate the neurovascular coupling and physiological components inblood oxygenation level dependent (BOLD) signals quantitatively. Using an optimizationframework that minimizes the differences between two-forms of relative CMRO2-CBFcoupling ratio from BOLD and NIRS biophysical models, unknown model parametersincluding hypercapnia and baseline hemoglobin concentrations are readily optimized.CMRO2 and CBF relative to its baseline are then estimated accurately (See Tak et al.,2010).7. In NIRS-SPM, a fMRI-BOLD activation map that has been analyzed using SPM5 canbe simultaneously visualized and compared with the NIRS activation map. Software Requirements1. MATLAB (Mathworks, Natick, MA, http://www.mathworks.com). The Image ProcessingToolbox is required.SPM5 or SPM8 (Welcome Department of Cognitive Neurology in London). It can befreely downloaded from: http://www.fil.ion.ucl.ac.uk/spm/software/. Hardware RequirementsNIRS-SPM has been developed and tested on Intel Pentium 4 CPU 3.00 GHz, 2.00GB RAM. However, NIRS-SPM will work on any computer with MATLAB 7 withapproximately 2.0 GB RAM.Note that the process for estimating temporal correlations requires large amount ofmemory. Depending on total recording time, more than 2.0 GB RAM will be required. AcknowledgementThis research is supported by the IT R&D program of MKE/IITA [2008-F-021-01]. Thisresearch is also supported by the Korea Science and Engineering Foundation (KOSEF) grantfunded by the Korea government (MEST) (No. 2009-0081089). UpdatesAlthough we have endeavored to develop NIRS-SPM as accurate and high quality software,there remains the possibility of some bugs. Please assist us by reporting any bugs toshtak@kaist.ac.kr. Reported bugs will be fixed in the next version of the NIRS-SPM.4
Download and Installation InstructionsIn order to download NIRS-SPM software and sample data sets, registration is required(http://bisp.kaist.ac.kr/NIRS-SPM).After uncompressing the ‘NIRS SPM v4.zip’ file, ‘NIRS SPM v4’, ‘batch file’,‘nfri functions’, ‘Sample data’, and ‘Documentation’ directories will be created. Then, add1) NIRS-SPM v4 directories with sub-folders, 2) spm5 directories with sub-folders in theMATLAB path. Sample Datasets1. NIRS data filesi.ii.iii.iv.v.vi.vii.viii.ix.x.xi.OXYMON MKⅢ sample data‘ \Sample data\NIRS data file\Artinis OXYMON SampleData.nir’Sample data were measured using OXYMON MKⅢ (24 channels, samplingfrequency of 9.75 Hz). The specific behavior protocol is as follows: an initial 12swas for signal equilibrium (E). A 21-second period of finger tapping task (Finger)alternated with a 30-second period of rest (Rest); E-Rest-(Finger-Rest) x 10 repeat.The total recording time was 552 s.Hitachi ETG 4000 sample data (1set)‘ \Sample data\NIRS data file\Hitachi ETG4000 SampleData.csv’Hitachi ETG 4000 sample data (2set)‘ \Sample data\NIRS data file\Hitachi ETG4000 Set1.csv’‘ \Sample data\NIRS data file\Hitachi ETG4000 Set2.csv’ISS ImagentTM sample data ‘ \Sample data\NIRS data file\ISS Imagent SampleData.log’NIRX DYNOT-232 sample data‘ \Sample data\NIRS data file\NIRX DYNOT232 Set1.wl1’ and‘ \Sample data\NIRS data file\NIRX DYNOT232 Set2.wl2’Spectratech OEG-16 sample data‘ \Sample data\NIRS data file\Spectratech OEG16 SampleData.csv’Shimadzu OMM FOIRE-3000 sample data‘ \Sample data\NIRS data file\Shimadzu FT Right 4x4x2.TXT’BIOPAC fNIR sample data‘ \Sample data\NIRS data file\BIOPAC fNIR SampleData.oxy’Techen CW6 sample data‘ \Sample data\NIRS data file\Techen CW6 SampleData.nir’‘ \Sample data\NIRS data file\CW6 Hbdata from HomER.mat’Optical density changes sample data ‘ \Sample data\NIRS data file\OpticalDensity SampleData.csv’Converted HbO and HbR changes sample data‘ \Sample data\NIRS data file\HbO HbR SampleData.csv’2. Spatial registration filesi.Real coordinates of reference positions and optodes‘ \Sample data\Registration\RealCoordinates xls format.xls’‘ \Sample data\Registration\RealCoordinates txt format.txt’Excel\text file that contains real coordinates of 4 reference positions and 16 optodepositions.5
ii. Sample result file : ‘ \Sample data\Registration\channel NIRS fMRI.mat’MNI coordinates of 12 optodes and corresponding 14 channels (for Stand-aloneNIRS)‘ \Sample data\Registration\MNI standalone optd Singh05 NeuroImage.txt’‘ \Sample data\Registration\MNI standalone ch Singh05 NeuroImage.txt’ Sample result file : ‘ \Sample data\Registration\channel standalone.mat’MNI coordinates of optodes and channels was given by Singh et al., 2005.3. Ch config folder : Folder that contains several channel configurations.4. T1 MRimage folder : Folder that contains anatomical (normalized) MR image.i.Sample anatomical image‘ \Sample data\T1 MRimage\uniform.img, .hdr’ii.Normalized anatomical image‘ \Sample data\T1 MRimage\wuniform.img, .hdr’iii.Normalization parameters‘ \Sample data\T1 MRimage\uniform sn.mat’5. fMRI result folder: Folder that contains fMRI-SPM result files. fMRI data wassimultaneously measured with NIRS data.6. CMRO2 Est folder: Folder that contains sample dataset for estimating the CMRO2without hypercapnia from simultaneous fMRI and NIRS measurements.6
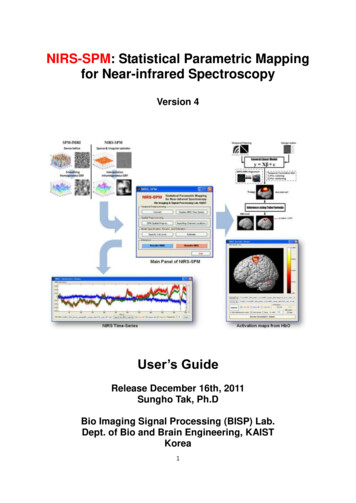
How to startIn order to run NIRS-SPM, MATLAB, spm5 (or spm 8), and NFRI’ fNIRS softwareshould be available on your system.Please download the spm5 from http://www.fil.ion.ucl.ac.uk/spm/software/Then, add 1) NIRS-SPM directories with sub-folders, 2) spm5 directories with subfolders in the MATLAB path.Start up MATLAB and type ‘NIRS SPM’ at the MATLAB command window. The mainpanel of NIRS-SPM will then open. Analysis takes place in six stages (1) converting theoptical densities to concentration changes of oxy- and deoxy- hemoglobin, (2) spaticalregistration of NIRS channel locations, (3) model specification, (4) detrending theunwanted global trends using wavelet-MDL algorithm or discrete cosine transform(DCT)-based high pass filtering , (5) temporal correlation estimation from precoloring orprewhitening method, (6) high resolution visualization of activated regrion from variousfunctional contrasts (HbO, HbR, and HbT).Fig. 1. Main panel of NIRS-SPM.7
ConvertIn the ‘Convert’ routine, the modified Beer-Lambert law (Cope and Delpy, 1988) is usedto calculate the concentration changes of oxy- and deoxy- hemoglobin from opticaldensity changes. Calculated oxy- and deoxy- hemoglobin concentration changes ( M )will be saved as a ‘*.mat’ file.NIRS-SPM was initially developed for the analysis of optical data from the continuouswave 24-channel NIRS system (Oxymon MKIII, Artinis). NIRS-SPM has been recentlyupdated for analyzing the optical density from the other system including the ETG 4000(Hitachi Medical Systems), the ImagentTM(ISS, Champaign, Illinois), the NIRO 200(Hamamatsu Photonics), the DYNOT-232 (NIRx Medical Technologies, LLC.),Spectratech OEG-16, FOIRE-3000 (Shimadzu OMM) system, fNIR (BIOPAC Systems,Inc.), and CW6 (Techen Inc.). Furthermore, NIRS-SPM allows for the optical densitychanges or HbO, HbR concentration changes as for the manual input of HbO and HbR.To read other NIRS data formats from other venders, please send a data set and fileformat to shtak@kaist.ac.kr. We will update NIRS-SPM packages to include the dataformat.Select the ‘Convert’ button in the main panel. ‘NIRS Data Conversion’ window willthen open. OXYMON MKⅢ 24 channel system1. Select the ‘System configuration’ checkbox, and choose the ‘OXYMON MKⅢ’ fromthe pop-up menu.2. Highlight ‘Sampling freq.[Hz]’ and enter the corresponding sampling frequency e.g.,9.75.3. Highlight ‘Distance[cm]’ which means the distance between the source and thedetector and enter a specific value e.g., 3.5.4. Highlight ‘Wave length [nm]’ which means the wavelength of the light sources. Then,enter a specific value e.g., 856 781.5. Highlight ‘DPF’ which means the differential pathlength factor and enter a specificvalue e.g., 4.6. Highlight ‘correction’ checkbox and choose the checkbox if you want to correct forthe wavelength dependency of the differential pathlength factor (DPF). Note thatNIRS-SPM allows the wavelength range of DPF correction between 704 nm and 972nm.7. Select ‘Load’ button. Use the dialog box to choose the optical density change files;e.g. \Sample data\NIRS data file\Artinis OXYMON SampleData.nir. Then, theconversion process starts automatically.NIRS-SPM supports three types of data format for OXYMON MKIII system:1) *.nir file (optical density changes)If the events exist, NIRS-SPM will start reading the dataline with the event ‘Astart’ and finish reading the dataline with the event ‘B end’.If the event does not exist, NIRS-SPM will read all data lines.2) *.xls file (hemoglobin concentration changes)In the ‘NIRS Data Conversion’ window, enter the sampling frequency and8
select ‘Load’ button to choose the *.xls file,e.g. \Sample data\NIRS data file\Artinis OXYMON Hb.xls. The selectedfile will then open in an Excel window. To import the oxy-Hb and deoxy-Hbconcentration changes, select the worksheet in the Excel window, drag and dropthe mouse over the desired range, e.g. B68:Y628, and then click OK.3) *.txt or *.csv file (hemoglobin concentration changes)Because the way to read *.xls file is complicated, we recommend the followingprocess: export the Hb changes as *.txt file, or using the Excel program, save*.xls file as *.csv file.In the ‘NIRS Data Conversion’ window, select the ‘Load’ button and choose the*.txt or *.csv file, .\NIRS data file\Artinis OXYMON Hb.csv. NIRS-SPMwill then read the Hb changes automatically.8. Select ‘Save’ button. Save the concentration changes of oxy- and deoxy-hemoglobin,e.g., \Sample data\NIRS data file\Artinis OXYMON converted data.mat Hitachi ETG-4000 System (1set)1. Select the ‘System Configuration’ checkbox, and choose the ‘Hitachi ETG-4000(1set)’ from the pop-up menu.2. Select ‘Load’ button. Use the dialog box to choose the optical density change file;e.g. \Sample data\NIRS data file\Hitachi ETG4000 SampleData.csv.Then, conversion process starts automatically.3. Note that ‘Sampling frequency’ and ‘Total number of channels’ will be read out inthe Hitachi ETG4000 SampleData.csv. Hitachi ETG-4000 System (2set)1. Select the ‘System Configuration’ checkbox, and choose the ‘Hitachi ETG-4000(2set)’ from the pop-up menu.2. Select ‘Load’ button. Use the dialog box to choose the optical density file from thefirst set of optodes; e.g., \Sample data\NIRS data file\Hitachi ETG4000 Set1.csvThen, conversion process for the first file starts automatically.3. Use the dialog box to choose the optical density file from the second set of optodes;e.g.,.\Sample data\NIRS data file\Hitachi ETG4000 Set2.csv. Then, conversionprocess for the second file starts automatically.4. Note that ‘Sampling frequency’ and ‘Total number of channels’ will be read out inthe data file. ISS ImagentTM System1. Select the ‘System Configuration’ checkbox, and choose the ‘ISS Imagent’ from thepop-up menu.2. Select ‘Load’ button. Use the dialog box to choose the converted HbO and HbRconcentration change file;e.g. \Sample data\NIRS data file\ISS Imagent SampleData.log.Then, load data operation starts automatically. Note that ‘Sampling frequency’ willbe set to be the inverse of average value of sampling interval and ‘Total number ofchannels’ will be read out. Sampling frequency can be manually changed. Hamamatsu Photonics NIRO-200 System1. Select the ‘System Configuration’ checkbox, and chose the ‘Hamamatsu NIRO-200’9
from the pop-up menu.2. Select ‘Load’ button. Use the dialog box to choose the converted HbO and HbRconcentration change file (e.g., ‘*.NI2’ file).Then, the operation which loads the data automatically starts. NIRx Medical Technologies DYNOT-232 System1. Select the ‘System Configuration’ checkbox, and choose the ‘NIRX DYNOT-232’from the pop-up menu.2. Highlight ‘Total number of Ch.’ and enter the corresponding the total number ofchannels e.g., 80.3. Highlight ‘Sampling freq.[Hz]’ and enter the corresponding sampling frequency, e.g.,2.44.4. Highlight ‘Distance[cm]’ which means the distance between the source and detectorand enter a specific value e.g., 2.5.5. Highlight ‘Wave length [nm]’ which means the wavelength of the light sources. Then,enter a specific value e.g., 760 830.6. Highlight ‘DPF’ which means the differential pathlength factor and enter a specificvalue e.g., 7.15 5.98.7. Highlight ‘Extinc. Coeff.’ which means the extinction coefficient and enter a specificvalue e.g., 1.4866 3.8437 2.2314 1.7917.Note that the order of DPF should be the same as the order of wave length and theorder of extinction coefficients should be the extinction coefficient of HbO and HbR.e.g. for 760 nm wavelength : DPF : 7.15, extinction coefficients of HbO : 1.4866 andHbR : 3.8437. for 830 nm wavelength : DPF : 5.98, extinction coefficients of HbO :2.2314 and HbR : 1.7917.8. Select the ‘Load Ch. Configuration’ button and choose the ‘*.mat’ file or ‘*.txt’ fileto contain the arrangement of channels.If you select the ‘ \Sample data\NIRS data file\NIRX DYNOT232 example.mat’file, NIRS-SPM will automatically find the channel configuration from the field‘ni.IMGlabel’.If you want to load the channel configuration as the text file, please see the dataformat from the sample file(e.g. \Sample data\Ch config\NIRX DYNOT232 20x32 80ch.txt’ file) or see,for example, Appendix I – channel configuration.9. Select ‘Load’ button and choose the ‘*.wl1’ and ‘*.wl2’ files, sequentially.e.g.,.\Sample data\NIRS data file\NIRX DYNOT232 Set1.wl1, \Sample data\NIRS data file\NIRX DYNOT232 Set2.wl2.Then, the conversion process starts automatically. Spectratech OEG-16 System1. Select the ‘System Configuration’ checkbox and choose the ‘Spectratech OEG-16’from the pop-up menu.2. Highlight ‘Sampling freq.[Hz]’ and enter the corresponding sampling frequency.3. Select ‘Load’ button and choose the converted HbO and HbR concentration changefile; e.g., \Sample data\NIRS data file\OEG16Sample.csv. Then, the operationwhich loads the data automatically starts.10
Shimadzu OMM FOIRE-3000 System1. Select the ‘System Configuration’ checkbox and choose the ‘ShimadzuOMM.FOIRE-3000’ from the pop-up menu.2. Select ‘Load’ button and choose the converted HbO, HbR, and HbT concentrationchange file; e.g., \Sample data\NIRS data file\Shimadzu FT Right 4x4x2.TXT.Then, the operation which loads the data automatically starts.For FOIRE-3000 system users, there is an instruction which introduces wholeprocess of NIRS-SPM from data conversion of FOIRE-3000 to activation mapping.Please refer to an instruction file written by Akihiro Ishikawa, Shimadzu Corporation,Japan. e.g \Documentation\ Instruction FOIRE 3000 user.pdf BIOPAC fNIR System1. Select the ‘System Configuration’ checkbox and choose the ‘BIOPAC fNIR’ from thepop-up menu.2. Select ‘Load’ button and choose the converted HbO and HbR concentration changefile; e.g. \Sample data\NIRS data file\ BIOPAC fNIR SampleData.oxy.Then, the operation which loads the data automatically starts. Techen Inc. CW6 SystemTo calculate the hemoglobin concentration changes from CW6 data, /homer/home.htm, Huppert et al.,2009) software is required.1. Using HomER software, convert the optical density changes (*.nir file) tohemoglobin concentration changes and export them to *.mat file. Specifically,1) Raw data, e.g. \Sample data\NIRS data file\Techen CW6 SampleData.nir,can be loaded into HomER by selecting the ‘Import Data’ command from theFiles pull-down menu (page 27, HomER user’s guide).2) In ‘Filtering Menu’, specify the cutoff frequency of low-pass filter (LPF) andhigh-pass filter (HPF) as 0 (Hz), and select the ‘Update File’ button.3) Click the window for probe geometry (page 5, HomER user’s guide).4) In ‘Data Display Controls’, choose ‘delta Concentrations’ from the pop-up menu.5) In the figure plotting Hb concentration changes, click the right mouse button.Then, select ‘Export all channels to file’. Save Hb concentration changes as*.mat file;e.g. \Sample data\NIRS data file\CW6 Hbdata from HomER.mat.2. Using NIRS-SPM software,1) In the ‘NIRS Data Conversion’ window, select the ‘System Configuration’checkbox and choose the ‘HomER Software’ from the pop-up menu.2) Select the ‘Load’ button. First, use the dialog box to choose *.nir file, e.g. \Sample data\NIRS data file\Techen CW6 SampleData.nir, which providesthe model parameters and channel configuration.Second, use the dialog box to choose *.mat file,e.g. \Sample data\NIRS data file\CW6 Hbdata from HomER.mat,which provides the hemoglobin concentration changes. Then, the operationloading the data automatically starts.3) Select ‘Save’ button. Save the channel configuration as *.txt file, which will beused in the step of ‘Spatial registration of NIRS channels’. Then, save thehemoglobin changes as *.mat file.11
Direct input of the optical density changes1. Select the ‘Manual Input’ checkbox, and choose the ‘Optical density changes’ fromthe popup menu.2. To specify all the parameters used in modified Beer-Lambert law, NIRS-SPMprovides two options;1) load the *.txt or *.csv file which contains the parameters. Specifically, select‘Load parameters’ button. Use the dialog box to choose the parameter file; e.g., \Sample data\NIRS data file\Sample Parameters.txt.2) directly enter the parameters in ‘Data Conversion’ window.Highlight ‘Total number of Ch.’ and enter the total number of channels, e.g., 24.Highlight ‘Sampling freq.[Hz]’ and enter the corresponding sampling frequency, e.g.,9.75.Highlight ‘Distance[cm]’ which means the distance between the source and thedetector and enter a specific value, e.g., 3.5.Highlight ‘Wave length[nm]’ which means the wavelength of the light sources. Then,enter a specific value, e.g., 856 781. Note that the order of wavelength should be thesame as the order of wavelength saved in the optical density file (λ1, λ2).Highlight ‘DPF’ which means the differential pathlength factor and enter a specificvalue, e.g., 4.Highlight ‘correction’ checkbox and choose the checkbox if you want to correct forthe wavelength dependency of the differential pathlength factor (DPF). Note thatNIRS-SPM allows the wavelength range of DPF correction between 704 nm and 972nm.Highlight ‘Extinc. Coeff. [uM-1mm-1] which means the extinction coefficient andenter a specific value, e.g.,for 856nm wavelength, extinction coefficient of HbO: 1.1885 and HbR: 0.7923,for 781nm wavelength, extinction coefficient of HbO: 0.7422 and HbR: 1.0803,the input should be 1.1885 0.7923 0.7422 1.0803.Note that if you don’t know extinction coefficient values, please leave it blank.From a table of extinction coefficient depending on wavelength (Mark Cope), NIRSSPM will then find the optimal value of extinction coefficient.NIRS-SPM allows channel wise input of source-detector distance, DPF, wavelength,and extinction coefficient. The value of each parameter (i.e., the source-detectordistance) on the specific channel can be entered into the input dialog. The order ofparameter values should be the same as the order of channels. Please refer to thesample files; e.g., \Sample data\NIRS data file\Sample Parameters.txt.3. Select ‘Load’ button. Use the dialog box to choose the optical density change files(.txt or .csv); e.g. \Sample data\NIRS data file\OpticalDensity SampleData.csv.Then, the conversion process starts automatically.Optical density changes ( OD) file format is as follows: OD(λ1, Ch1) OD(λ2, Ch1) OD(λ1, Ch2) OD(λ2, Ch2)-0.00650.0187000.00230.0250.0352-0.024512
ere OD is optical density changes, λ1 is the first wavelength of light sources, λ2is the second wavelength of light sources, and Ch is the number of channels. Direct input of the HbO and HbR concentration changes1. Select the ‘Manual Input’ checkbox, and choose the ‘Converted HbO and HbRchanges’ from the pop-up menu.2. Highlight ‘Sampling freq.[Hz]’ and enter a specific value e.g., 9.75.3. Select ‘Load’ button. Use the dialog box to choose the HbO and HbR concentrationchange files (.txt or .csv);e.g. .\Sample data\NIRS data file\HbO HbR SampleData.csv.Then, load data operation starts automatically.HbO, HbR concentration changes ( HbO, HbR) file format is as follows: HbO(Ch1) HbR(Ch1) HbO(Ch2) 0330.01870.00570.00630.010.0693-0.0165-0.0245where HbO is the oxy-hemoglobin concentration changes, HbR is the deoxyhemoglobin concentration changes, and Ch is the number of channel.Select ‘Save’ button. Save the concentration changes of oxy- and deoxy-hemoglobin e.g.,converted NIRS.mat.Fig. 2. The window for ‘Convert’ routine.13
Spatial Registration ofNIRS Channel LocationsNIRS-SPM allows the spatial registration of NIRS channels to MNI space with MRI (Yeet al., 2009; Horn et al., 1987) and without MRI (Singh et al., 2005) using 3D digitizer.Furthermore, the spatial registration of NIRS channels to MNI space with MRIcoordinate input (for standalone) is available. NIRS-fMRI alignmentThe relationship between the MR coordinates and the real coordinates in a 3-Ddigitizer is investigated from Horn’s algorithm (Horn, 1987). The NIRS channelpositions in real coordinates are then localized onto the cerebral cortex of ananatomical MR image. At least three measured real coordinates of reference positions,such as a marker capsule, nasion, and inion are necessary to elicit the relationshipbetween the MR coordinates and real coordinates. Real coordinates of referencepositions and optodes should be saved in a Mircosoft Excel 97-2003 file format (.xls)or a text file format (.txt). Specifically, row indexes are x, y, and z coordinates,respectively.(Please refer to the sample excel file e.g., RealCoordinates xls format.xls)1. Choose the ‘With MRI’ checkbox and select the ‘Spatial Registration’ button of themain panel. ‘Indicator Locations’ window will then open.2. Setup for real coordinates:1) In the ‘Indicator Locations’ window, select the ‘Load Real Coordinates’ and theinput window will then open. Highlight ‘# of reference (marker)’ and enter thenumber of reference points (markers), e.g. 4.2) Highlight ‘# of optodes’ and enter the number of optodes, e.g., 16.3) Use the file selector to choose the Microsoft Excel or text file that contains realpositions of references and optodes,e.g., \Sample data\Registration\RealCoordinates xls format.xlsExcel file format is as follows:14
The first column is x coordinates, the second column is y coordinates, and thethird column is z coordinates. From the first row, the real coordinates ofreference positions should be saved, and then those of optode positions should besaved in a Microsoft Excel 97-2003 file or text file format.4) Use the file selector to choose the file containing the information of channelconfiguration; e.g. .\Ch config\Artinis OXYMON 4x4 24ch.txt.Appendix I describes the channel configurations in detail.3. Load the anatomical MR images for obtaining the information of MNI coordinates ofreferences.1) Select the ‘MR Image’ butt
reference positions and optodes should be saved in a Microsoft Excel 97-2003 file format (.xls) or a text file format (.txt). Specifically, column indexes are x, y, and z . choice of MNI coordinates from SPM template images. Also, NIRS-SPM allows the spatial registration of NIRS channels to MNI . \Sample_data\Registration\MNI_standalone .