Transcription
S TATISTICAL ANALYSIS USING SPSSAnne Schad Bergsaker24. September 2020
B EFORE WE BEGIN .
L EARNINGGOALS1. Know about the most common tests that are used instatistical analysis2. Know the difference between parametric andnon-parametric tests3. Know which statistical tests to use in different situations4. Know when you should use robust methods5. Know how to interpret the results from a test done inSPSS, and know if a model you have made is good or not1
T ECHNICALPREREQUISITESIf you have not got SPSS installed on your own device, useremote desktop, by going to view.uio.no.The data files used for examples are from the SPSS survivalmanual. These files can be downloaded as a single .zip filefrom the course website.Try to do what I do, and follow the same steps. If you missed astep or have a question, don’t hesitate to ask.2
T YPICALPREREQUISITES / ASSUMPTIONS FORANALYSES
W HATTYPE OF STUDY WILL YOU DO ?There are (in general) two types of studies: controlled studiesand observational studies.In the former you run a study where you either have parallelgroups with different experimental conditions (independent), oryou let everyone start out the same and then actively changethe conditions for all participants during the experiment(longitudinal).Observational studies involves observing without intervening, tolook for correlations. Keep in mind that these studies can nottell you anything about cause and effect, but simplyco-occurence.3
R ANDOMNESSAll cases/participants in a data set should as far as it ispossible, be a random sample. This assumption is at the heartof statistics.If you do not have a random sample, you will have problemswith unforeseen sources of error, and it will be more difficult todraw general conclusions, since you can no longer assume thatyour sample is representative of the population as a whole.4
I NDEPENDENCEMeasurements from the same person will not be independent.Measurements from individuals who belong to a group, e.g.members of a family, can influence each other, and maytherefore not necessarily be independent.In regular linear regression analysis data needs to beindependent.For t-tests and ANOVA there are special solutions if you havedata from the same person at different points in time or underdifferent test conditions.It is a little more complicated to get around the issue ofindividuals who have been allowed to influence each other. Itcan be done, but it is beyond the scope of this course.5
O UTLIERSExtreme values that stand out from the rest of the data, or datafrom a different population, will always make it more difficult tomake good models, as these single points will not fit well withthe model, while at the same time, they may have a greatinfluence on the model itself.If you have outliers, you may want to consider transforming ortrimming (remove the top and bottom 5%, 10%, etc) your dataset, or you can remove single points (if it seems like these aremeasurement errors). Alternatively, you can use more robustmethods that are less affected by outliers.If you do remove points or change your data set, you have toexplain why you do it. It is not enough to say that the datapoints do not fit the model. The model should be adapted to thedata, not the other way around.6
L INEARITYAND ADDITIVITYMost of the tests we will run assume that the relationshipbetween variables is linear. A non-linear relation will notnecessarily be discovered, and a model based on linearity willnot provide a good description of the data.Additivity means that a model based on several variables isbest represented by adding the effects of the different variables.Most regular models assume additivity.7
H OMOSCEDASTICITY / CONSTANTVARIANCEDeviation between the data and the model are called residuals.The residuals should be normally distributed, but they shouldalso have more or less constant spread throughout the model.Correspondingly the variance or spread in data from differentcategories or groups should also be more or less the same.If the error in the model changes as the input increases ordecreases, we do not have homoscedasticity. We have aproblem: heteroscedasticity.8
N ORMALITYOR NORMAL DISTRIBUTIONMost tests assume that something or other is normallydistributed (the residuals, the estimates should come from anormal sample distribution, etc.), and use this to theiradvantage. This is the case for t-tests, ANOVA, Pearsoncorrelation and linear regression.Because of the central limit theorem we can assume that forlarge data sets (more than 30 cases) the parameter estimateswill have a normal sampling distribution, regardless of thedistribution of the data. However, if you have much spread inthe data or many outliers, you will need more cases. It isusually a good idea to have at least 100 just to be safe.It is still a good idea to check how the data are distributedbefore we get started on any more complicated analyses.9
N ORMALITYTo check if the data are normally distributed we use ExploreAnalyze Descriptive Statistics Explore Dependent list: Thevariable(s) that you wish toanalyze Factor list: Categoricalvariable that can define groupswithin the data in thedependent list. Label cases by: Makes iteasier to identify extremeoutliers10
N ORMALITYExplore: Plots Boxplots: Factor levels together - If youhave provided a factor variable this optionwill make one plot with all the groups Boxplots: Dependents together - If youhave provided more than one dependentvariable, this will put the different variablestogether in the same graph Descriptive: Histogram is usually the mostinformative choice Normality plots with tests: Plots and tablesthat makes it clearer if the data are normalor not11
N ORMALITYOutput: Tests of Normality and Extreme Values Tests of Normality: If the data areperfectly normal, sigma will begreater than 0.05. HOWEVER, thishardly ever happens in large datasets. Therefore it is better to look atthe plots to decide if they are normalor not. Extreme values: the five biggest andsmallest values.12
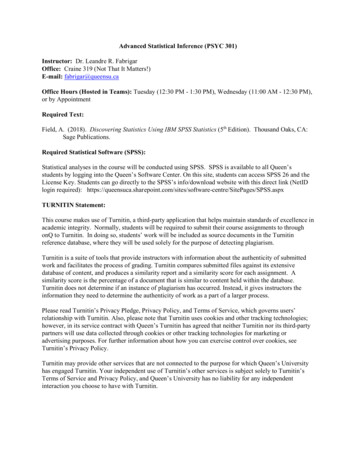
N ORMALITY Histogram: Here we seethat the data are a littleskewed, but overall theyare almost normal Box plot: Shows muchthe same as thehistogram13
N ORMALITY Normal Q-Q plot: The black lineshows where the data should beif it is perfectly normal.Except forthe right tail, the data lie fairlyclose to the line Detrended normal Q-Q plot: Thisshows the deviation between thedata and the normal distributionmore clearly. There is no cleartrend in the deviation, which is agood sign, but we see even moreclearly that the right tail is moreheavy than expected according tothe normal distribution.14
H ELP,MY DATA DO NOT FULFILL THE REQUIREMENTS !In some cases you will be able to choose a non-parametric testinstead, which does not have the same strict prerequisites.Trim the data: Remove the highest and lowest 5%, 10%, 15%,etc, alternatively trim based on standard deviation (usually abad idea as the standard deviation is heavily influenced byoutliers).Windsorizing: Replace the values of extreme data points withthe highest (or lowest) value that is not an outlier.Bootstrapping: Create many hypothetical sets of samples,based on the values you already have, and do the same typesof analysis on all these samples, to obtain interval estimatesTransform variables that deviate greatly from the normaldistribution15
B OOTSTRAPPINGBootstrapping is a form of robust analysis, and it is the mostcommonly used one. It is also very easy to implement in SPSS.Bootstrapping is a method where you get SPSS to treat yoursample as a kind of population. New cases are drawn from yoursample (and then returned), to create a new sample consistingof N cases. Usually N is equal to the number of cases in yoursample. This is done as many times as you want, typically atleast 1000 times, to create the same number of new samples.For each sample, the statistical parameters you ask for arecalculated. Based on the results from all of the samples,interval estimates for each parameter is given, e.g.ḟor mean orcorrelation coefficient.16
T RANSFORMATIONOF ’ ABNORMAL’ DATALast resort, as it can make it harder to interpret the results.17
N UMBEROF CASES / DATA MEASUREMENTSThere is no single number of cases needed to use a specificstatistical test, or to obtain significance. It will depend on thetype of analysis and the size of the effect your are looking for.The smaller the effect, the more cases you need.The central limit theorem states that even though the populationthe data is taken from is not normal, the estimates you createwill have a normal sample distribution as long as you haveenough data, typically you need at least 30 cases. However, 30cases is the absolute minimum, and is not always enough.If you have data with a high variance, you will need more than30 cases, and if you wish to compare groups, the differentgroups should also have more than 30 cases each.18
E XPLORE RELATIONSHIP BETWEENVARIABLES
C ORRELATIONCorrelation measures the strength of the linear relationship betweenvariables. If two variables are correlated, a change in one variable willcorrespond with a change in the other.Correlation is given as a number between -1 and 1, where 1 indicatesa perfect correlation. If one variable increases in value, the other willincrease. This does not mean that an increase of 1 in one variable,will give an equal increase in the other.Correlation equal to -1 is also a form of perfect correlation, but itindicates that an increase in one variable corresponds to a decreasein the other variable. This is called a negative correlation.Correlation equal to 0 means that there is no relationship between thevariables. If one increases, the other will change at random.Pearson correlation is a parametric test. Spearman correlation andKendall’s tau are non-parametric. If you have significant outliers youshould use one of these instead.19
C ORRELATION20
C ONDITIONSFOR REGULAR /P EARSON CORRELATIONYou need two (or more) continuous variablesThe relationship between the variables should be linearThere should not be any very distinct outliersThe variables should be approximately normal, but this is onlyvery important if you have small data sets.If you wish to study correlation between ordinal and continuousvariables you should use Spearman or Kendall’s tau. If youhave non normal data, or fewer cases than 30 you can useeither Spearman or Pearson correlation in combination withbootstrap.21
C ORRELATIONFind correlation between two continuous variables: Analyze Correlate BivariateWe use the data setsurvey.sav. Select thevariables you want toinvestigate. Make surethat Pearson andTwo-tailed areselected. If you areunsure which type ofcorrelation to calculate,select Spearman andKendall’s tau too.22
H ANDLINGOF MISSING DATAChoose Exclude cases pairwise, toinclude as much data as possible in theanalysis. This will only exclude caseswhen there is a missing value in one ofthe two variables being compared at atime.Exclude cases listwise will exclude allcases that have missing data points in atleast one of the variables included in theanalysis. In this case it makes nodifference, as we have two variables, butwith more than two it can make adifference.23
B OOTSTRAPPINGIf you are not sure if youhave enough data for thecentral limit theorem to saveyou from a lack of a normaldistribution, you can getSPSS to run a quickbootstrapping at the sametime.Select Perform bootstrap,and choose how manysamples. 1000 is default andis usually enough, but if youwant, you can increase it to2000. Choose Bias corrected24accelerated.
C ORRELATIONThe bootstrapping calculatesconfidence intervals for ourestimates of the samplemean and correlationcoefficients. The CIs supportwhat the significancesuggests, i.e. that we have asignificant correlation, andthat in this case, thevariables are highlycorrelated. (Small effekt:r 0.1, Medium: r 0.3,Large: r 0.5).25
C ORRELATIONFind grouped correlation between two variables In order to findcorrelationbetween variablesfor different groupsin your sample,you can use SplitFile. Data Split File Compare groups Run the samecorrelationanalysis26
PARTIALCORRELATIONAnalyze Correlate PartialUsed when you wish tosee how correlated twovariables are, whiletaking into accountvariation in a thirdvariable, that may ormay not influence thetwo variables you areinterested in. Move thevariables of interestinto the box labeledVariables, and the oneyou wish to control for27into Controlling for.
PARTIALCORRELATIONIt is useful to select Zero-ordercorrelations. This gives you something tocompare with, as SPSS will then alsoshow the correlation between variableswithout taking into account variation inthe control variable.28
PARTIALCORRELATIONCorrelation where we control for variation in one or more othervariables can be compared to the correlation without. If theseare identical, the control variable has no effect. In most casesthe correlation will be somewhat reduced, but sometimes thechange will be large enough to reduce the correlationsubstantially (confounding).29
L INEARREGRESSIONThis is used to look for a linear relationship between variables.Is it possible to "predict" how someone is likely to score on onevariable, based on where they score on others?The errors we make (deviation between sample andpopulation) must be independentShould have many more cases than variables. Rule of thumb isN 50 8m, where m is the number of independent variables.This rule is somewhat oversimplified.It is a common misconception that independent variables musthave a normal distribution, but this is not necessary.Deviation between measurements and predicted values arecalled residuals, and these need some extra attention after youhave created your model.30
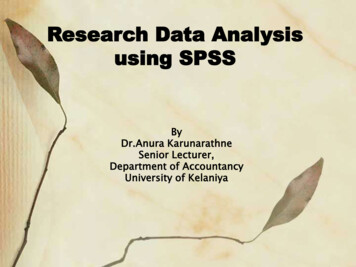
N UMBEROF CASES NEEDEDThe number of cases neededwill not only depend on thenumber ofpredictors/independentvariables, but also on thesize of the effect you arelooking for. (Based on afigure from Field (2017).)31
A SSUMPTIONSOF LINEAR REGRESSIONYou should have a continuous dependent variable, and one or morecontinuous or dichotomous independent variables.There should be a linear relationship between the dependent variableand all the independent variables, and the combined effect of all thedependent variables should best be expressed as a sum of all thecontributions.Observations should be independent, and you should not haveextreme outliers.Data should be homoscedastic (check after you have made themodel)The residuals should have a normal distribution (check after you havemade the model)If you have more than one independent variable, these should not bestrongly correlated with each other, i.e. no multicollinearity.32
L INEARREGRESSIONAnalyze Regression LinearWe use the data setsurvey.sav. Move thedependent variable tothe box labeledDependent, and startwith a selection ofindependent variablesthat you want to includein your model, andmove them into the boxlabeled Independents.Click Next.33
L INEARREGRESSIONAdd the rest of theindependent variables youwant to include in the boxlabeled Independents. If youwish to compare with aneven more complicatedmodel you can click Nextagain and add morevariables. If you want allvariables to be included fromthe start, you add allvariables in the first block,without making more .34
L INEARREGRESSIONLinear Regression: StatisticsMake sure that Estimatesand Confidence intervals areselected in RegressionCoeff., and include Model fit,R squared change,Descriptives, Part and partialcorrelations, Collinearitydiagnostics and Casewisediagnostics. This will give agood overview of the qualityof the model.35
L INEARREGRESSIONLinear Regression: OptionsGo with the default option.This is one of few analyseswhere it is better to useExclude cases listwise ratherthan Exclude cases pairwise.If you use pairwise exclusion,you risk getting absurdresults from your model, e.g.that it explains more than100% of the variation andsuch.36
L INEARREGRESSIONLinear Regression: PlotsThe most useful thing to lookcloser at is the residuals.Therefore we plot thestandardized predictedvalues (ZPRED) against thestandardized residuals(ZRESID). In addition wechoose Histogram, Normalprobability plot and Produceall partial plots.37
L INEARREGRESSIONLinear Regression: SaveTo check if we have any outliers weshould be concerned with, or anycases that are overly influential, wesave a few variables associatedwith the residuals and thepredicted values. These are addedas separate variables on the rightend of your data set.38
L INEARREGRESSIONDescriptives provide the usualdescriptive statistics for allincluded variables, bothdependent and independent.Correlations present thePearson correlation betweenthe different variables. Here youcan check if the independentvariables correlate with thedependent variable, and if anyof the independent variables arevery highly correlated.Correlation betweenindependents over 0.9 is a badsign.39
L INEARREGRESSIONR Square indicates howmuch of the variation in thedependent variable isexplained or described by themodel (multiply with 100 toget %). The ANOVA tableindicates if the model in itselfis significant. In this caseboth models are significant,but model 2 describes moreof the variation in thedependent variable.40
L INEARREGRESSIONCoefficients lists the parameters that indicates the effect ofeach variable (B), and if these are significant (Sig.). Beta letsyou compare the effect of each variable with the other, as ifthey were measured on the same scale. VIF is a measure ofmulticollinearity. Values over 10 are a cause for concern.41
L INEARREGRESSIONEspecially the Mahal. Distance andthe Cook’s distance are useful tosee if you have outliers andunusually influential cases. Withfour independent variables thecritical upper limit for Mahalanobisis 18.47. The case in the data setthat has a value of 18.64 can belocated in the data set, but it is onlymildly larger than the critical value,so we will not worry about it.Critical value for Cook’s is 1.Anything below that is fine.42
L INEARREGRESSIONThe residuals are fairlyclose to a normaldistribution, so there isno reason to beworried about violatingthis assumption. Ifthere had been, weshould have tried withbootstrapping, toobtain more reliableCIs and significancemeasures.43
L INEARREGRESSIONThe P-P plot shows theactual residuals plottedagainst what you wouldexpect, given a normaldistribution.Theseshould follow the blackline, and in this casethey do, strengtheningthe assumption that theresiduals are normallydistributed.44
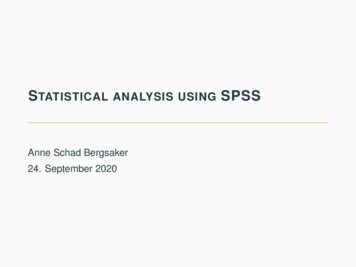
L INEARREGRESSIONPredicted valuesplotted againstresiduals can be usedto check if the data arehomoscedastic. If thepoints have a funnelshape, it indicatesheteroscedasticity, andwe should use morerobust methods. Theblob shape that wehave is what you want.45
L INEARREGRESSIONFinal check of linearity and correlation is to look at the scatterplots of all independent variables against the dependentvariable. Not surprisingly we see little indication of correlationbetween the dependent variable and the two independentvariables that were not significant.46
L INEARREGRESSIONPlotting the standardized residuals against the independentvariables we can check if we have independence of errors.Here we want no clear trends.47
E XPLORE THE DIFFERENCEBETWEEN GROUPS
ASMALL DISCLAIMEREven though t-tests and ANOVA usually are presented astechniques that are completely different from linear regression,when the fact of the matter is that they are based on the samebasic mathematical model. The reason they are kept separateis more historical than anything else, and SPSS holds on to thisseparation even though it is quite artificial.48
T- TESTCompare data from two different groups, in order to determineif the two are different. t-tests are usually used to analyze datafrom controlled studies.Be aware that there are generally two different types of t-tests;one for independent groups, and one for paired samples, wheredata are collected from the same participants at two differenttimes (repeated measures)If the assumptions of the t-test are not met, you can use MannWhitney U test (for independent samples), Wilcoxon SignedRank test (repeated measures), t-test combined with bootstrap,or a robust version of the standard t-test.49
A SSUMPTIONSOF THE INDEPENDENT T- TESTYou need a continuous dependent variable and a dichotomouscategorical variable.Independent observations/groups. This means that eachparticipant can only be part of one of the groups, e.g. men andwomen, smokers and non-smokers, etc.Random selectionNo extreme outliersIf you have a small sample (less than 30), the dependentvariable should be normally distributed within each of thecategories defined by the independent variable.The variance of the dependent variable should beapproximately equal in the two categories defined by thecategorical variable. The groups should also be similar in size.50
T- TESTAnalyze Compare Means Independent Samples T TestWe will use the data set survey.sav.Move the dependent continuousvariable into the box labeled TestVariable(s), and the independentcategorical variable into GroupingVariable. Even if you can test morethan one dependent variable at atime, you should not do so. UseMANOVA instead.51
T- TESTClick Define Groups.Here you have to remember howyou have coded the categoricalvariable. Indicate what the twogroups are. In this case sex iscoded as 1 Man and 2 Woman,so we write 1 and 2 and clickContinue. If the codes had been 0and 1, we would have written thosevalues.52
T- TESTGroup Statistics provides some descriptive statistics relating tothe different groups, such as mean, standard deviation.Independent Samples Test shows what the difference betweenthe groups are (Mean difference), and if the difference issignificant (Sig. 2-tailed). If Levene’s test is not significant(column 2), we can look at the results from the first row (Equalvariances assumed). The t-test in this case is not significant.53
M ANN W HITNEY UTESTNon-parametric version of a standard t-test for independentsamples. You need a continuous dependent variable and adichotomous independent variable. If you have many extremeoutliers you might consider using this test.Analyze Nonparametric Tests Independent SamplesChoose Customizeanalysis and clickFields54
M ANN W HITNEY UTESTChoose Use customfield assignments, andmove the dependentvariable into the boxlabeled Test Fields.Move the independentvariable to Groups, andclick on Settings.55
M ANN W HITNEY UTESTGo to the Settings tab.Under Choose tests,select Mann-Whitney U(2 samples), and clickPaste.56
M ANN W HITNEY UTESTThe summary of the test shows the hypothesis we are testingagainst (no difference between groups), and what theconclusion of the test is, based on significance. In this casethere is no significant difference between the groups, and weretain the null hypothesis.57
M ANN W HITNEY UTESTThe significance value of the test, with corresponding teststatistic is shown in the table Independent SampesMann-Whitney U. The histograms of the two groups supportsthe result of the test, that there is no significant differencebetween the groups.58
A SSUMPTIONSOF REPEATED MEASURES T- TESTYou need a continuous dependent variable measured at twodifferent times, or under two different conditionsRandom selectionThere should be no extreme outliers in the difference betweenthe two sets of measurementsThe difference between the two measurements should benormally distributed, at least if you have a small sampleThe data should be organized so that each participant has onerow, with two different variables representing the data from thetwo different points in time/conditions59
T- TEST ( REPEATED MEASURES )Analyze Compare Means Paired Samples T TestWe will use the dataset experim.sav. Movethe variable containingmeasurements fromtime 1 to the box calledPaired Variables. Movethen the variablecontaining the secondset of measurementsinto the same box.60
T- TEST ( REPEATED MEASURES )Paired Samples Statistics shows descriptive statistics such asmean and standard deviation for the two different variables.Paired Samples Correlations provides the correlation betweenmeasurements from the two different variables.61
T- TEST ( REPEATED MEASURES )The final table shows if the test is significant or not, and whatthe average difference is. Here the difference is 2.67, and thetest is highly significant (p 0.001).62
W ILCOXON S IGNED R ANKTESTNon-parametric alternative to the repeated measures t-test.You need a continuous variable measured on two differentoccasions. This test is more suitable than a t-test if you havemany outliers.Analyze Nonparametric Tests Legacy Dialogs 2 RelatedSamplesMove the data fromtime 1 to Test Pairs,then the data from time2. Check the box nextto Wilcoxon.63
W ILCOXON S IGNED R ANKTESTTwo-Related-Samples: OptionsSelect Quartiles (andDescriptives if you wantsome basic descriptivestatistics as well).Excludecases test-by-test will includeall cases that have data onboth occasions, but that maystill miss data in othervariables.64
W ILCOXON S IGNED R ANKTESTDescriptive Statistics presents thequartiles. Here we can see thatthere are signs of differencesbetween the two sets ofmeasurements, since all quartilesfrom time 2 are lower than for time1. Test Statistics confirms this(p 0.001). The effect size can becalculated by using r z/(2*N)where N is number of cases, in thiscase -4.18/(2*30) 0.54,corresponding to a large effect.65
ANOVA - AN ALYSIS O F VA RIANCECompare continuous data from two or more different groups, tosee if the groups differThis test must be adjusted to whether you have independentgroups (different people in each group), or if you have repeatedmeasures (the same people in each of the groups). ANOVAassumes that all groups have similar variance.Alternative if assumptions are not met: Kruskal Wallis test,Friedman’s ANOVA, bootstrap and other robust methods66
A SSUMPTIONSOF INDEPENDENTANOVAYou need a continuous dependent variable, and a categoricalindependent variable with at least two categories.Independent measurements. Participants can only belong toone of the categories in the independent variable, and differentparticipants should not be able to affect each other.Random sampleNo extreme outliersThe dependent variable should be approximately normallydistributed within each of the categories in the independentvariable.The variance in each group should be similar. Groups shouldalso be of similar sizes.67
ANOVA - AN ALYSIS O F VA RIANCEAnalyze Compare Means One way ANOVAWe will use the dataset survey.sav. Movethe dependent variableto the box labelesDependent List, andthe categorical variableto Factor.68
ANOVA - AN ALYSIS O F VA RIANCEOne way ANOVA: OptionsSelect Descriptive, Homogeneity ofvariance, Brown-Forsythe andWelch under Statistics, and chooseMeans plot. To include as muchdata as possible in your analysis,choose Exclude cases analysis byanalysis.69
ANOVA - AN ALYSIS O F VA RIANCEOne way ANOVA: Post Hoc Multiple ComparisonsYou can choose from a wideselection of post hoc tests.Check the SPSSdocumentation for detailsabout each test. We chooseTukey (if we have more orless equal variance andgroup sizes), Bonferroni(controls for type I errors)and Games-Howell (in caseof difference in variance).70
ANOVA - AN ALYSIS O F VA RIANCEDescriptives shows some basic descriptive statistics for thedependent variable for each of the groups in the independentvariable.71
ANOVA - AN ALYSIS O F VA RIANCETest of Homogeneity. shows if wecan assume equal variances. Herethe null hypothesis is that they areequal, so we want Sig. to begreater than 0.05. Robust Test ofEquality of Means shows the testresults we should use if thevariances are different. In this casethere are significant differencesbetween the groups.72
ANOVA - AN ALYSIS O F VA RIANCESince we can assume equalvariances, we can also lookat the regular ANOVA, whichsupports the conclusion ofthe robust tests, that there isa singificant differencebetween groups (Sig. 0.01).The results of the post hoctests show which groupsdiffer. Here we can see thatthere is only a significantdifference between the oldestand the youngestparticipants.73
ANOVA - AN ALYSIS O F VA RIANCEThe mean of the dependent variable in each age group isplotted against age group, and indicates a clear trend withincreasing optimism with age.74
K RUSKAL WALLISNon-parametric alternative to ANOVA for independent groups.You need a continuous dependent variable and a categoricalindependent variable with two or more groups.Analyze Nonparametric parametric Tests IndependentSamplesIn the Fields tab, movethe dependent varialbeto Test Fields, and theindependentcategorical variable toGroups.75
K RUSKAL WALLISUnder Settings, chooseKruskal-Wallis 1-wayANOVA, and makesure that Multiplecomparisons is set toAll pairwise. ChooseTest for OrderedAlternatives if thecategorical variable isordinal. Click Paste.76
K RUSKAL WALLISHypothesis Test Summaryshows what the nullhypothesis is, and if it shouldbe rejected. In this case thetest states that we should gowith the alternativehypothesis, that there is asignificant differencebetween groups. Specifictest statistics andsignificance is shown innIndependent-SamplesKruskal-Wallis.77
K RUSKAL WALLISBoxplots of the datafrom the different agegroups look like theysupport our conclusionthat optimism is higherin older participants.78
K RUSKAL WALLISPairwise comparisons. show that there is only a significantdifference between the first and the last age groups.79
A SSUMPTIONSOF REPEATED MEASURESANOVAYou need a continuous variable measured at two or moreoccasions or experimental conditio
statistical analysis 2.Know the difference between parametric and non-parametric tests 3.Know which statistical tests to use in different situations 4.Know when you should use robust methods 5.Know how to interpret the results from a test done in SPSS, and know if a model you have made is good or not 1