Transcription
Developing a Maturity Matrixfor Software Product ManagementInge van de WeerdWillem BekkersSjaak BrinkkemperTechnical Report UU-CS-2009-015September 2009Department of Information and Computing SciencesUtrecht University, Utrecht, The Netherlandswww.cs.uu.nl
ISSN: 0924-3275Department of Information and Computing SciencesUtrecht UniversityP.O. Box 80.0893508 TB UtrechtThe Netherlands
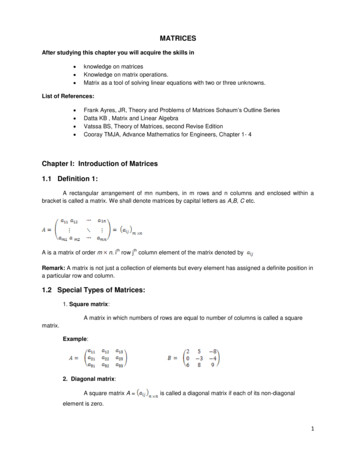
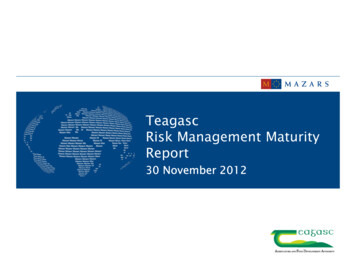
Developing a Maturity Matrix for Software Product ManagementInge van de Weerd, Willem Bekkers, Sjaak BrinkkemperUtrecht University, The .uu.nlAbstract. The quality of processes in Software ProductManagement (SPM) has a high impact on the successof a software product, as it improves product qualityand prevents release delays. To improve the SPMpractice, we propose the maturity matrix for SPM, afocus area oriented maturity model concentrating onthe SPM functions Requirements Management,Product Roadmapping, Release Planning andRequirements Management. In this paper, we describethe development of the SPM maturity matrix,consisting of (a) identification and description ofcapabilities, (b) positioning the capabilities at the rightlevels in the maturity matrix and (c) validating thematurity matrix with expert validation and a surveyamong 45 product managers and product managementexperts. The result is a validated maturity matrix thatwill guide further development of methodical supportin SPM.Keywords: software product management, maturitymatrix, requirements management1. Maturity in SPMSoftware product management (SPM) is a crucialarea within many software companies. Good productmanagement has a high impact on the success of asoftware product [1]. This requires a combination oftechnological, managerial and business skills, such ascalculating optimal releases, setting out roadmaps,managing risks, and interacting with many internal andexternal stakeholders. If these activities do not getenough attention, the quality of a product decreases,release dates are not met, and managing customers’expectations become a large problem.Although the product manager’s function is highlyimportant in the product software industry, littleeducation exists in this area [2]. Almost no educationon SPM is being offered, except in the area ofmarketing and sales. Based on our experience in themarket, especially in The Netherlands, Germany andSwitzerland, we observe that most software productmanagers were earlier employed in functions such asdevelopment manager, project manager or salesmanager. This causes a gap of knowledge that theproduct manager has to solve by getting experienced inthe area. Hence, lifting the quality of the product byimproving the SPM processes is often difficult. Mostexisting software process improvement (SPI) modelsaim at a broad spectrum of SPI and the area of SPM isusually not the main area of attention.In this research, we propose a maturity matrix forSPM that can be used to assess an organization’scurrent SPM capabilities and offer local, incrementalimprovements to the product manager.1.1. BackgroundIn earlier research, we developed the ReferenceFramework for Software Product Management [2].Since its publication, various studies have been done totest the reference framework in product softwarecompanies (cf. [3] and [4]). In this research, we use thereference framework as a foundation for our maturitymatrix. Therefore, we will provide a brief explanationof the framework.In Figure 1, the reference framework for softwareproduct management is depicted. The frameworkconsists of internal stakeholders (product management,company board, sales & marketing, services, support,development and research & innovation) and externalstakeholders (the market, partners and customers).The most important internal stakeholder, Productmanagement, consists of four business functions:Portfolio management concerns managing thedifferent products that a company owns. Partnering,product lifecycle management and product lineidentification are part of this function.Product roadmapping handles with thedevelopment of the product roadmap, in which futurereleases are planned based on themes and core assets.Requirements management contains the activitiesof requirements gathering, identification andorganizing; all ongoing activities within the productmanagement domain.Release planning deals with prioritizing andselecting requirements in order to define the newrelease. Also the activities release validation, launchpreparation and scope change management are part ofthis function
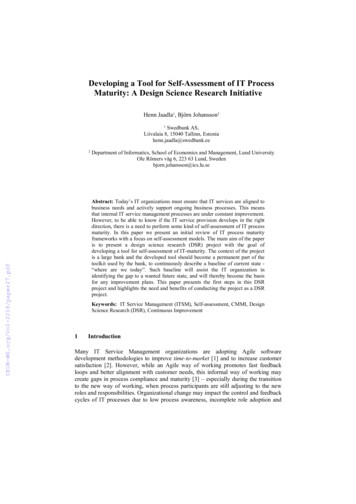
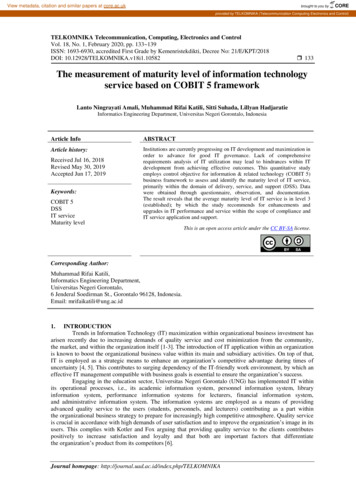
board requestsProduct managementProduct lifecyclelifecycle decisionsmanagementtrendsMarket trendidentificationmarket trendsproduct development strategyPortfolio managementPartnering &collaborationscontractingProduct lineidentificationtrendsproduct linesProduct roadmappingMarketThemeidentificationthemesCore assetidentificationmarket trendsRequirements managementRequirementsgatheringrequirementspartner requestsroadmapRequirementsidentificationproduct requirementsproduct requirements listPartnercompaniesRelease izationtechnology driversreleasecontentRequirementsselectionScope changemanagementSales &marketingcustomer &prospect alidated release definitionvalidationscopechangesResearch &innovationRoadmapconstructioncore assetsbusiness case validationvalidationcontractsCompany boardCustomerlaunch preparation packagelaunchpreparationpackageinternal stakeholdersinternal functionsDevelopmentSupportServicesexternal stakeholderschange requests, bug fixesFigure 1. Reference framework for Software Product Management1.2. Paper outlineThis paper is organized as follows. Section 2describes our research method. In Section 3, wedescribe the process of developing the maturity matrix.Then, in Section 4, we describe the empiricalvalidation of the matrix. In Section 5, we describe theimplications and outlook. Finally, in Section 6, weprovide the conclusions of our research.3. Development. The development of the artifact, inthis case the maturity matrix is described in Section 3.4. Evaluation. This step comprises the evaluation ofthe method. We used a survey to validate the method,as is described in Section 4. The results of this surveylead to a higher level of problem awareness andsuggestions for solutions. We elaborate on thesesuggestions in Section 5.5. Conclusion. Finally, in Section 6, conclusions andareas for further research are covered.2. Research design2.1. ArtifactsThis study follows the design science methodology,in which research is done through the processes ofbuilding and evaluating artifacts [5]. The artifact in thisresearch is the maturity matrix for SPM. During ourresearch, we follow the 5 process steps of the designcycle [6]. This design cycle consists of several stepsthat follow an iterative process; knowledge produced inthe process by constructing and evaluating the artifactis used as an input for a better awareness of theproblem. The 5 process steps are:1. Awareness of the problem. In Section 1, wedescribed the problem and its context.2. Suggestion. The suggestion for a solution to theproblem identified in step 1 is developed in this step. InSection 2, we describe our approach in tackling theproblem and the research methods that we use.In Figure 2, we depict the structures of the twoartifacts in this research. The REFERENCE FRAMEWORKconsists of KEY PROCESSES that are grouped intoBUSINESS FUNCTIONS. Secondly, the MATURITY MATRIXconsists of KEY PROCESSES and SPM CAPABILITIES. EachSPM CAPABILITY contributes to a KEY PROCESSES and itindicates which MATUIRTY LEVEL this process has.In addition to the artifact structure, the researchmethods used during the development of both artifactsare provided. At the left, the research methods thatwere used for developing the Reference framework arelisted and at the right the method for developing theMaturity matrix are listed.
nstormSPMsession,KEY yare grouped inindicatesBUSINESSFUNCTIONMATURITYLEVELFigure 2. Artifacts and research methods2.2. Data collection methodsThis research was conducted with the following datacollection methods:Literature study. One of the sources for thecapabilities, which are defined for each of theprocesses in the reference framework for SPM, is aliterature study. This literature study was based on amultitude of papers describing specific processeswithin the field of SPM, e.g. [7], [8].Brainstorm session. A brainstorm session wasconducted with experts from the scientific communityto create the model. The session consists of two parts:1) the capabilities themselves were determined; 2) thepositions of the capabilities in the SPM maturity matrixwere determined. The literature study was used as abasis for the brainstorm session.Expert validation. An expert from practicevalidated the results of the brainstorm session: thecapabilities themselves and their position within theSPM Maturity Matrix.Survey. A final validation was conducted based ona survey with SPM experts from practice from all overthe world. The goal of this survey was to validate theorder of the capabilities relative to each other in theSPM Maturity Matrix.3. Developing a maturity matrixwhich each focus area has its own number of specificmaturity level.Most well-known maturity models are staged orcontinuous 5-level models, such as the CapabilityMaturity Model (CMM) [10], and its follow-up CMMI[11]. Earlier research into the improvement of SPMshows some shortcomings in these methods. CMMI forexample, has been found too heavy to use by severalorganizations [12]. And there are others who say thatextensive software process improvement (SPI)frameworks, such as CMMI and ISO/IEC 15504(SPICE) [13] are too large to implement, or evencomprehend [14] [15]. For example, a typical CMMSPI cycle can take between one and a half and twoyears to complete. It also requires large resources andlong term commitment [16], which can be a problemfor small and medium companies. Another problem isthat small and medium software companies often notonly lack the funds required to implement many of thepractices from CMM but also have to base their SPIinitiatives on practices that do not apply to them [17].For the reasons above, we choose to develop a focusarea oriented model, in order to make local analysisand incremental improvement possible. Similar modelhave been used for the testing domain [18] and thearchitecture domain [9].3.2. Structure of the maturity matrixIn Table 1, the SPM maturity matrix is depicted.Table 1. Maturity matrix structure0 1 2 3 4 5 6 7 8 9 10 11 12RM1. Requirements gatheringRM2. Requirements identificationRM3. Requirements organizingRP1. Requirements prioritizationRP2. Requirements selectionRP3. Release definitionRP4. Release validationRP5. Launch preparationRP6. Scope change managementBABAAAA3.1 Variance of maturity modelsPM1. Market trend identificationPM2. Partnering & contractingPM3. Product lifecycle managementPM4. Product line identificationAAABDDCDCCCABABCCBBBACB CBCBCBBBAPR1. Theme identificationPR2. Core asset identificationPR3. Roadmap constructionDCBAAIn this section, we first describe our choice for thetype of maturity matrix we use, and then we describe itsstructure and the development process.Van Steenbergen et al. [9] recognize three variantsof maturity models: 1) staged 5-level models, whichdistinguish five levels of maturity, which in turn have anumber of focus areas that are defined specific to thatlevel; 2) continuous 5-level models, which contain anumber of focus areas, in each area the 5 levels aredistinguished; and 3) focus area oriented models, inCAABCCCCThe matrix consists of columns and rows, whichrepresent the two dimensions of the model. Thecolumns 0 to 12 represent the different maturity levelsfor the model, where 0 is the lowest level of maturityand 12 the highest. The SPM key processes are
represented by the rows and are divided into fourgroups (the business functions; ,‘Productroadmapping’, ‘Portfolio management’). When aprocess is carried out at a certain maturity level it iscalled a capability. In Table 1, we can for exampleidentify the capability Requirements gathering A,which is located on level 1. This capability is coded asRM1A and described as: “Ad hoc requirementsgathering. Requirements are being gathered andregistered.”Finally, two more concepts need to be introduced:Intra-process capability dependency – This is thedependency of one capability within a certain keyprocess to another capability in the same key process.In Table 1 this type of dependency is depicted with anarrow between RM1B and RM1C.Inter-process capability dependency – Intraprocess refers to the dependency of a capability in acertain key process to a capability in another keyprocess. In Table 1 this is depicted with an arrowbetween RM1D and RM3C.3.3. Developing a maturity matrix for SPMWe followed three main steps during thedevelopment of the maturity matrix:1. Identification and description of capabilitiesA brainstorm session with four SPM experts washeld to identify the capabilities. Two of them hadextensive professional experience in SPM and the othertwo were researchers to SPM. During the session, itappeared that the maturity levels in the SPM processesfollow two types of sequences.The first sequence follows the natural hierarchy ofsoftware products (portfolio product release requirement). The capability naming therefore is:(A) ad hoc, (B) release-based, (C) roadmap-based, and(D) portfolio-based. However, this hierarchy is not forall processes suitable. Therefore, we use a secondsequence, which can consist of (A) ad hoc, (B)organized, (C) integrated / externally oriented, (D)optimized. Please note that a sequence may consist of 3or 4 capabilities. Short descriptions of the capabilitiesare included in Appendix I, which are based on [3].2. Positioning the capabilities in the maturity matrixThe next step concerned positioning the capabilitiesin the matrix. By analyzing the inter- and intra-processcapability dependencies, we decided the order of thecapabilities in the matrix. For example, for the firstcapability in the process in Requirements identification(RM2A), it makes sense to have gathered andregistered requirements, which is capability RM1A.Therefore, RM2A must be placed at least 1 level afterRM1A. This activity resulted in a matrix of 13 levels(0-12). During the validation, we will find out whetherthis is the right size.3. Validating the maturity matrixThe third and last step is the empirical validation ofthe matrix. In Section 4, we describe how we use asurvey to validate the positions of the capabilities.4. Empirical validation4.1. Survey structureOur survey consists of three parts: Introductionquestions, general questions and capability questions. Itstarts with two introduction questions: Which SPM areas are you familiar with? How are you related to SPM?The answers to these two questions determine whichquestions will be presented in the remainder of thesurvey. First, the respondent can choose which of thefour SPM areas will be included in the survey. OnlySPM-areas of which the checkboxes are ticked, will beincluded in the survey. The second question is used tofind out whether the respondent is a software productmanager or another SPM professional. After theintroduction question, some general questions areposed concerning company size, experience, etc.The main structure of our survey is based on thefour business functions that are defined in the referenceframework for SPM: requirements management,release planning, product roadmapping, and portfoliomanagement. For each function, we asked how ouridentified capabilities should be implemented in anorganization. If we would ask to fill in a whole matrixper area, we would get very large matrices. Forexample, the release planning area has 21 capabilitiesand 12 rows. During the first pilots it appeared thiswould cause a cognitive workload that was too high.Therefore, we decided to use another approach anddivided the matrix in three sub matrices. In the firstmatrix, ranging from 1 to 6, capabilities A and B arecovered. In the second matrix, ranging from 4 to 9,capabilities B and C are covered. Finally, if necessary,a third matrix is used to cover capabilities C and D. InTable 2, part of the matrix is depicted, showing thedivision in three separate matrices.Table 2. Matrix division0 1 2 3 4 5 6 7 8 9 10 11 12Requirements gatheringRequirements identificationRequirements organizing
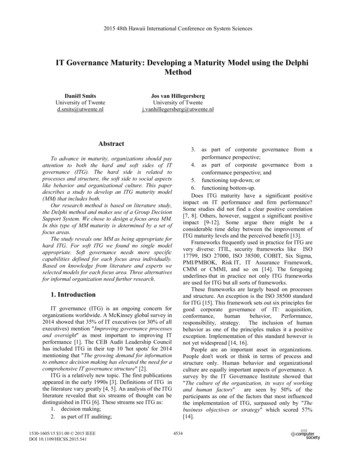
In Figure 3, we depict part of the survey in which allcapabilities A and B of the Requirements Managementprocess area are listed. The capabilities are listed onthe left and the levels (1-6) in the middle. The lastcolumns can be used to indicate whether the respondenthas implemented the capability. The N/A option is fornon-product managers that execute the survey.Maturity levelsImplemented?followed a course or study in SPM and three arecertified in SPM. In Table 3, some characteristicsconcerning the respondents’ function, company size(only product managers are included) and experienceare provided.Table 3. Respondents' characteristicsFunctionProduct managerResearcherConsultantOtherCompany sizeExperience30 Less than 5012 0-2 years5 50 - 2507 3-5 years3 More than 250 11 6-10 years7More than 10 years13121374.3. Data analysisFigure 3. Survey questions Requirements Mgt.4.2. Data collectionIn order to find respondents to the survey, we posteda message to several mailing lists. Below, you can findan overview of the members of these mailing lists: Netherlands product software mailing list: 175 Netherlands SPM community: 68 International SPM community: 176In addition, during a national meeting among 20Dutch product management professionals, the surveywas promoted. Finally, the URL of the survey wasposted on the SPM community website [19]. Pleasenote that the members of the different mailing lists,visitors to the meeting, and visitors of the websiteoverlap.The number of respondent to the survey is 84. Ofthese 84 only 45 were useful, i.e. they did not quit thesurvey after the first two pages. Not all questions havethe same amount of responses. The respondents canmake a choice in the beginning of the survey, for whichthey can indicate on which SPM area they can answerquestions. Per SPM area, we have the followingamounts of respondents: Requirements management: 42 Release planning: 27 Product roadmapping: 25 Portfolio management: 19The respondents originate mostly from the Netherlands(36). Other individuals originate from Germany,Canada, USA, India, South Africa, Sweden,Switzerland and Spain. Thirteen of the respondentsIn this section, we will analyze the results from thesurvey. For each business function, we describe theresults of the survey and compare this with our initialmaturity matrix. In principle, we use the survey resultsto update our maturity matrix. However, we make oneexception. Dependencies between capabilities in thedifferent business functions were not part of the survey.Therefore, in case a capability is placed on a certainmaturity level because of a dependency to a capabilityin another business function, we keep to the originalsequence.We use boxplots to give a graphical overview of thedistribution of each capability, as is illustrated inFigure 4. These boxplots show the median, smallestand highest observations and the distribution over thequartiles. In addition, the outliers (if present) areshown. We use the medians as an indication of thematurity level of a capability, because we want to knowwhich level was chosen most for a certain capability.smallest observation25%median25%highest observation25%25%Figure 4. BoxplotWe list all capabilities within one business functionin a boxplot. At the Y-axis, the different capabilitiesare listed and at the X-axis, the maturity levels areindicated. Please note that some medians are notintegers, but rational numbers. E.g. RM1C has amedian of 5,5. The reason for this is that therespondents had to enter these maturity levels twice (cf.Section 4.1). Sometimes this resulted in two differentanswers, of which we calculated the mean. In suchcases, we look at the distribution of the boxplot toidentify at which level the capability should be placed(in RM1C that means that the capability is placed onmaturity level 6).
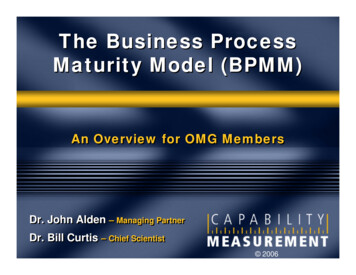
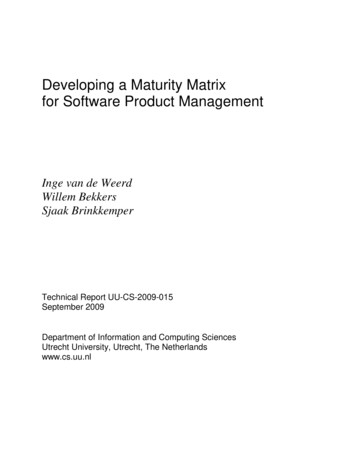
activities as the minimum that a product managershould implement.4.3.1. Requirements managementIn Figure 5, the results of the Requirementsmanagement survey part are depicted in a box plot. InTable 4 the matrix is illustrated with the originalresults, and the deviations that were found whencomparing it with the boxplot. We also indicate thestatus of a capability. “A” means that the result of thesurvey was the same as the original position, “A”indicates the result of the survey that was different fromthe original capability, and “A” shows the old positionof the capability.Several issues are noteworthy. Firstly, the intraprocess capability dependencies are the same; allcapabilities are positioned in the sequence A, B, C,(D). For the inter-process capability dependencies wesee some differences that we will implement in the finalmatrix.Figure 6. Boxplot Release planningTable 5. Release planning matrix0 1112DCCCDCDDDCC4.3.3. Product roadmappingFigure 5. Boxplot Requirements managementTable 4. Requirements management matrix0RM1RM2RM312A345BAA678CBABBB910 11 12The results of the Product roadmapping part of thesurvey are illustrated in Figure 7 and compared withthe original matrix in Table 6. Also for Productroadmapping, the intra-process capability dependenciesare analogous to the original matrix. In the interprocess capability dependencies we see somedeviations that will be included in the matrix.DCCC4.3.2. Release planningIn Figure 6 and Table 5, the results of the Releaseplanning part of the survey are illustrated andcompared with the original matrix. Again, the intraprocess capability dependencies are the same.However, in the inter-process capability dependencieswe see many small deviations. All of which have beenincorporated into the matrix. One issue stands out: Theprioritizing and selection capabilities (RP1A andRP2A) are implemented earlier than all othercapabilities. Apparently, the respondents consider theseFigure 7. Boxplot Product roadmapping
Table 6. Product roadmapping matrixPR1PR2PR312AAAA34BBB56789101112CBCCCCRP2D, RP4D, PR2C and PR3C and all the Ccapabilities of the Portfolio Management function.Reason for this is that we do not only want toincorporate the fastest way to implement thecapabilities in our matrix, but we also would like toprovide a balanced way to improvement.Table 8. Maturity matrix for SPM4.3.4. Portfolio management0 1 2 3 4 5 6 7 8 9 10 11 12Finally, in Figure 8 and Table 7, the results of thePortfolio management part of the survey are illustratedand compared with the original matrix.Figure 8. Boxplot Portfolio managementAgain, the intra-process capability dependencies arethe same as in the original matrix. In the inter-processcapability dependencies we see a few small deviations,which we will include in the matrix.Table 7. Portfolio management matrix0 1PM1PM2PM3PM42AAAA3456BBCCCCBBA789RM1. Requirements gatheringRM2. Requirements identificationRM3. Requirements organizingARP1. Requirements prioritizationRP2. Requirements selectionRP3. Release definitionRP4. Release validationRP5. Launch preparationRP6. Scope change managementABACDBACCBBCDABCDA BCABCDABCABCPR1. Theme identificationPR2. Core asset identificationPR3. Roadmap constructionABPM1. Market trend identificationPM2. Partnering & contractingPM3. Product lifecycle managementPM4. Product line identificationAAAABBAABBCCCBBCCCCIn Table 8, we also show the score for one of therespondents in the benchmark questions. Thisrespondent works for a company with less than 50employees from the Netherlands. He did not have anyeducation or certification in SPM. The overall SPMmaturity level is determined by checking for whichmaturity level all capabilities (and the precedingcapabilities) are implemented. As can be seen in thetable, the maturity level in this case is 3. To advance toa higher maturity level, say level 4, work needs to bedone in RM2, RP3, PM1 and PM2.10 11 124.5 Threats to validityCCCC4.4 ResultsIn Table 8, the final maturity matrix for SPM ispresented. As can be seen in the table, the number oflevels decreased to 10.We made some adaptationscompared to the survey results. First, all capabilities ofthe Product roadmapping business function have allbeen shifted one level to the right. The dependenciesbetween business functions were subject to the surveyand we believe that the product roadmappingcapabilities should be on a higher level. Finally, severalcapabilities that are placed on the highest maturity levelof a certain area have been shifted to the right, namelyValidity refers to the degree to which a responsemeasures what we intend for it to measure [20]. Weidentified three types of validity threats that areimportant to discuss, namely threats to conclusionvalidity, construct validity, and external validity.Internal validity is less important since this study is notabout establishing a causal relationship. It is adescriptive study, in which we describe the mostly usedimplementation sequence of SPM capabilities.Firstly, conclusion validity is the degree to whichconclusions we reach about relationships in the data arereasonable. Important is the composition of participantsand the statistical analysis. At the beginning of thesurvey, respondents were asked to indicate with whichof the SPM they were familiar. The respondents onlygot to answer questions about these familiar areas.
Therefore, we believe that the respondents wereexperienced enough to answer the questions theyselected. Most of the respondents are not anonymously,since an email address is needed to send them thebenchmark report. However, there is no reason tobelieve that they have not answered according to theirbest knowledge, since there is no social pressure toanswer in a particular way. Therefore, we consider theconclusion validity not to be critical.Construct validity concerns whether we measure theconstruct that we believe we measure. On theintroduction page of the survey, we have provided alldefinitions on all important concepts used in thequestionnaire. Hence, we minimized the threat thatparticipants interpret concepts differently. However, itis not possible to completely eliminate this threat.External validity concerns generalization of theresults to other groups and contexts than the onestudied. The survey was sent to different groups ofSPM professionals, as is described in Section 4.2. Therespondents are mainly product managers with varyingexperience, working for companies of varying sizes.Most of the respondents are from the Netherlands.Given the diverse background of the respondentsconcerning company size and experience, we believethat the validity is high within the product managerpopulation in the Netherlands. Since we believe SPM isnot particularly influenced by culture, we believe thatwe can also generalize the results to other countries.However, to be sure, more research is needed.5. Implications and outlookThe SPM Maturity Model can be used to determinethe maturity level, but also be as a means to achieveprocess improvement by using it in the ProductSoftware Knowledge Infrastructure (PSKI) [21]. Theprocess improvement method consists of four stepsfollowed by a feedback loop. Firstly, the currentmaturity level of an organization needs to bedetermined by filling in the SPM maturity matrix.Secondly, the optimal maturity level for theorganization is determined; this is achieved by studyingthe situational factors [22] for the organization and itsenvironment. Thirdly, the differences between thecurrent and the optimal situation are analyzed andbetter suiting method fragments, selected from aknowledge base containing SPM method fragments, aresuggested for the suboptimal processes. An incrementalorder to improve the processes is then suggested as animprovement guide for the organization. Finally, afeedback loop incorporates the knowledge gained inthis process into the knowledge base of methodfragments.6. Conclusion and future researchIn this paper, we described the development of amaturity framework for SPM that can be used to assessan organization’s current SPM capabilities and offerlocal, incremental improvements to the productmanager. After developing the matrix, we used asurvey in which 45 SPM professionals reported byindicating the right order in which SPM capabilitiesshould be implemented in an organization. The resultsof this survey supported our initial positioning of theSPM capabilities, at least, when looking at the interprocess capability dependencies. Concerning the intraprocess capability dependencies, several deviationswere found, of which most of them have been used toimprove the matrix. Currently, we are carrying outmultiple case studies to refine the capabilities.We believe that the maturity matrix for SPM is avaluable tool for process assessment and improvementin SPM. In future research, we will carry out casestudies at different product software companies tofurther validate and refine the matrix in SPM capabilityimprovement.References[1] C. Ebert, “The Impacts of Software ProductManagement”, Journal of Systems and Software 80(6), 2007,pp. 850-861.[2] I. van de Weerd, S. Brinkkemper, R. Nieuwenhuis, J.Versendaal, L. Bijlsma, “Towards a Reference Frameworkfor Software Product Management”, Proc. of the 14th Int.Requirements Engi
Management (SPM) has a high impact on the success of a software product, as it improves product quality and prevents release delays. To improve the SPM practice, we propose the maturity matrix for SPM, a focus area oriented maturity model concentrating on the SPM functions Requirements Management, Product Roadmapping, Release Planning and