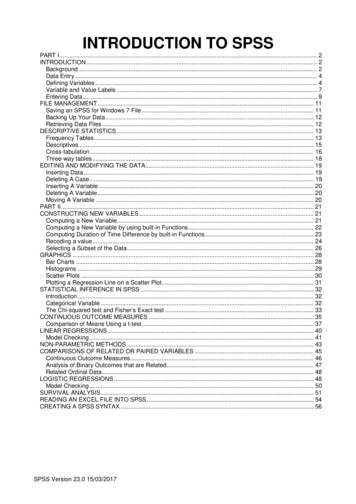
Transcription
Introduction toStatistics with SPSS forSocial ScienceGareth NorrisAberystwyth UniversityFaiza QureshiCity UniversityDennis HowittUniversity of LoughboroughDuncan CramerUniversity of LoughboroughLondonPEARSONHarlow,EnglandTokyoSeoul LondonTaipei New YorkNew Delhi Boston San FranciscoTown Sao PauloCape SydneyTorontoMexicoCity Madrid AucklandAmsterdamHong KongSingapore Munich ParisMilan
ContentsJGuided tourXVIIntroductionxviiiList of figuresListxxioftablesxxiiiList of boxesxxviiiList of calculation boxesxxixAcknowledgementsPart 1DescriptivexxxstatisticsWhy you need statistics: types of data3Overview31.1Introduction41.2Variables and measurement41.3Statistical significance61.4SPSS12guide:anintroduction7Key points19Describing variables: tables and diagrams20Overview202.1Introduction212.2Choosing tables and diagrams222.3Errors to avoid292.4SPSS292.5Pie2.6Bar chart of category data362.7Histograms38Key points393analysisdiagram of category dataDescribing variables numerically:34averages, variation andOverview3.1Introduction:spread4040mean,median and mode41
viiiCONTENTS.44of mean, median and ce intervals513.6SPSS51spread ofscores:45variabilityanalysis54/Cey po/nts4Shapes of55distributions of scoresOuerv/eiv554.1Introduction564.2Histograms and frequency4.3The normal curve574.4Distorted584.5Other Key points5Standard deviation, z-scores and standardmeasurement in statisticserror:the standard unit of67Overview675.1Introduction685.2What is standard deviation?685.3When to5.4When not to use standard deviation715.5Data requirements for standard deviation715.6Problems in the5.7SPSS5.8Standard5.9When to5.10When5.11SPSS70use standard deviationuse of72standard deviation72analysiserror:usethe standard deviation of thestandardnot to usemeansofsamples77errorstandardanalysis for standard77error77error80Key points6Relationshipsbetween twoor morevariables: diagrams and tables81Overview816.1Introduction826.2The6.3Type A: both variables numerical6.4Type6.5Type C:6.6SPSSprinciples of diagrammaticB: both variables nominaloneand tabular82presentation83scores84categoriesvariable nominal categories, the other numericalanalysisKey pointsV76scores868898J
CONTENTS7Correlation coefficients: the Pearson correlation 2Principles of the correlation coefficient1007.3Some rules to check out1067.4Coefficient of 7.9Scatter7.10108requirements for correlation coefficients108analysisrho-another correlation coefficient110114analysis for Spearman's rhodiagram usingProblems in theuseSPSS115of correlation coefficients117117Key points8Regression and eoretical8.3When and when not8.4Data8.5Problems in the8.6SPSS8.7Regression scatterplot8.8StandardPart 2background and regression equationsto use121125simple regressionrequirements for simple regression125simple regression125useof126analysiserror:how accurate129arethepredictedscoreand theregression equations?132Key points133Inferential statistics135V.9Theanalysis ofaquestionnaire/survey project137Overview1379.1Introduction1389.2The research9.3The research hypothesis1399.4Initial variable classification1409.5Further9.6Data cleaning9.7Data9.8SPSS analysis144Key points144projectcoding of dataanalysis138141142142
CONTENTS10The related f-test:relatedcomparing two samples of andDependent10.3Theoretical considerations14810.4SPSS 0.2147noteKey points11157The unrelated ical considerations16011.3Standard deviation and standard11.4A11.5Data11.6When not to11.7Problems in the11.8SPSS12cautionaryerrornote170requirements for the unrelateduse164f-testthe unrelated f-testuseof the unrelated f-testanalysis170170171171Key points175Chi-square: differences between samples of frequency al considerations17812.3When to usechi-square12.4When not touse12.5Data12.6Problems in the12.7SPSS12.8The i-square183of chi-square184analysis184exactprobabilityanalysis for the Fishertest189exact test192Partitioning chi-square19312.11Important warnings19512.12Alternatives to19512.13Chi-square12.10chi-squareand knownpopulations196Key points196Recommended further reading196
xiCONTENTSPart 313197;Introduction to analysis of varianceof varianceAnalysisor(ANOVA): introduction to one-way unrelated199uncorretated ANOVAOverview19913.1Introduction20013.2Theoretical considerations20013.3Degrees of freedom20413.4When toone-way ANOVA20413.5When not touse one-way ANOVA20513.6Data13.7Problems in the13.8SPSS analysis13.9Computer analysis foruserequirements foruse205one-way ANOVA205of one-way ANOVA205208one-way unrelated ANOVA211Key points14Two-way analysis of variance for unrelated/uncorrelatedtwo studiesfor thepricescores:of al considerations21414.3Steps14.4When to14.5When not to14.6Data14.7Problems in the14.8SPSS14.9Computer analysis for two-way unrelatedin theuse215analysis220two-way ANOVAtwo-wayuse220ANOVA220requirements for two-way ANOVAuse220of two-way omparisons testing inor moreindependentANOVAANOVA227233234239Key pointsAnalysis of covariance (ANCOVA): controlling for additional ple of the analysis of covariance24115.3When to15.4When not to15.5Data requirements for ANCOVA15use ANCOVAuseANCOVA250250250
CONTENTS15.6SPSS250analysisKey points257Recommended16further reading257analysis of variance 25916.2Questions26016.3MANOVA's two stages26116.4Doing MANOVA26216.5When to16.6When not to16.7Data16.8Problems in the16.9SPSSfor MANOVAuseMANOVAuse266MANOVA267requirements for MANOVA267of MANOVAuse268analysis268273Key pointsRecommended furtherPart 417readingMore advanced statistics and273techniques275Partial correlation:variables (controlspurious correlation, third or confoundingvariables), suppressor retical considerations27817.3The calculation28017.4Multiple control variables28217.5Suppressor variables28217.6An28217.7When to17.8When not to17.9Dataexample from the research literatureusepartial correlationusepartialcorrelationrequirements for partial correlation17.10Problems in the17.11SPSSuseof partial correlationanalysisFactor284284284284Key points18284287analysis: simplifying complex data288Overview28818.1Introduction28918.2Data issues in factoranalysis290J
CONTENTSxiii/Concepts in factor analysis18.4Decisions, decisions,18.5When to18.6When not to18.7Data requirements for factor18.8Problems in the18.9SPSS analysis299Key points306Recommended further toruse298analysisanalysisof factoranalysisMultiple regression and multiple 19.2Theoretical considerations30919.3Stepwise multiple regression example31419.4Reporting19.5What is stepwise multiple regression?31719.6When to31819.7When not to19.8Data19.9Problems in thethe resultsuse317stepwise multiple regressionstepwise multiple regressionuserequirementsforuseofstepwise multiple regressionstepwise multiple regression318319319319analysis19.10SPSS19.11What is hierarchical19.12When to use hierarchical19.13When not to19.14Data19.15Problems in the19.16SPSS analysis326Key points330Recommended further reading331logistic regression: distinguishing between severaldifferent categories or groups332Overview33220.1Introduction33320.2Dummy variables33520.3What can multinomial20.4Worked example33720.5Accuracy of the prediction33820.6How33920.7The20.8What have20V29118.3multiple regression?multiple regressionhierarchicaluserequirementsmultiple regressionfor hierarchicaluseof hierarchicalmultiple regressionmultiple ictors?335342predictionwelogistic regression do?found?344
XivCONTENTS20.9Reporting themultinomial logistic regression20.10When to20.11When not to20.12Data20.13Problems in the20.14SPSSuse345resultsusemultinomial logistic regressionrequirementsfor multinomialuselogistic regressionof multinomial logistic regression346346356Binomial357logistic regressionOverview35721.1Introduction35821.2Simple logistic regression35821.3Typical example36221.4Applying the logistic regression procedure36521.5The21.6Reporting21.7When to21.8When not to21.9Data368regression formula370the resultsusebinomial logistic regressionusebinomialrequirements21.10Problems in the21.11SPSSlogistic regressionfor binomialuselogistic regressionof binomial logistic regression370370370371371analysisKey points377Log-linear methods: the analysis of complex contingency tables378Overview37822.1Introduction37922.2A two-variable example38122.3A three-variable38822.4Reporting22.5When to22.6When not to22.7Data requirements for log-linear22.8Problems in the22.9SPSS22examplethe resultsuse398399log-linear analysisuselog-linear analysisuseanalysisof log-linear analysisfurther readingforA.lSkewnessA.2Standard400excessively skewed ommendedA399400analysisKey pointsV345346analysisKey points21345409409of skewness410J
CONTENTSBExtended table ofCTable of significance for the Spearman correlation coefficient416DExtended table of420ETable ofFExtended table ofsignificance for the Pearson correlation coefficientsignificancefor the f-testsignificance for chi-squaresignificanceGTable ofHTables of significance for thesignificanceITables ofJTable ofKV.XV424for thesigntest425for the Wilcoxon matched pairs testMann-Whitney L/-testof f whenmaking multiple429433significant values for the F-distributionsignificant values412436f-tests439Some other statistics in SPSS Statistics443Glossary445References453Index454J
12.4 When notto use chi-square 183 12.5 Data requirements for chi-square 183 12.6 Problems in the use ofchi-square 184 12.7 SPSSanalysis 184 12.8 TheFisherexact probability test 189 12.9 SPSSanalysisforthe Fisher exacttest 192 12.10 Partitioning chi-square 193 12.11 Importantwarnings 195 12.12 Alternativesto chi-square 195 12.13 Chi-square and .
