Transcription
COREMetadata, citation and similar papers at core.ac.ukProvided by HAL-UNICEStudy of Repair Protocols for Live Video StreamingDistributed SystemsFrédéric Giroire, Nicolas HuinTo cite this version:Frédéric Giroire, Nicolas Huin. Study of Repair Protocols for Live Video Streaming DistributedSystems. IEEE GLOBECOM 2015 - Global Communications Conference, Dec 2015, San Diego,United States. hal-01221319 HAL Id: tted on 27 Oct 2015HAL is a multi-disciplinary open accessarchive for the deposit and dissemination of scientific research documents, whether they are published or not. The documents may come fromteaching and research institutions in France orabroad, or from public or private research centers.L’archive ouverte pluridisciplinaire HAL, estdestinée au dépôt et à la diffusion de documentsscientifiques de niveau recherche, publiés ou non,émanant des établissements d’enseignement et derecherche français ou étrangers, des laboratoirespublics ou privés.
Study of Repair Protocols for Live Video StreamingDistributed SystemsFrédéric GiroireNicolas HuinCNRSSophia Antipolis, FranceEmail: frederic.giroire@cnrs.frInria Sophia AntipolisSophia Antipolis, FranceEmail: nicolas.huin@inria.frAbstract—We study distributed systems for live video streaming. These systems can be of two types: structured and unstructured. In an unstructured system, the diffusion is doneopportunistically. The advantage is that it handles churn, thatis the arrival and departure of users, which is very high inlive streaming systems, in a smooth way. On the opposite, ina structured system, the diffusion of the video is done usingexplicit diffusion trees. The advantage is that the diffusion isvery efficient, but the structure is broken by the churn.In this paper, we propose simple distributed repair protocols tomaintain, under churn, the diffusion tree of a structured streaming system. We study these protocols using formal analysis andsimulation. In particular, we provide an estimation of the systemmetrics, bandwidth usage, delay, or number of interruptions ofthe streaming. Our work shows that structured streaming systemscan be efficient and resistant to churn.I. I NTRODUCTIONWe consider in this study live streaming systems. In thesesystems, a source streams a video to a set of clients who wantto watch the video in real-time. Streaming video can be doneover a classic client/server architecture or a distributed (e.g.peer-to-peer (P2P)) one. Distributed solutions are very efficientfor live streaming scenarios in which clients watch the videoat the same time. The advantage is that the bandwidth of everyuser can be used to forward the video to other users, lighteningthe source load.P2P networks are of two types, with structured or unstructured overlays. In the first type, the nodes are organizedaccording to a (or several) logical tree(s), called diffusiontree(s). The source of the video is the root and the video isdistributed from the source to the leaves, fathers forwardingthe video to their children. In an unstructured overlay, the treeis not explicitly defined: a node having chunks of the videoforwards opportunistically these chunks to nodes who missthem. This second type of systems are the most frequentlyused as they handle very easily churn, i.e., the departureand arrival of users, which are very frequent in live videosystems. Frequent churn is the main problem of live distributedstreaming system and the main difference from classical multicast systems. Structured overlays have the disadvantage thatchurn breaks their diffusion trees. However, we have hints thatThis work has been partially supported by ANR project Stint underreference ANR-13-BS02- 0007, ANR program Investments for the Future under reference ANR-11-LABX-0031-01, ANR VISE, CNRS-FUNCAP projectGAIATO, the associated Inria team AlDyNet, the project ECOS-Sud Chile.such systems can in fact be very efficient. If their structurecould be maintained by using very simple distributed repairprotocols even under frequent churn, this would allow to keepthe advantages of structured overlays, optimal diffusion rateand continuity of the diffusion, while being resistant to churn.Goal of the study. Our goal is to propose simple distributedrepair mechanisms for structured live streaming systems. Tounderstand such systems, we then want to develop formalmodels, which can be efficiently simulated. Last, we aimat proving that they can be very efficient in practice (andpotentially more efficient than unstructured systems).Contributions. In this work, we study a structured networkfor live video streaming experiencing frequent node departureand arrivals.- We propose different repair protocols for the diffusiontree using different amount of information in Section II-B.- We show that a system using these protocols can be,first, formally analyzed and, second, efficiently simulated.We provide estimation of different system metrics, e.g.,bandwidth usage, delay, or number of interruptions of thestreaming, via simulations, as well as analysis.- We provide analytical formulas of the system’s metricsin Section III.- We developed a discrete-event simulator, presented inSection IV-A. We used it to compare the different repairprotocols. The results are presented in Section IV.- We present first evidences that, by using simple distributed repair protocols, structured live streaming systems can be very resistant to churn.A. Related Work.Structured versus Unstructured Systems. There are two major classes of P2P live video streaming architectures, the firstone being named either unstructured, mesh-based, gossipingor torrent-like; the second named either structured or treebased, see for example [1] or [2] for a classification. Notethat this distinction is not strict and that mixed systems werealso proposed, e.g. [3].Early systems, like [4], influenced by IP multicast, attempted at constructing a multicast tree to stream the media.To avoid the shortcomings such as resistance to churn and lowbandwidth usage, this simple idea has evolved into elaboratealgorithms like Splitstream, proposed in [5] or ZIGZAG, in
[6]. The signature of this group of systems is an active maintenance of an overlay structure that clearly defines the dataflow, thus the name structured overlays. SpreadIt, proposed in[7], is the closest work to ours. It considers multiple protocolsfor handling arrivals and departures of peers in the network butpresents few empirical results and no analysis of the system.On the other hand, we have systems inspired by BitTorrent,one of the best-known peer-to-peer protocols, described in [8].The core idea of this class of overlays is organizing the peersinto a random, highly-connected graph and disseminating thedata using a simple, probabilistic algorithm. The first instanceof an unstructured system was introduced in [9] as a wayof enhancing a single-tree overlay. It was then the base forthe first real peer-to-peer network that streamed video to abig number of simultaneous clients [1]. The characteristic ofthis group of networks is that they do not have an explicitoverlay structure for the data flow, thus the name unstructuredoverlays.Unstructured systems are widely regarded the better choice.That is often explained by the complexity of making a structured system reliable. However, we show in this study thatreliability can be ensured, for a simple system, efficiently bya simple algorithm.Analysis of Structured Systems. The existing analysis ofthese systems focus on the feasibility, construction timeand properties of the established overlay network, see forexample [5], [10] and [11] for a theoretical analysis. Butthese works usually do not consider over the issue of treemaintenance. Generally, in these works, when some elementsof the networks fail, the nodes disconnected from the rootexecute the same procedure as for initial connection. This isnot the case in our study. To the best of our knowledge, thereare no theoretical analysis, except [12], on the efficiency oftree maintenance in streaming systems, reliability is estimatedby simulations or experiments as in [5].In [12], the authors propose an efficient maintenance schemefor trees. The distributed algorithm ensures that the tree fastlyrecovers to a “good shape” after one or multiple failures occur.The authors give analytic upper bounds of the convergencetime. This paper is a starting point of our study. We introducenew repair algorithms and then provide an average caseanalysis of these protocols.II. D ISTRIBUTED P ROTOCOLS AND M ODELINGA. ModelingWe consider a system, a source streaming a live video, andn nodes which want to watch the video. A summary of thevariables used in this work is given in Table I. This source isthe single reliable node of the network, all other peers may besubject to failure. Nodes are organized according to a tree ofsize n 1. The source is the root of the tree. Nodes forwardthe video to their children in the tree. Each node has a givenbandwidth allowing him to serve a given number of othernodes d. In this study, we consider that all nodes have thesame bandwidth 2. A node is said to be overloaded, whenit has more than d children. In this case, he cannot serve allSignificationNumber of nodes of the tree, root not includedNode bandwidth (or ideal node degree)Height of the tree (root is at level 1)Repair rate (avg. operation time: 100 ms)Individual churn rate (avg. time in the system:10 min)System churn rate (Λ λn)ΛValuesTerminologyunit of time100 mssystems with low churnΛ [0, 0.4]systems with high churn Λ [0.4, 1]Default value10222101Variablendhµλ1600010226000 0.17TABLE I: Summary of the main variables and terminologiesused in this work.66712313 15 14 16 17 1812713 15 14 16317 18Fig. 1: Example of a push operation carried out by theoverloaded Node 6.its children and some of them do not receive the video. Notethat the delay between broadcasting a piece of media by thesource and receiving by a peer is given by its distance fromthe root in the logical tree. Hence our goal is to minimize thetree depth, while following degree constraints.Each node applies the following algorithm without theknowledge of the whole network.- When a node is overloaded, it carries out a push operation. It selects two of its children, and the first oneis reattached to the second one, becoming a grandchild.Figure 1 presents an example of such operation.- When a node leaves the system, one of its child isselected to replace him. It reattaches to its grandfather.The other children reattach to it. An example is given inFigure 2. In this work, we only consider single failurebut multiple failures could be handled by considering thegreat grandfather of a node or by reattaching to the root.- When a new node arrives, it is attached to the root.Churn. We model the system churn rate with a Poisson modelof rate Λ. A node departure (also called churn event) occursafter an exponential time of parameter Λ, that is in averageafter a time 1/Λ. We note the individual failure rate λ Λ/n.In this work, we study scenarios with constant size population.11636712 13 14 1512 13714 15Fig. 2: Example of the operation made after the departure ofNode 3.
Thus, when a node leaves the system, we consider that a newnode appears. Authors in [13], [14] carried out a measurementcampaign of a large-scale overlay for multimedia streaming,PPLive [15]. Among other statistics, the authors report thatthe median time a user stays in such a system is around 10minutes. In this study, we use this value as the default value(after normalization see the following on default values).Repair rate. When a node has a push operation to carry out,it has first to change its children list, and then to contactits two children implicated in the operation so that they alsochange their neighborhood (father, grandfather or children).This communication takes some amount of time, that can varydepending on the node to contact and congestion inside thenetwork. To take into account this variation, we model therepair time as a random variable with exponential distributionof parameter µ. [16] reports that the communication time in astreaming system is in average 79 ms. Thus, we believe thatassuming an average repair time of 100 ms is appropriate.Default values. In the following, for the ease of reading, wenormalize the repair rate to 1. We call unit of time the averagerepair time, 100 ms. The normalized default churn rate, λ isthus 1/6000 and the system churn rate is Λ nλ 0.17.These default values are indicated as typical examples, but inour experiments we present results for a range of values of Λbetween 0 and 1. We talk of low churn systems for values ofΛ below 0.4, and of high churn systems for values above 0.4.B. Description of the ProtocolsWe now define four different protocols according to fourdifferent ways to select the children during the operations andfour different levels of knowledge of the streaming system. Wewill study the trade-off between knowledge and performancein the following.S MALLEST S UBTREE P ROTOCOL (SSP). In this protocol,each node knows the subtree size of each of its sons. Whena churn occurs, the son with the largest subtree of the failingnode takes over the role of its father by adopting every of itssibling. It is itself adopted by its grandfather. When a nodeis overloaded, its son with the third largest subtree is pushedinto the son with the second largest one.R ANDOM P ROTOCOL (RP). In this protocol, nodes do notkeep information about their subtree sizes. They store theirchildren in a queue and each new node attached to them is putat the end of it. A node receiving the video only gives it to thetwo children at the start of its queue. When a churn occurs,the eldest son takes over the role of its father by adoptingevery of its sibling. It is adopted by its grandfather. There isno interruption in the video transmission between the son andthe father. The order in the grandfather children is conserved(i.e. If the father was the first child of its parent, the son takesthe first place in the grandparent sons). Every of its siblingis reattached to the new father and thus is at the end of thequeue, in the same order as it was in the failing node queue.An overloaded node chooses at random the son that willbe pushed and also the node that will receive the pushed node.N O I NTERRUPTION P ROTOCOL (NIP) This protocol sharessome similarity with the random protocol. The same operationis done when a node leaves the system: the eldest childtakes over the role of the failing node. When an overloadedcarries out a push operation, it chooses uniformly at randoma node not receiving the video and pushes it under a nodereceiving the video. This ensures no interruption of the videodistribution.PARTIAL I NFORMATION P ROTOCOL (PIP) The idea of theprotocol starts with the observation that for most operations,it is relatively easy to determine the largest subtrees withoutstoring the exact size of all subtrees. When a new nodearrives, we know that it has a subtree size of one and that ithas to be pushed to the bottom of the tree. So we will labelit as new. Then, during this arrival process, we will have todecide in which subtree to push it. If we do the hypothesisthat the tree stays relatively well balanced during the protocollifetime, we may choose at random without adding too muchimbalance in the tree. When there is a churn, we know thatone of the children replaces its father. It will have threechildren, one large (its former brother), that we label big, andtwo smaller ones, that we label normal. Hence, it has to pushone of the smaller into the second one. Again, if we supposethat the tree is relatively balanced, this choice can be maderandomly. The subtree pushed is relabeled as big, its newbrothers are labeled as normal, and we remove the label ofits former brothers.C. MetricsTo evaluate the performance of the different protocols, weare interested by the following metrics.Time to attach a new node. When a new node arrives into thesystem, it has to attach to a node which has enough bandwidthto forward the video to it. Basically, it is first attached to theroot and then pushed to the bottom of the tree to become aleaf. Ideally, this takes a small amount of time, logarithmic inthe number of nodes watching the video, n, see Section III.Repair time after a node departure. When a node leaves thesystem, a repair processed starts as described in Section II-A.Basically, one of its son replaces it and some nodes are pushedin its subtree. The simulator records this repair time at eachchurn event.Number of people not receiving the video. Due to thesetwo phenomenas, attachment of a new node and repairs, somepeople do not receive the video during small periods of timeduring the life of the protocols. We study what fraction of thenodes do not receive the video and during which amount oftime.Height of the tree or delay. The height of the diffusion treegives the maximum delay between the source and a node.Ideally, it is equal to blogd nc 1, where d is the maximumnode degree.
Number of interruptions and interruption duration. Wemonitor the number of interruptions of the video diffusion toa node during the protocol lifetime, as well as the distributionof interruption durations.III. A NALYSISIn this section, we analyze the S MALLEST S UBTREE P RO TOCOL . We give analytical formulas to estimate differentmetrics: the repair time, the average number of people notreceiving the video, and the number of interruptions.The analysis is done under an independence hypothesisof the failures, meaning that the repair of one failure isdone before another happens. Remark that it implies thatthe diffusion tree is always a balanced binary tree when afailure happens. Indeed, we are considering a system withconstant population in which a new node arrives when a nodeleaves. Using the information about subtree sizes, SSP willpush this new node in the optimal position. We will considerhere complete binary trees of size n 2h 2, but theanalysis extends to other values. The independence hypothesisis evaluated by simulation for different values of churn inSection IV-B.Analysis of the repair time. We study the repair time ofthe diffusion tree when a node selected at random leaves thesystem. We consider the position of the node in the tree.If the failing node is a leaf, the tree is still balanced andnothing happens.If the failure happens at depth i h, the tree is repaired(that is, all nodes have degrees less or equal to 2) after h i 1push operations. Note that when i h 1, no pushes areneeded.We give now the average time to repair the tree after a nodedeparture. In average, a node carries out an operation in a time1µ . Hence, the average time to carry out h i 1 operations ish i 1. The number of nodes at depth i, 2 i h, is 2i 1 .µThus, the probability that the node leaving the system is ati 1depth i is 2 n . Recall than n 2h 2. If we note T the timeto repair the diffusion tree, we haveh 1Ph 2E[T ] 2h1 2 i 2 2i 1 h i 1 2 µ(2 2(h 1)h 2)µ1 2µwhen h is large.The S MALLEST S UBTREE P ROTOCOL is very efficient. Indeed, only one half operation is needed in average to repairthe tree after a node departure.Analysis of the number of nodes not receiving the video.During the repair process, some nodes do not receive thevideo. Indeed, recall that only the two biggest subtrees of anoverloaded node receive the video. When a node at level ileaves the system, its child with the largest subtree replacesit. It becomes overloaded with three children of subtree sizes2h i 1, 2h i 1 1, and 2h i 1 1 (A node at depth iis of height h i 1. A subtree of height i contains 2i 1nodes). Thus, 2h i 1 1 nodes do not receive the video. Ateach repair, the height of the tree is reduced by one and thisnumber is divided by around two. That is after k repairs, it isFig. 3: Effect of a push operation during a repair.equal to 2h i 1 k 1, see Figure 3. A push operation is donein average in a time µ1 . Hence, if we note ni the number ofpeople without video when the failing node is at level i, wehaveE[ni ] h i 1 Λ X kΛ h i2 h i 1 .(2 1) µµk 0Recall now that the probability that the failing node is at leveli 1i is 22h 2 . If we note nbad , the number of people withoutvideo, we haveE[nbad ] 2h 1 (h 5) 2(h 1) Λ2i 1i 2 2h 2 ni µ2h 2h 5 Λwhenhislarge.2 µPh 2Analysis of the number of interruptions. Recall that whena node leaves the system at level i, its first child is overloadedwith three children of subtree sizes 2h i 1, 2h i 1 1, and2h i 1 1. Only the two biggest sons of a node receive thevideo. Thus, 2h i 1 1 nodes are interrupted. With a repair,the interruption for these nodes stops and the height of the treeinterrupted is reduced by one, that is after k repairs, it is equalto 2h i 1 k 1. Every interrupted node is only interruptedonce. Hence, if we note inti (t) the number of interruptionwhen the failing node is at level i as a function of the time,we haveE[inti (t)] tΛh i 1X2k 1 tΛ(2h i h i 1)k 0Recall now that the probability that the failing node is ati 1level i is 22h 2 . If we note nint (t), the average number ofinterruptions, we haveE[nint (t)] 2h 1 (h 5) 2(h 1)2i 1tΛi 2 2h 2 inti 2h 2h 5tΛwhenhislarge.2Ph 2Analysis of the arrival time. When a new node arrives inthe system, it is first attached to the root. It does not receivethe video until it is then pushed to the bottom of the tree byh 2 successive push operations. Since a node carries out anoperation in an average time of µ1 , if we node T the time forthe new node to receive the video, we have:E[T ] h 2.µ
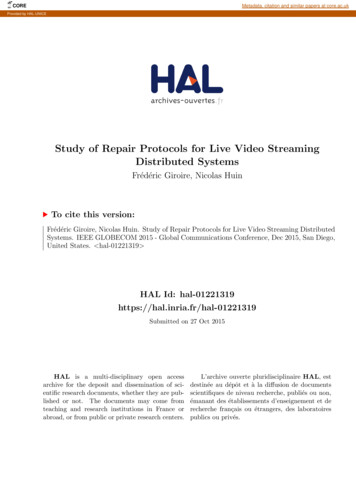
.050050400403002001000.5Churn1.0Fig. 4: Comparison between the formal model of Section IIIand the simulations for: (Left) Average fraction of peers notreceiving the video as a function of the churn rate due to therepair (1022 nodes). (Right) Average number of interruptionsper node (1022 nodes) for a time of 30,000 units of time.IV. S IMULATIONSWe developed a discrete-event simulator of the streamingsystem described in Section IV-A. We use it to analyze andcompare the different protocols. A summary of results isprovided in this section for different metrics.A. The simulatorOur desire to focus on high level simulation led us todevelop a custom C discrete-event simulator to evaluatemetrics of the system described in Section II-C. We did not uselow level network simulators like NS-2 or OMNET becausethey would require more computation time and give metricsnon pertinent to our analysis. Our goal is to focus on the treestructure after churns and reparations to validate our protocols.B. Validation of the analytical modelTo validate our analysis, we first compared the resultsgiven by the simulator to the analytical formulas obtained inSection III.People without the video. In Figure 4 (Left) is given theaverage fraction of people not receiving the video. New nodesjoining the systems are not taken into account until they startto receive the video. Only the non distribution of video due tothe repairs is counted. As an example, for the default churnrate value, 0.17, only 0.03% of the nodes do not receive thevideo in average, and for a high value of churn 1, only 0.25%.We see that the closed formula models very closely thesystem. Recall that the formulas were given for low churn,that is when a churn event is repaired before another churnevent. This corresponds to values of the churn rate Λ between0 and 0.5. However, we see that, even for larger churn values( 0.5), the system behavior is well predicted by the formula.Interruptions. The average number of video interruptions isgiven in Figure 4 (Right) as a function of the churn rate. Again,the interruptions are due to the repair of the diffusion tree whenthere is a node departure.This number is the average over all nodes of the numberof interruptions per node for a period of 30,000 units of time.For example, for a value of churn of 0.2, the diffusion fora node is interrupted 20 times in average, that is, a 0.2%Number of interruptionsPeers without video0.25%3020101.000.00.5Churn1.0Fig. 5: Average height (over time) of the tree (1022 nodes) asa function of the churn rate for the four repair protocols. Left:y-axis range from 0 to 500. Right: y-axis range from 0 to 50.experiences an interruption every 1500 units of time, thatis every 150 seconds. As we will see it later, the durationsof the interruptions are very short. Thus, they are withoutconsequence for the end-user experience.We see that the analytical formula gives a very goodestimation of the behavior of the system. This is true evenfor high churn.C. Comparison of the protocolsIn this section, we compare by simulation the performancesof the different protocols that we propose. Recall that thesedifferent protocols use different levels of information. Severalproviders of live video may have different criteria on the different metrics and on the implementation, leading to differentchoices of the adequate protocol.Levels of needed information. We recall that, for everyprotocol, each node has at least to store the ids (and addresses)of children, father and grandfather. In RP and NIP, each nodestores the order in which its children attached to it. In SSP,each node needs to know the size of its subtree. Last, in PIP,only two additional bits are necessary: a new node arrivingin the system is tagged as new till it finds a place in thediffusion tree and a node pushed by a repair process is taggedas big. For the detailed discussion, the reader may refer itselfto Section II-B.We now compare the protocols for the different metrics. Aswe will see, the protocols do not behave at all similarly forsome metrics. To improve the readability of the figures, foreach metric, we propose two plots with the same data, butwith different scales of the y-axis.Height of the diffusion tree and delay. Figure 5 shows theaverage height (over time) of the tree as a function of thechurn rate.The first observation is that RP exhibits a very differentbehavior than the other protocols, see Figure 5 (Left). Itbehaves very badly: the height of the diffusion reaches a valueof 500. It is not of order logarithmic in n, the number ofnodes. On the contrary, it gets close to a linear height! Thediffusion tree looks like a path in this case. The protocol is veryinefficient. Thus, pushing the nodes randomly is not possiblein practice.
20%10%0%0.00.5ChurnPeers w\o videoPeers w\o .0Number of interruptionsFig. 6: Average fraction of peers not receiving the video asa function of the churn rate (1022 nodes). Left: y-axis rangefrom 0 to 60%. Right: y-axis range from 0 to 1501001.05000.00.5Churn1.0Fig. 7: Average number of interruptions of the streaming pernode as a function of the churn rate after 10,000 units of time.Left: y-axis range from 0 to 2500. Right: y-axis range from 0to 200.We see again, in Figure 6 (Left), that RP behaves a lotworse than the other three protocols. As much as 52% of thenodes do not get the video for a churn rate of 1. It alreadyreaches 6% for a churn rate of 0.5. This protocol is thus veryinefficient.The three other protocols, SSP, NIP and PIP, behavesimilarly, and are very efficient. The average percentage ofpeople without the video is very small for churn valuesexpected in a viable live streaming system (churn rate between0 and 0.4). For a churn rate of 0.2, the average percentage isrespectively 0.04%, 0.1% and 0.15 % of the nodes for thethree protocols, see Figure 6 (Right).Number of interruptions during the diffusion. We studiedthe number and durations of interruptions of the video diffu-60%50%40%30%Time of interruptionsThe explanation of the different protocols’ efficiency is dueto their different behaviors, (1) when there is a churn event,and, (2) when there is an arrival of a new node.First, when a failing node is close to the root, a large subtreedoes not receive the video anymore and has to be pushed inthe tree by the repair process. The SSP protocol succeeds toreconstruct a perfectly balanced tree by using the informationabout the subtree sizes. It knows exactly what is the rightnode to push. The two protocols RP and NIP do not havethis information: they blindly push the subtree. It can thushappen that a large subtree ends up at the bottom of the treeat the end of the repair process. This can increase its heightsignificantly: in the worst case, the height can be doubled withonly one churn event. We see that PIP has performance not toofar from optimal. We see that, even without the informationof the subtree sizes, a simple guess of the node to be pushedis efficient in terms of delay. The protocols recognizes largesubtrees (of size 2i ) from small subtrees (of size 2i 1 ), leadingto a near optimal repair process.Second, when there is an arrival of a new node in the tree.SSP can push this new node exactly at the right position of thediffusion tree. PIP and NIP cannot distinguish two subtreeswith a small difference of size and thus push the new noderandomly to the bottom of the diffusion tree. RP has in thiscase a very bad behavior. As it does not have any information,it does not know that a node is new. Hence, it pushes randomlya node that can have a very large subtree, instead of the newnode of subtree size one! On the contrary, NIP does not pushsubtrees receiving the video to ensure a continuity of the videodiffusion. Hence, the arrival of a new node in the systemcannot trigger that a large subtree is pushed at the bottomof the tree.To sum up, the repair protocol SSP is optimal in terms oftree height and, thus, of delay. This protocol uses informationabout node subtree sizes. If this information is consideredtoo costly to maintain
Study of Repair Protocols for Live Video Streaming Distributed Systems Fr ed eric Giroire, Nicolas Huin To cite this version: . Huin. Study of Repair Protocols for Live Video Streaming Distributed Systems. IEEE GLOBECOM 2015 - Global Communications Conference, Dec 2015, San Diego, United States. hal-01221319 HAL Id: hal-01221319 https://hal .