Transcription
Haplotype Frequencies andLinkage DisequilibriumBiostatistics 666
Last LecturenGenotype FrequenciesAllele FrequenciesPhenotypes and PenetrancesnHardy-Weinberg EquilibriumnnnSimple demonstration
Exercise:NOD2 and Bowel DiseasenLeu1007fsnnnnPenetrancennnFrame shift mutation at position 1007Frequency of about 5%Disrupts geneGenotype / P(Crohn’s G) 0.1%-/ 0.2%Calculate frequency of -/- genotype inpopulation and among patients -/3%
Haplotype or Gamete FrequenciesBbAp ABp AbpAapaBpabpapBpb
Typical Genotype DatannnnTwo alleles for eachindividualObservationCTGChromosome origin foreach allele is unknownMany haplotype pairsmight be compatible withobserved dataWill ignore this complexityfor now GCAMarker1Marker2Marker3Possible StatesCTGGCACCGGTACCAGTGCTAGCG
Linkage EquilibriumnnIn a large random mating populationhaplotype frequencies converge to asimple function of allele frequencies(The reverse is always true!)
Linkage Equilibriump AB p A pBp Ab p A pb p A - pBpaB pa pB - p A pBpab pa pb - pA- pB
A new mutation Before MutationAGCGAfter MutationAGCGCCMutation
For a new mutation nOne haplotype frequency is zeronLinkage disequilibrium does not holdnnIn contrast, linkage disequilibriumHow is linkage equilibrium reached?
RecombinationABefore RecombinationGCGCCAAfter RecombinationGCGCCAGRecombinant Haplotype
Equilibrium or Disequilibrium?nnWe will present simple argument forwhy linkage equilibrium holds Balance of factorsnnnnGenetic drift (a function of population size)Random matingDistance between markers
Linkage Disequilibriump AB ¹ p A pBp Ab ¹ p A pb p A - pBpaB ¹ pa pB - p A pBpab ¹ pa pb - pA- pB
Disequilibrium Coefficient DABDAB p AB - p A pBp AB p A pB DABp Ab p A pb - DABpaB pa pB - DABpab pa pb DAB
DAB is hard to interpretnSign is arbitrary nnWe could set A, B to be the common alleleand a, b to be the rare alleleThe range of DAB depends on allelefrequenciesnHard to compare between markers
Range of DABnMust be greater thannnMust be smaller thannnMax(-pApB,-papb)Min(pA - pApB, pB - pApB)These constraints ensure that nohaplotypes have negative frequencies
Alternative MeasuresnThe most popular measuresnnnD’ and D’ D²Other common measuresnnChi-squaredP-value
D²2DABD² p A (1 - p A ) pB (1 - pB )c² 2nnRanges between 0 and 1nnn1 when the two markers provide identical information0 when they are in perfect equilibriumExpected value is 1/2n
D’DABìïï max( p p , p p )A Ba bD ' AB íDABïïî min( p A pb , pa pB )nDAB 0DAB 0Ranges between –1 and 1nnMore likely to take extreme values when allelefrequencies are small 1 implies at least one of the observed haplotypeswas not observed
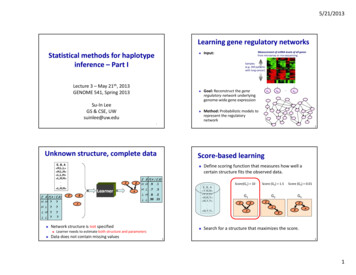
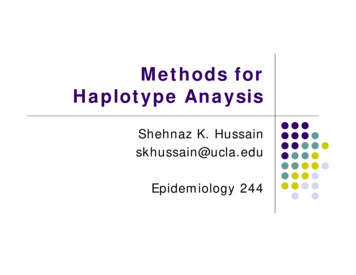
Raw D’ data from Chr221.000.80D'0.600.400.200.000200400600Physical Distance (kb)8001000
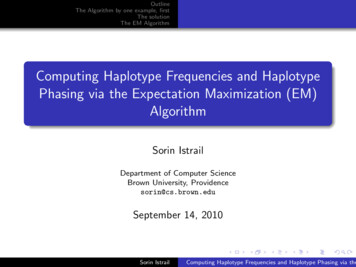
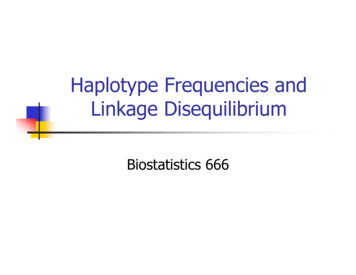
Raw D² data from Chr221.000.80r20.600.400.200.000200400600Physical Distance (kb)8001000
Why Equilibrium is Reached nnEventually, random mating andrecombination should ensure thatmutations spread from originalhaplotype to all haplotypes in thepopulation Simple argument:nAssume fixed allele frequencies over time
Recombination FrequencynRecombination frequency 0.50nnFor loci on the same chromosomeObserved recombination refers to an oddnumber of crossovers
Recombination Rate (q)nnnProbability of an odd number of crossoversbetween two lociProportion of time alleles from two differentgrand-parents occur in the same gameteIncreases with physical (base-pair) distance,but rate of increase varies across genome
Without RecombinationAaBp A pB DABbp A pb - DABpa pB - DABpBpa pb DABpbpApaHaplotype Frequencies Remain Stable Over TimeP 1- q
With RecombinationAaBp A pBbp A pbp A pbpBpa pbpbpApaHaplotype Frequencies Are Function of Allele FrequenciesP q
Overall ChangeAaBp A pB (1 - q ) DABbp A pb - (1 - q ) DABp A pb - (1 - q ) DABpBpa pb (1 - q ) DABpbDisequilibrium Decreases pApa
PredictionsnDisequilibrium will decay eachgenerationnnAfter t generations nnIn a large populationDtAB (1-q)D0ABA better model should allow for changesin allele frequencies over time
ulation APopulation B
StratificationnDue to non-random matingnnAllele frequencies drift apart in each groupnnEg. Mating based on proximity or cultureEg. Allele frequency differences at many genesbetween African-Americans and CaucasiansDisease prevalences may also differnEg. Glaucoma has prevalence of 2% in elderlyCaucasians, but 8% in African-Americans
Microsoft PowerPoint - Lecture 03 - Haplotype Frequencies and Linkage Disequilibrium Created Date: 1/17/2003 2:55:09 PM .