Transcription
Methods forHaplotype AnaysisShehnaz K. Hussainskhussain@ucla.eduEpidemiology 244
OutlinezzzzDefinitions (review)Background: Why are haplotypesimportant in genetic association studies?How are haplotypes inferred?How are haplotypes analyzed?zzzTraditional methodsHaplotypes vs. diplotypesHaplotype reduction methods
Haplotypes?zA haplotype is the pattern of nucleotideson a single chromosomezTwo “copies” of each chromosomezThe haplotype inference problem?TT?CGGT?AATA TT CG GG TA AA?ATT?GG?AAA
Diplotypes?zzA pair of haplotypes is called a diplotypeDiplotypes are to haplotypes, whatgenotypes are to alleleTTCGTAATGGAA
Linkage Disequilibrium (LD)?zzLD describes the association betweenalleles on the same haplotype A BTwo popular LD statistics:zzD , r2Example:z2 SNPs, 4 possible haplotypes
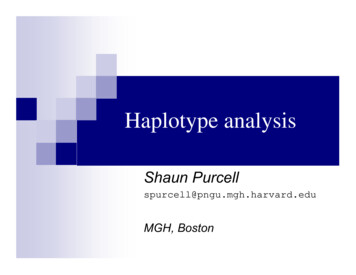
Complete LDA BzzzUnequal allele frequency,allelic association is asstrong as possible3 haplotypes observedNo detectedrecombination betweenSNPzD 1zr2 1
Perfect LDA BzzzEqual allele frequency,allelic association is asstrong as possible2 haplotypes observedNo detectedrecombination betweenSNPzD 1zr2 1
Background
Why do we care abouthaplotypes?zzKnown SNPs do not capture all patterns ofvariation in the human genomeBasing haplotypes on known SNPs willincrease the diversity of observable patternsof variationminimal allele expected SNPs expected SNPfrequency(millions)frequency d % indatabase11-1218-2023-2724-28L. Kruglyak and D. Nickerson, Nat Genet 27:234-236 2001
Why do we care abouthaplotypes? (2)zzHelp us identify associations with the causalvariant if the causal variant is rare and onone of our observed haplotypesUsed to address higher order associations(G X G effects)
Statistical Inferenceof Haplotypes
When is phase ambiguous?zzHaplotypes can be reconstructed with 100%accuracy if no more than 1 SNP isheterozygousOtherwise, phase is ambiguous and there willbe uncertaintyGenotypeAAAaaaBBAB ABAB aBaB aBBbAB AbAB ab or Ab aBaB abbbAb AbAb abab ab
Algorithms for HaplotypeInferencezBayesian methodszze.g. PHASE (Stevens, 2002), HAPLOTYPER(Niu, 2002)Likelihood-based methodzExpectation-Maximization algorithm: e.g.SNPHAP (Clayton, 2001), Haploview(Barret, 2005)
Haplotype Analysis
There are MANY approaches:programs in SAS GENETICS, Stata, RzZhao et al. (2000) Hum HeredzzZaykin et al. (2002) Hum HeredzzHplus, generalised estimation equations (GEE) frameworkEpstein & Satten (2003) Am J Hum Genetzzhaplo.score, haplo.stats and hapassoc, generalised linearmodel (GLM) frameworkZhao et al. (2003) Am J Hum GenetzzHTR, Haplotype trend regressionSchaid et al. (2002), Lake et al. (2003), Burkett et al.(2004) Hum HeredzzEHPLUS/GENECOUNTING, global haplotype specific testsCHAPLIN, logistic regressionTzeng et al. (2006) Am J Hum GenetzR program, GLM with haplotype clustering
PHASE (Stevens, 2002)zHaplotype reconstruction, and recombinationrate estimation from population datazCan get global p-value for binary outcomezLinux and WindowszfastPHASEzzHandles larger data-sets (e.g., hundreds ofthousands of markers in thousands of individuals)Haplotype estimates are slightly less accurate
PHASE input data format10974P 495 993 2038 2340SSSS230100GTCCTGCC230171GGCTTGCC230472TTCCTTCC
PHASE output: best 168TTCCTGTC
PHASE output: all pairs435196TGCC , GGCC , 0.186TTCC , GGCC , 0.479TGCT , GGCC , 0.226TGTC , GGCC , 0.101435316TTCC , GGCC , 1.000435358TTCC , TGCC , 1.000435442TTCC , GGCC , 0.481TGCC , GGCC , 0.186TGTC , GGCC , 0.102TGCT , GGCC , 0.227
Regression analysis accountingfor Phase uncertaintyzxi: logistic cursmoke i.il2 hap [pw prob],cluster(studyid)
IFNG tagSNPs & cigarette smokinginteraction in cervical cancer n odds ratio (95% 6421.3 (0.6-2.7)AA89361.00TATT1506941301.2 (0.7-2.1)0.8 (0.4-1.5)AAAG8914736401.001.2 (0.7-2.1)1.00GG69300.8 (0.4-1.5)0.7 (0.4-1.2)IFNG tagSNP/genotypeUnrestrictedmodel1.001.4 (0.9-2.3)0.6 (0.3-1.2)Recessive model1.000.5 (0.2-1.0)1.00-1.000.7 (0.4-1.2)
IFNG diplotypes & cigarette smokinginteraction in cervical cancer riskDiplotype FrequenciesHaplotype 1 Haplotype 2Non/Formersmokingcases(N 194)Currentsmokingcases(N 114)Interaction oddsratio (95% 250.180.6 (0.3-1.1)C-C-A-AC-C-A-A0.170.090.4 (0.2-0.9)T-C-A-AT-C-T-G0.120.150.9 (0.4-2.0)T-C-A-AC-C-A-A0.090.111.0 (0.4-2.3)T-C-T-GT-G-A-A0.070.050.6 (0.2-1.6)T-C-A-AT-C-A-A0.020.031.3 (0.3-7.0)T-G-A-AC-C-A-A0.020.031.8 (0.4-8.4)T-C-A-AT-G-A-A0.010.022.6 (0.2-30.5)
PHASE output: 2016310.20452
Recombination hotspot in SELP
HPlus (Li and Zhao, 2003)zzzzzHaplotype reconstruction and associationtestingBinary outcome, continuous outcome,survivalCovariates and gene-environmentinteractionsOutputs risk estimates and 95% CIWindows
Pitfalls of traditional haplotypeanalysis methodszMultiple testing (false positives increase)zzRare haplotypes (false negatives increase)zzFor 4 SNPs in a gene, there are 24 16 possiblehapltoypes; for 10 SNPs there are 1024Common SNPs can still lead to rare haplotypes, andyour study may not be adequately powered for thatSolution: combine haplotypes But how?
Rapidly evolving methodszCladistic and Phyogenetic analyseszzClusteringzz(McPeek and Strahs, 1999; Beckman,2005)Variable-sized sliding windowzz(Zollner and Pritchard, 2005)Haplotype sharingzz(Liu, 2001; Yu, 2004;Morris, 2005; Waldron, 2006)Coalescent methodszz(Durrant, 2004; Tamura, 2007)(Li, 2007)Sequential haplotype scanz(Yu & Schaid, 2007)
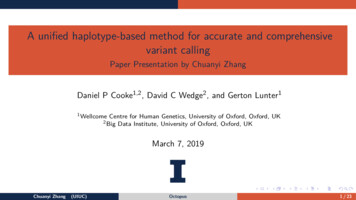
MEGA, version 3.1zzzInfers ancestral relationships betweenstatistically inferred haplotypesInferences are based on the number ofnucleotide differences between haplotypesfrom the rootBranch lengths are proportional to thesedifferences
Phylogenic tree of the 41observed POU5F1 haplotypesEDADHussain et al. BMC Genetics 2008 9:15
Sequential haplotype scanzzzWhen evaluating the significance of a SNP,neighboring SNPs are added in a sequentialmannerSNPs are kept if their contribution to thehaplotype association with disease iswarranted conditional on current SNPs in thehaplotypeThe conditional test is a Mantel-Hansel, whichis computationally easy
Example: CD83 gene & cervicalcancer riskzThere are 16 SNPs, generally in low ele(major/minor)Freq. .360.400.050.200.200.40
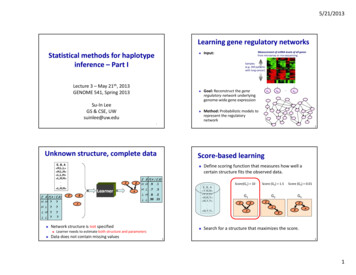
Sequential scan results for CD83(removed one SNP in high LD with one left in)seq-loc-1 1seq-loc-2 2seq-loc-3 3 4seq-loc-4 4seq-loc-5 5seq-loc-6 6seq-loc-7 7 8 9seq-loc-8 8 9seq-loc-9 9seq-loc-10 10 11 9seq-loc-11 11seq-loc-12 12 11seq-loc-13 13seq-loc-14 14 13seq-loc-15 15
SNPs in 5, rs3799924 (chi-square, 2-df: P 0.10)CA0.56GG0.180.26GArs7743206, rs9296925, rs853360 (chi-square, 3-df: P 0.01)GGG0.36GAA0.250.16AGGGAG0.23rs9296925, rs853360 (chi-square, 2-df: P 0.01)GG0.52AA0.250.23AGrs853360, rs3734665, rs10949227 (chi-square, 4-df: P 0.01)GAG0.31AAA0.20GAA0.27GGA0.15rs10949227, rs9370729 (chi-square, 3-df: P 0.14)AG0.41AA0.23GA0.35rs17354216, rs750749 (chi-square, 2-df: P 0.02)AA0.75AG0.200.05GAFreq. amongcontrols‡Freq. amongcases‡OR (95% CI)‡0.550.200.250.570.150.281.00 (ref.)0.71 (0.50-1.02)1.11 (0.82-1.51)0.340.270.160.220.400.190.160.251.00 (ref.)0.55 (0.38-0.79)0.83 (0.56-1.21)0.93 (0.66-1.32)0.500.270.220.570.190.251.00 (ref.)0.59 (0.42-0.83)0.98 (0.71-1.36)0.290.220.270.140.350.150.250.181.00 (ref.)0.49 (0.32-0.76)0.74 (0.52-1.06)0.97 (0.63-1.50)0.420.240.330.390.200.401.00 (ref.)0.93 (0.66-1.30)1.32 (0.97-1.78)0.730.210.050.800.180.021.00 (ref.)0.75 (0.53-1.05)0.40 (0.19-0.88)
zZhao et al. (2000) Hum Hered zEHPLUS/GENECOUNTING, global haplotype specific tests zZaykin et al. (2002) Hum Hered zHTR, Haplotype trend regression zSchaid et al. (2002), Lake et al. (2003), Burkett et al. (2004) Hum Hered zhaplo.score, haplo.stats and hapassoc, generalised linear model (GLM) framework zZhao et al. (2003) Am J Hum Genet zHplus, generalised estimation equations (GEE) framework