Transcription
The role of NEt4 in orienting and locking together [M2(lig)3]2- (6,3) sheets(H2lig chloranilic or fluoranilic acid) to generate spacious channelsperpendicular to the sheetsSupporting InformationChristopher J. Kingsbury,1 Brendan F. Abrahams,1 Deanna M. D’Alessandro,2 Timothy A. Hudson,1Ryuichi Murase,1,2 Richard Robson1 and Keith F. White11. School of Chemistry, University of Melbourne, Victoria 3010, Australia2. School of Chemistry, University of Sydney, NSW 2006, Australia
SynthesesChloranilic acid (H2can) was of commercial grade, and was used without further purification.Fluoranilic acid (H2fan) was prepared by the procedure of ene (H4can) was prepared from chloranilic acid (2.00 g,9.57 mmol) by reduction with Sn(s,granulated)(4.0g, 34 mmol) in HCl(conc.aq)(50mL). Themixture was refluxed until all colour was lost from the solution. Residual Sn was filtered, andthe solution cooled to 4 C. The solution was filtered under positive pressure of nitrogen toyield H4can as colourless needles which were sensitive to air exposure. These crystals werewashed with cold water and stored under N2. Yield 95%.1,4-difluoro-2,3,5,6-tetrahydroxybenzene was prepared by an identical procedure to thatoutlined above, with 2.00 g fluoranilic acid used in place of the chloranilic acid. Yield 90%Synthesis of (Et4N)2[Zn2(can)3] (1) An acetone solution of the reduced form of chloranilicacid, H4can (0.315 g, 1.50 mmol, 70 mL) was layered above an aqueous solution (30 mL) ofZn(NO3)2·6H2O (0.297 g, 1.00 mmol) and Et4NBr (0.63 g, 3 mmol), and the flask waspartially covered. Crystals formed at the interface between these layers as solvent evaporatedand the ligand was oxidised by atmospheric oxygen. Hexagonal crystals were observedwithin 2 days. After one week, the precipitated solid was filtered and washed with water andacetone, and pump dried in the atmosphere. Single crystals of this material suitable for singlecrystal X-ray diffraction were transferred directly from the mother liquor to a protective oil inorder to minimise solvent loss from the crystals. Microanalysis performed on crystals dried inthe atmosphere, calculated: C 38.9 H 4.2 N 2.7; found: C 38.9 H 4.1 N 2.9 %. Yield 49 %.Synthesis of (Et4N)2[Fe2(can)3] (2) The synthesis of this material was as described above,with FeSO4 (0.278 g, 1.00 mmol) in place of the Zn salt. Microanalysis was performed oncrystals dried in the atmosphere, calculated: C 39.8 H 4.3 N 2.7 found: C 39.8 H 4.0 N 2.8with 1.8 H2O per formula unit. Black hexagonal plate crystals, Yield 50%
Synthesis of (Et4N)2[M2(can)3] (M Mn, Mg, Co, Ni, Cu) The synthesis of this material wasas described above, the appropriate metal nitrate (1.00 mmol) was used in place of the Znsalt. Yields Mg, 45%; Co, 44%; Ni, 38%; Cu, 51%. Mg, Co, Cu as hexagonal purplecrystalline precipitate, Ni as homogeneous purple powder precipitate. These unit cells wereconfirmed by powder x-ray diffraction. (Et4N)2[M2(can)3] could not be synthesised in amethod which was pure according to PXRD. This sample is in fact contaminated with[Mn(can)(H2O)2]·H2O which has been previously described.[2]Synthesis of (Et4N)2[Zn2(fan)3] The synthesis of this material was as described above, withH4fan (0.267 g, 1.50 mmol) and Zn(NO3)2·6H2O (0.29 7g, 1.00 mmol) being employed as theacid form of the ligand and metal salt respectively. Hexagonal purple crystals were obtainedwith a yield 26%.Single Crystal X-Ray DiffractionSingle crystals were analysed on an Oxford Diffraction Supernova diffractometer at 130K((Et4N)2[Zn2(can)3]), 100 K ((Et4N)2[Fe2(can)3]) and 260 K ((Et4N)2[Zn2(fan)3]) with CuKαradiation (λ 1.54184 Å). Data collection, reduction and absorption corrections (multi-scan)were all performed with CrysAlisPro from Agilent Technologies. Structures were solvedusing SHELXT[3], and refined using the full matrix least-squares model on F2 withSHELXL[4].All framework atoms in the anionic polymer residue were able to be refined on all positionaland thermal parameters; due to disorder, the bond distances and thermal parameters in thecation were refined with loose DFIX and SIMU restraints. For (Et4N)2[Zn2(can)3], the cationdisorder models three-fold disorder of the cation about a 32 site at (2/3, 1/3, 1/2); a singlecation position is generated by symmetry ( x, x-y, 1-z). The tetraethylammonium hydrogenatoms were placed in idealised positions using HFIX 23 for methylene hydrogen atoms and
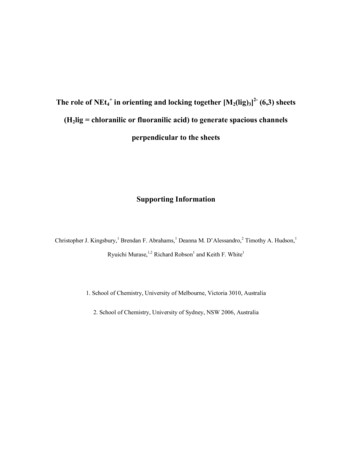
HFIX 137 or 133 for methyl hydrogen atoms. (Et4N)2[Fe2(can)3] and ((Et4N)2[Zn2(fan)3])were modelled in a similar manner.No atoms could be unambiguously assigned in the open channel. The SQUEEZE routinewithin PLATON[5] was used to treat the problems associated the highly disordered solvent.Crystal data and refinement details:(Et4N)2[Zn2(can)3]·24H2O, Mr , trigonal, P-31m, a 13.6783(9), c 10.1059(5) Å, V 1637.5(2) Å3, Z 1, µ 3.934 mm-1, T 130.0(1) K, no. of measured (and independent)reflections 3870 (1181), wR2 (all data) 0.2264, R1 [I 2σ(I)] 0.0688.(Et4N)2[Fe2(can)3]·20H2O, Mr 1444.5, trigonal, P-31m, a 13.5660(1), c 10.1172 Å, V 1612.5(3) Å3, Z 1, µ mm-1, T 100.0(1) K, no. of measured (and independent) reflections3312 (1157), wR2 (all data) 0.1872, R1 [I 2σ(I)] 0.0531.(Et4N)2[Zn2(fan)3]·24H2O, Mr 1345.8, trigonal, P-31m, a 13.639(3), c 10.126(2) Å, V 1631.3 Å3, Z 1, µ 1.837 mm-1, T 260.0(1) K, no. of measured (and independent)reflections 3428 (1070), wR2 (all data) 0.1753, R1 [I 2σ(I)] 0.0958.CIF files for (Et4N)2[Zn2(can)3]·24H2O (1524353), (Et4N)2[Fe2(can)3]·20H2O (1524354) and(Et4N)2[Zn2(fan)3]·24H2O (1524355) have been deposited with the CCDC and are availableupon request (https://www.ccdc.cam.ac.uk).Single crystal pore volume estimations were calculated using the “Voids” tool in Mercury[6]with a probe radius of 1.6 Å, which is the minimum radius of CO2.[7] A representation of thevoid locations is presented in Figure S1
Figure S1. The calculated solvent-filled void space and surface of (Et4N)2[Zn2(can)3]; voidfacing surface is shown in purple. This space is 39% of the total volume of the crystal.
Powder X-ray DiffractionPowder diffraction spectra were collected at the Powder Diffraction beamline at theAustralian Synchrotron, Clayton, using a Mythen detector, λ 0.790544 Å.[8] Slurry sampleswere prepared as slurries in acetone, and placed in a Lindemann tube, diameter 0.7 mm,which was placed in the path of the beam and rotated. Powder samples were filtered, washedwith acetone and placed in a Lindemann tube, diameter 0.7 mm, which was placed in the pathof the beam and rotated. Temperature was controlled by placing the sample in a cooledstream of N2 using an Oxford Cryostream. Two patterns were collected in each case and thesewere merged using the PDViPeR tool to account for gaps in the detector. This tool isavailable at: der-diffraction/pdviperPeaks were identified by local maxima above 10 noise threshold in a spectra which hadbeen smoothed, using a moving average filter (n 9 points), background corrected bysubtraction of local minima (n 100 points). Powder diffraction data were fitted using theprogram DICVOL 06 program to identify cell parameters.[9]
Table S1: Cell parameters for each of the isostructural (Et4N)2[M2(can)3] coordinationpolymers, calculated from synchrotron PXRD.Temp(K)300Sample MetaltypeSlurry MgacVolume(Å)(Å)(Å3)13.7266(3) 10.4104(3) Co13.7327(6) 10.3211(8) 1685160420300Powder Co13.678(1)10.252(1)166188 (M18)220(F18)400Powder Co13.646(2)10.171(2)164024 (M15)44(F15)300postheating300Powder Co13.632(9)10.101(9)162510 (M18)21 (F18)SlurryNi13.5704(4) 10.3467(7) 1650130470300SlurryCu13.6767(6) 10.3249(7) 1672160420300SlurryZn13.7478(3) 10.3819(5) 169914040010.409(3)1698
Gas SorptionGeneral ProceduresUptake was measured by differential pressure using a Sievert-type BELsorp-HP automaticgas sorption apparatus (BEL Japan Inc.). Ultra-high purity CO2 gas was purchased fromBOC.Corrections for non-ideal gas behaviour at high pressures of each gas at each measurementand reference temperature were made. Source data were obtained from the NIST fluidproperties website.[10]During measurements, sample compartment temperatures ranging from 258 – 298 K werecontrolled by a Julabo F25-ME chiller/heater that recirculated fluid at /- 0.1 C through acapped, jacketed stainless steel flask kept within a polystyrene foam box. A calibratedexternal Pt100 temperature probe monitored the flask temperature. Prior to gas sorptionmeasurements, samples were kept at the measurement temperature for a minimum of 1 hrafter the desired temperature had been achieved to allow full thermal equilibrium to beattained before data collection began.(Et4N)2[Zn2(can)3]The compound was washed with water and acetone, and dried under dynamic vacuum at140 C for two hours. The mass of the evacuated sample was 0.2673 g. Carbon dioxide uptakeisotherms were measured at 298 K, 273 K and 258 K, see Figure 4.1. Isotherms measured at258 K and 273 K were both reversible, showing three steps on uptake and two steps ondesorption. At the highest pressure measured 0.38 g of CO2 is sorbed per gram of evacuatedresidue. As is apparent in Figure 4.1, a hysteresis loop was observed for each desorptionisotherm. The 298 K isotherm shows two steps.(Et4N)2[Zn2(fan)3]
The sample was treated as above, with 0.178 g of sample after evacuation. CO2 uptakeisotherms were again reversible, showing saturation of the polymer at a lower pressure whencompared to the chloranilate sample. Again, a three-step isotherm is observed. A higheruptake was observed both in gram/gram and in mol/mol terms.The sorption behaviour of these materials with gases other than CO2 and a comprehensiveinterpretation of these results will be presented in future work.
Figure S2. CO2 isotherms at three temperatures for a) (Et4N)2[Zn2(can)3] and b)(Et4N)2[Zn2(can)3]. In each case, the filled shapes represent uptake isotherms, and the emptyshapes represent desorption isotherms. 298K isotherms are represented by green circles, the273K isotherms by blue triangles, and the 258K isotherms by red squares.
Bond Valence Sum CalculationsCalculations were performed as described by, and using literature parameters,[11] where Sij isthe valence sum, and Rij is the observed bond distance. Fe2 numbers were used for[Fe(can)(H2O)2][12] and Fe3 numbers were used for (Et4N)2[Fe2(can)3] (this work),(NMe2H2)2[Fe2(can)3][13] and(Bu4N)2[Fe2(dhbq)3][14].Althoughbonddistances arecommonly given to 3 decimal places, accuracy of the bond valence sum method wouldappear to be limited to two significant figures in this case, in line with Mossbauer resultsobtained for the above samples. exp Table S2. R0 and B values for Fe2 and Fe3 R0BFe2 1.6580.447Fe3 1.7660.360Table S3. Oxidation state data for Fe in various complexesCompoundBond H2O)2](2.158)2(2.122)2(2.194)2 )3](2.018)63.0Solid State Vis-NIR SpectroscopyDiffuse reflectance spectra were collected on a CARY 5000 UV-Vis-NIR spectrophotometerwith a Harrick Omni Diff Probe attachment using Varian WinUV software V3.0. The data
were recorded from 5000 to 25000 cm-1 with a scan rate of 6000 cm-1/min. Samples weresupported on high density filter paper which was also used to provide the backgroundreference. Spectra are reported as the Kubelka-Munk transform, where F(R) (1-R)2/2R (Ris the diffuse reflectance of the sample as compared to the background reference).Deconvolution of the diffuse reflectance spectrum for (NEt4)2[Fe2(can)3] was performedusing the curve-fitting subroutine implemented within the GRAMS32 commercial softwarepackage. The following procedure was employed for the analysis of spectral data. Thepositions of the underlying components were estimated by examining the first- and secondorder derivatives of the bands as a guide to the energies of the major components. Theenergies of the major components were subsequently fixed, and the spectral deconvolutionprocedure performed to obtain the parameters for the band intensities and bandwidths. Thefixed parameters were successively removed as the fit was iteratively refined. Deconvolutionwas performed with the minimum number of components required to obtain convergence ofthe fitting procedure.The band manifold was approximated by multiple Gaussian-shaped components. Based onthe reproducibility of the parameters obtained from the deconvolutions, the uncertainties inthe energies (νmax), intensities {F(R)max} and bandwidths ( ν1/2) were estimated as 10 cm-1,0.001 x 103 and 10 cm-1, respectively.
TableS4.Spectral data of the deconvoluted diffuse reflectance spectrum of(NEt4)2[Fe2(can)3]. The theoretical prediction for the bandwidth at half-height is provided forthe near-infrared band which has been tentatively ascribed to an Intervalence Charge Transfer(IVCT) aF(R)max2.440.5780.6112.702.032.45 ν1/2/cm-1262019753464771537802738 ν1/2º/cm-1 a2460 ν1/2º [2310(νmax )]1/2 at 298 K.15,16Figure S3. Diffuse reflectance spectrum of (NEt)2[Fe2(can)3] (black) with the underlyingGaussian bands obtained from deconvolution (black dotted lines) and the associated curvefit(red).
Figure S4. Tauc plot for (NEt4)2[Fe2(can)3]Figure S5. Tauc plot for (NEt4)2[Zn2(can)3]
[1]Wallenfels, K. Friedrich, K. Chem. Ber. 1960, 93, 3070–3082.[2]Kawata, S. Kitagawa, S., Kumagai, H., Ishiyama, T., Honda, K., Tobita, H., Adachi,K., Katada, M. Chem. Mater. 1998, 10, 3902–3912.[3]Sheldrick, G. M. Acta Crystallogr. Sect. A Found. Crystallogr. 2015, 71, 3–8.[4]Sheldrick, G. M. Acta Crystallogr. Sect. C Struct. Chem. 2015, 71, 3–8.[5]Spek, A. L. Acta Crystallogr. Sect. C Struct. Chem. 2015, 71, 9–18.[6]Macrae, C. F., Bruno, I. J., Chisholm, J. A., Edgington, P. R., McCabe, P., Pidcock, E.,Rodriguez-Monge, L., Taylor, R., van de Streek, J., Wood, P. A., J. Appl. Crystallogr.2008, 41, 466–470.[7]Webster, C. E., Drago, R. S., Zerner, M. C., J. Am. Chem. Soc. 1998, 120, 5509–5516.[8]Wallwork, K. S., Kennedy, B. J., Wang, D. in AIP Conf. Proc., 2007, pp. 879–882.[9]Boultif, A., Louër, D., J. Appl. Crystallogr. 2004, 37, 724–731.[10] “http://webbook.nist.gov/chemistry/fluid/,” 2016.[11] Gagné, O. C., Hawthorne, F. C. Acta Crystallogr. Sect. B Struct. Sci. Cryst. Eng.Mater. 2015, 71, 562–578.[12] Abrahams, B. F.; Lu, K. D.; Moubaraki, B.; Murray, K. S.; Robson, R. J. Chem. Soc.Dalton Trans. 2000, 1793–1797.[13] Jeon, I.-R.; Negru, B.; Van Duyne, R. P.; Harris, T. D. J. Am. Chem. Soc. 2015, 137,15699-15702.[14] Abrahams, B. F.; Hudson, T. A.; McCormick, L. J.; Robson, R. Cryst. Growth Des.2011, 11, 2717–2720.[15] Hush, N. S. Prog. Inorg. Chem. 1967, 8, 391-444.[16] Hush, N. S. Electrochim. Acta 1968, 13, 1005-1023.
The role of NEt 4 in orienting and locking together [M 2(lig) 3] 2-(6,3) sheets (H 2lig chloranilic or fluoranilic acid) to generate spacious channels perpendicular to the sheets Supporting Information Christopher J. Kingsbury, 1 Brendan F. Abrahams, Deanna M. D'Alessandro,2 Timothy A. Hudson, Ryuichi Murase,1,2 Richard Robson 1 and Keith F. White1 1. School of Chemistry, University of .