Transcription
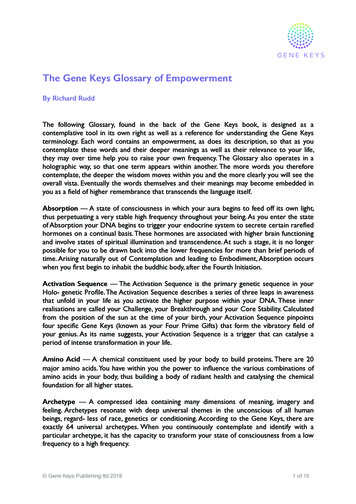
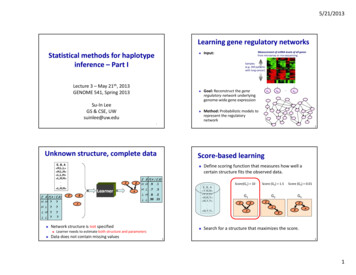
5/21/2013Learning gene regulatory networksStatistical methods for haplotypeinference – Part I Measurement of mRNA levels of all genesfrom microarray or rna‐sequencingInput:Samples(e.g. 200 patientswith lung cancer)Lecture 3 – May 21th, 2013GENOME 541, Spring 2013Su‐In LeeGS & CSE, UWsuinlee@uw.edu Goal: Reconstruct the generegulatory network underlyinggenome‐wide gene expression Method: Probabilistic models torepresent the regulatorynetworke6e1 ep12Unknown structure, complete dataE, B, A H,L,L H,L,H L,L,H L,H,H . L,H,H E B P(A E,B)H H?H L?L H?L L? ELearnerEBBA.1H L .7.3L H .8.2Score(G1) 10E, B, A Y,N,N Y,Y,Y N,N,Y N,Y,Y . N,Y,Y L L .99 .01A Learner needs to estimate both structure and parametersData does not contain missing valuesDefine scoring function that measures how well acertain structure fits the observed data.E B P(A E,B)H H .9Network structure is not specified Score‐based learning3Score (G2) 1.5Score (G3) 0.01G2G3G1EBEEAABBASearch for a structure that maximizes the score.41
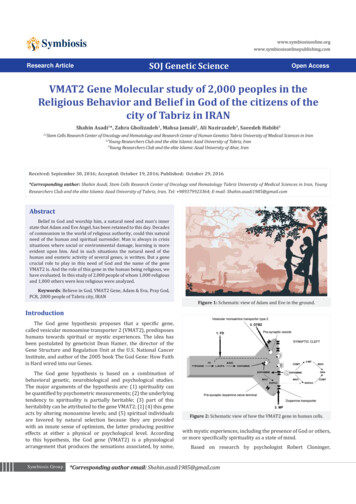
5/21/2013The Module networks conceptTree CPDsModule 1Too large search space What is the number of possible structures of n genes? 3n2Module 2X2 Computationally costly Heuristic approaches may be trapped to local maxima. Biologically motivated constraints can alleviate theproblemsModule 3-3 xRepressor X4Activator X3 falsetrueinducedModule36Linear CPDsrepressed Segal et al. Nat Genet 03, JMLR 05Feature selection via regularizationLinear module networkTranscription factors, signal transductionproteins, mRNA processing factors, Candidate regulators (X1, ,XN)Repressor X4 Module‐based approachOnly the genes in the candidate regulators list can be parentsof other variables5 truetarget geneexpression X60.5 xfalserepressorexpressionX4X3X5 activatorexpression/2Activator X3 Module 3genes X1regulationprogramChallenges Assume linear Gaussian CPD MLE: solve maximizew ‐ (Σwixi ‐ Y)2Expression levels of genes that have regulatory rolesM22M1KEM1MKT1MSK1ECM18UTH1DHH1ASG7Regulatory networkMEC3GPA1x1MFA1TEC1“Regulatory Program” Candidate regulators (features)Yeast: 350 genesMouse: 700 genesP(Y x:w) N(Σwixi , ε2)PHO4SAS5SPL2GIT1Problem: This objective learns too many regulatorsVTC37Lee et al., PLoS Genet 2009w2YPHO84PHM6PHO2x2 872
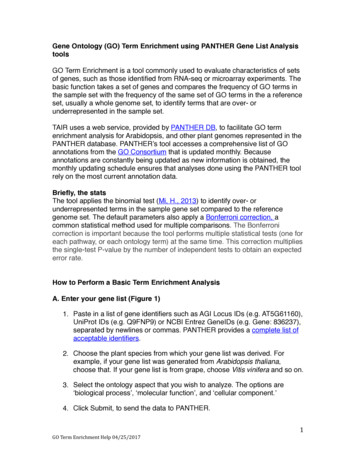
5/21/2013Linear module networkL1 regularization “Select” a subset of regulators Combinatorial search?Effective feature selection algorithm: L1 regularization (LASSO) -3 xGPA1 Learn a regulatory programfor each module0.5 x MFA1Cluster genes into modules Iterative procedureM22ModuleM1[Tibshirani, J. Royal. Statist. Soc B. 1996] minimizew (Σwixi ‐ Y)2 C wi : convex optimization! Induces sparsity in the solution w (Many wi‘s set to zero)KEM1MKT1x1w1x2w2 xNwNYCandidate regulators 1Better?Yeast: 350 genesMouse: 700 genesSGS1SEC59P(Y x:w) N(Σwixi , ε2)RIM15PHO3PHO5PHO84L1 regularized optimizationPHM6minimize)2 C wi PHO2w (Σwixi - ETargetsPHO4SAS5SPL2GIT1VTC3910Lee et al., PLoS Genet 200910SummaryHaplotype inference (5/21, 5/23) Basic concepts on Bayesian networks Probabilistic models of gene regulatory networks Learning algorithms Background & motivation Parameter learning Structure learning Structure discovery Problem statement Statistical methods for haplotype inference Clark’s algorithm Expectation Maximization (EM) algorithm Evaluation Recent probabilistic approaches toreconstructing the regulatory networksToday Coalescent‐based methods and HMM Haplotype inference on sequence data Example applications11123
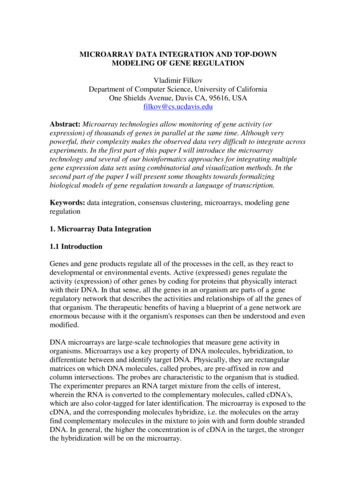
5/21/2013Genetic variation HaplotypeSingle nucleotide polymorphism (SNP) Each variant is called an allele; each allele has a frequencySNP1 SNP2 GATTTTCGTACGGAATGATCTTCGTACTGAAT P(SNP1 C) 4/8P(SNP1 T) 4/8:A combination of alleles present in a chromosomeEach haplotype has a frequency, which is the proportion ofchromosomes of that type in the populationThere are 2N possible haplotypes But in fact, far fewer are seen in human populationhaplotype123SNP1chromosome How about the relationship between alleles ofneighboring SNPs? We need to know about haplotype13History of two neighboring alleles Haplotype frequenciesP(haplotype123 TGA) 3/8P(haplotype123 CTG) 2/8P(haplotype123 CTA) 2/8P(haplotype123 TTG) 1/814chromosomeHistory of two neighboring allelesAlleles that exist today arose through ancientmutation events ASNP2 GATTTTCGTACGGAATGATCTTCGTACTGAAT One allele arose first, and then the other Before mutationBefore mutationAGCGAfter mutationAfter mutationACMutation15AGCGCCMutationHaplotype: combination of alleles present in a chromosome164
5/21/2013Recombination can create more haplotypes AGCCAGGCGCCCCWith recombinationRecombination (2n 1 recombination events)ACCG Recombination rate (r) between neighboring alleles in the populationr is different for different regions in genomeCGCCAC18 haplotype123SNP1Haplotypes can be generated through laboratory‐based experimental methods Non‐random association of alleles at two or more loci, not necessarily on the samechromosome. SNP2 GATTTTCGTACGGAATGATCTTCGTACTGAATchromosomeGHow can we measure haplotypes ?Linkage disequilibrium (LD) ARecombinant haplotype17What determines haplotype frequencies? ANo recombination (or 2n recombination events)Haplotype Without recombination Haplotype frequenciesP(haplotype123 TGA) 3/8P(haplotype123 CTG) 2/8P(haplotype123 CTA) 2/8P(haplotype123 TTG) 1/8 Computational approaches 19X‐chromosome in malesSperm typingHybrid cell linesOther molecular techniquesInput: Genotype data from individuals in a populationOutput: Haplotypes of each individual in the population205
5/21/2013Haplotype inference problem MotivationSequence and SNP array data generally take the form ofunphased genotypes Enormous amounts of genotype data are beinggeneratedMarkersTTATTTCG GG AT GG CGACATCTCG GG TT GG CGTCCC GG TTCGTC GG GC Inexpensive genome‐wide SNP microarrays Whole‐genome and whole‐exome sequencing tools Determination of haplotype phase is increasinglyimportantCCCCA GG AAA GG Characterizing the relationship between geneticvariation and disease susceptibility Imputing low frequency variantsCG GG AATTT GG TATCTCC GG A GGT21Why useful in GWAS? ExampleIn a typical short chromosome segment, there are only a fewdistinct haplotypesCarefully selected markers can determine status of othersWe can test for association of untyped SNPsS1 S2 S3 S4 S5 T TT30%Haplotype 2TTTTTTTT20%Haplotype 3Haplotype 4Haplotype 5Different alleles of each SNP Holm et al. Nat Genet (2011) Used the inferred haplotypes for accurate imputation of aputative rare causal variant in other individuals, to obtain astronger association signalSNHaplotype 1TTTT22T20%20%10%Marker (Tag SNP)23246
5/21/2013Example Sick sinus syndrome (SSS) Outline Background & motivationCharacterized by slow heart rate, sinus arrest and/or failure toincrease heart rate with exerciseGenome‐wide association scan of 7.2M SNPs with 792 SSScases and 37,592 controls Problem statement Statistical methods for haplotype inference Clark’s algorithm Expectation Maximization (EM) algorithmToday Coalescent‐based methods and HMM The association analysis yielded association with severalcorrelated SNPs in and near MYH6‐MYH7 (never beforeassociated with SSS)25Typical genotype data 26 Family information can help determine phase at manymarkers Can you propose examples? Genotype: {AT} {AA} {CG}Chromosome origin for each allele is unknownObservation Example applicationsUse information on relatives?Two alleles for each individual for each marker Haplotype inference on sequence dataCTGG marker1C marker2A marker3{CG} {TC} {GA}Multiple haplotype pairs can fit observed genotypePossible statesCTGGCA CTG/GCACCGGTACCGTCTGCAG CCA/GTGAG Maternal genotype: {TA} {AA} {CC} TAC/AAC Paternal genotype: {TT} {AA} {CG} TAC/TAG Then the haplotype is AAC/TAGCCG/GTACTA/GCG27287
5/21/2013Example – inferring haplotypes Still, many ambiguities might not be resolved What if there are no relatives? Problem more serious with larger numbers of markersRely on linkage disequilibrium (LD) LD: non‐random association of variants at different sites inthe genomeGenotype: {AT} {AA} {CG} Maternal genotype: {AT} {AA} {CG} Paternal genotype: {AT} {AA} {CG} Cannot determine unique haplotype Assume that population consists of small number ofdistinct haplotypesProblem Determine haplotypes without parental genotypes29Statistical methods for haplotypesinferenceHaplotype reconstruction Also called, phasing, haplotype inference or haplotyping Data Genotype on N markers from M individualsGoals30Individual iC G marker1TG Let’s focus on the methods that are most widely usedor historically important Browning and Browning, Nat Rev Genet. 2011C marker2A marker3 Frequency estimation of all possible haplotypes Haplotype reconstruction for individuals How many out of all possible haplotypes are plausible in apopulation?31328
5/21/2013OutlineClark’s haplotyping algorithm Background & motivation Clark (1990) Mol Biol Evol 7:111‐122 One of the first published haplotyping algorithms Problem statement Statistical methods for haplotype inference Clark’s algorithm Expectation Maximization (EM) algorithm Computationally efficientVery fast and widely used in 1990’sMore accurate methods are now available Coalescent‐based methods and HMM Haplotype inference on sequence data Example applications3433Clark’s haplotyping algorithm Unambiguous vs. ambiguousFind unambiguous individuals What kinds of genotypes will these have? Unambiguous individuals Haplotypes for 2 SNPs (alleles: A/a, B/b)Initialize a list of known haplotypes Homozygous at every locus (e.g. {TT} {AA} {CC})Haplotypes: TACHeterozygous at just one locus (e.g. {TT} {AA} {CG})Haplotypes: TAC or TAG35369
5/21/2013Clark’s haplotyping algorithm Parsimonious phasing ‐ exampleFind unambiguous individuals Initialize a list of known haplotypesNotation (more compact representation) Resolve ambiguous individuals If possible, use two haplotypes from the listOtherwise, use one known haplotype and augment list0/1: homozygous at each locus (00,11)h: heterozygous at each locus 00010110If unphased individuals remain Assign phase randomly to one individualAugment haplotype list and continue from previous step37OutlineParsimony algorithm Background & motivationPros 38Very fastCan deal with very long sequences Problem statement Statistical methods for haplotype inference Clark’s algorithmCons No homozygotes or single SNP heterozygotes in the dataSome haplotypes may remain unresolvedOutcome depends on order in which lists are transversedNaïve, not very accurate (no modeling) Expectation Maximization (EM) algorithm Coalescent‐based methods and HMM Haplotype inference on sequence data Example applications394010
5/21/2013Assume that we know haplotypefrequenciesThe EM haplotyping algorithm Excoffier and Slatkin Mol Biol Evol (1995); Qin et al. Am J Hum Genet(2002); Excoffier and Lischer Molecular ecology resources (2010)Why EM for haplotyping? For example, ifPAB 0.3Pab 0.3PAb 0.3PaB 0.1EM is a method for MLE with hidden variables.What are the hidden variables, parameters? Hidden variables: haplotype state of each individualParameters: haplotype frequencies Probability of first outcome: Individual nHaplotype status (hidden variable)z 0z 1Haplotype frequencies(parameters)pAb, paB, pAB, pab 41 2PAbPaB 0.06Probability of second outcome: 2PABPab 0.18Assume that we know the haplotypestate of each individualConditional probabilities are For example, ifPAB 0.3Pab 0.3PAb 0.3PaB 0.1Computing haplotype frequencies is straightforwardIndividual 1Individual 2 Conditional probability of first outcome: 422PAbPaB / (2PAbPaB 2PABPab) 0.25Individual 3pAB ?Pab ?pAb ?paB ?Conditional probability of second outcome: 2PABPab / (2PAbPaB 2PABPab) 0.75Individual 4434411
5/21/2013EM as Chicken vs EggEM as Chicken vs Egg If we know haplotype frequencies p’s (parameters), wecan estimate the haplotype status of individuals z’s(hidden variables) If we know haplotype frequencies p’s (parameters), wecan estimate the haplotype states of individuals z’s(hidden variables) If we know the haplotype state of each individual z’s(hidden variables), we can estimate the haplotypefrequencies p’s (parameters) If we know the haplotype state of individuals z’s (hiddenvariables), we can estimate the haplotype frequencies p’s(parameters) BUT we know neither; iterateIndividual nHaplotype status (hidden variable)z 0z 1 Haplotype frequencies(parameters)pAb, paB, pAB, pab45Phasing By EM Expectation‐step: Estimate z’s, given haplotype frequencies p’sMaximization‐step: Estimate p’s, given the haplotype states ofindividuals z’sOverall, a clever “hill‐climbing” strategy46EM algorithm for haplotypingEM: Method for maximum‐likelihood parameter inference withhidden variables 1. “Guesstimate” haplotype frequencies 2. Use current frequency estimates to replaceambiguous genotypes with fractional counts of phasedgenotypes 3. Estimate frequency of each haplotype by counting 4. Repeat steps 2 and 3 until frequencies are stableInferring haplotype stateof each individualEParametersHidden variables(haplotype frequenciesfrequencies)p’s)(haplotype states of individuals z’s)MaximizeGuess LikelihoodFind expected valuesMEstimating haplotypefrequencies474812
5/21/2013Phasing by 00110001110010¼10011111111011111011¼Phasing by 121/121/12¼¼¼49Phasing by 00110001110010¼10011111111011111011¼¼¼Phasing by 0671/12.0671/12.10.60.4Expectation5213
5/21/2013Phasing by l cost (for 1/6001/6 Consider sets of m unphased genotypes Markers 1.mFor example, if m 10If markers are bi‐allelic 2m possible haplotypes2m‐1 (2m 1) possible haplotype pairs3m distinct observed genotypes2n‐1 reconstructions for n heterozygous loci 1024 524,800 59,049 51210¼53EM algorithm Outline Background & motivationPros More accurate than Clark’s methodFully or partially phased individuals contribute most of theinformation Problem statement Statistical methods for haplotype inferenceCons Estimate depends on starting point: need to run multiple timeson different starting pointsImplementation may become computationally expensive: costgrows rapidly with number of markers 54For each individual, the number of possible haplotypes isis the number of makersTypically run for short sequences with 25 SNPsNo modeling on haplotypes2m,where m Clark’s algorithm Expectation Maximization (EM) algorithm Coalescent‐based methods and HMM Haplotype inference on sequence data Example applications555614
Recombinant haplotype 18 Haplotype What determines haplotype frequencies? Recombination rate (r) between neighboring alleles in the population r is different for different regions in genome Linkage disequilibrium (LD) Non‐random association of alleles at two or more loci, not necessarily on the same