Transcription
Measuring Consumer Sensitivity to Audio Advertising:A Field Experiment on Pandora Internet RadioJason HuangDavid H. ReileyNickolai M. Riabov April 21, 2018AbstractA randomized experiment with almost 35 million Pandora listeners enables us to measure the sensitivity of consumers to advertising, an important topic of study in the era of ad-supported digital contentprovision. The experiment randomized listeners into nine treatment groups, each of which received adifferent level of audio advertising interrupting their music listening, with the highest treatment groupreceiving more than twice as many ads as the lowest treatment group. By keeping consistent treatmentassignment for 21 months, we are able to measure long-run demand effects, with three times as muchad-load sensitivity as we would have obtained if we had run a month-long experiment. We estimatea demand curve that is strikingly linear, with the number of hours listened decreasing linearly in thenumber of ads per hour (also known as the price of ad-supported listening). We also show the negativeimpact on the number of days listened and on the probability of listening at all in the final month. Using an experimental design that separately varies the number of commercial interruptions per hour andthe number of ads per commercial interruption, we find that neither makes much difference to listenersbeyond their impact on the total number of ads per hour. Lastly, we find that increased ad load causesa significant increase in the number of paid ad-free subscriptions to Pandora, particularly among olderlisteners.JEL codes: C93, D12, L82 Huang: Stanford University, Uber , jason.yoshi.huang@gmail.com. Reiley: Pandora Media Inc., and Universityof California at Berkeley, david@davidreiley.com. Riabov: Brown University, Netflix, Inc., nriabov@netflix.com.This work was completed while Huang and Riabov were completing internships at Pandora. We wish to recognizeChris Irwin and Jack Krawczyk for their leadership and vision in getting this experiment implemented. We are gratefulto Pandora for allowing us to present these results to the scientific community; our agreement with management is topresent our scientific results without discussing policy implications for the company. We thank Neil Buckman, AlexaMaturana-Lowe, Isaac Hill, Ashley Bischof, Carson Forter, and Puya Vahabi for considerable help in producing andorganizing the data. We also thank Michael Hochster, David Hardtke, Oliver Bembom, Adam McCloskey, AndrewAsman, Sam Lendle, Hongkai Zhang, Zhen Zhu, Garrett Johnson, Randall Lewis, Jura Liaukonyte, and seminarparticipants at Brown University, UC Berkeley, Central European Institute, and University of Tennessee for helpfulcomments.
1IntroductionIn the Internet era, two-sided markets have taken on considerable importance with the offerings of companiesas diverse as eBay, Match.com and Uber. Free, advertising-supported content is a particularly large andinteresting class of two-sided markets (Rysman (2009)), including websites as diverse as Yahoo, Google,Facebook, YouTube, CNN.com, and a variety of other online news and entertainment sites. Platformsproducing ad-supported content, like other two-sided markets, involve some amount of tradeoff betweenthe goals of advertisers on one side and consumers on the other. In particular, consumers usually find itdistracting or annoying to have their content consumption interrupted by advertising, but this is the pricethey pay for the consumption of their free content. In this paper, by varying the number of ads in a long-termrandomized experiment, we measure the demand curve for free ad-supported music listening on Pandora,the world’s largest Internet radio service.1 To our knowledge, this is the first study to measure the extentto which customers are willing to reduce their consumption of a digital good as the amount of advertising(aka the price) is increased.Pandora launched its Internet radio service in 2005, and as of the time of this study, it operates in theUnited States, Australia, and New Zealand. The service began with the Music Genome Project, whichclassifies each song on hundreds of musicological attributes in order to assess similarity between songs.A listener can specify a song, artist, album, or genre that she likes, and the Pandora service uses thatinformation to create a station recommending similar music for that listener. The listener can furtherpersonalize her station by clicking thumbs-up or thumbs-down feedback on each song. Pandora algorithmsuse this thumb data, with over 50 billion thumbs recorded to date, to supplement the Music Genome,recommending music that has been liked by listeners with similar tastes. A team of scientists at Pandorahas for years been developing and improving the recommendation algorithms. More recently, Pandora hasalso started hiring scientists to improve the advertising side of the business, and this paper is an example ofthe work of the ad science team.Like many other online content services, Pandora earns its income primarily through advertising, whichat first was digital display advertising displayed to listeners only when they looked at the Pandora website.In 2008, Pandora developed a smartphone app to deliver music on mobile devices. Since smartphones havevery little screen space on which to display graphical ads, and since listeners typically spend most of theirlistening time not looking at the website or the mobile app, in December 2008 Pandora introduced audioads. Audio ads command attention by interrupting the music, just as they do in traditional broadcast radio,though the digital world offers much more scope for the targeting of ads based on listener characteristics.When an audio ad runs on Pandora, if the listener is looking at the Pandora app or website during the ad,she will see a companion display ad tile on the screen. If she looks at the screen after the audio ad hasended, she will see a follow-on display ad for the most recent audio ad. Both of these companion graphicsare clickable, just like standard online display advertisements. While Pandora separately sells both displayand video advertising ad campaigns for both web and mobile devices, today audio advertising represents themajority of Pandora’s advertising revenue.As of the time of the study, Pandora had approximately 80 million monthly active listeners, each listeningan average of about 20 hours per month. More than 80% of listening now takes place on mobile devices.The remainder takes place on the website as well as on other consumer-electronics devices such as Roku,AppleTV, Sonos speakers, and automobile stereo systems. Given engineering resource constraints, we choseto focus on mobile listening in our experiment. In other words, while our experiment generates variationin the quantity of advertising delivered to each listener, these deliberate differences take place only in the80% of listening that takes place on mobile devices. Listeners in different treatment groups receive the sameadvertising treatment when listening on the website or on other consumer-electronics devices; their treatmentdiffers only for the listening that takes place via iOS and Android apps.This ambitious experiment generates a very precise estimate of Pandora listeners’ sensitivity to advertising. By varying the number of ads each listener receives, we measure the long-run effects of advertisingintensity on a variety of outcomes, most notably the total quantity of hours listened by Pandora users.Because we experiment with nine different levels of advertising, we are able to measure a continuous curve1 Because Pandora also pays royalties to musicians and promotes their music to listeners, we might actually consider itsplatform to be a three-sided market. But in this paper, we focus mainly on listeners and advertisers rather than the musicindustry.1
that traces out the relationship between the ad load and the number of listening hours, and show that it isstrikingly linear over a range that involves doubling the total quantity of audio advertising heard by listeners.Using observational data relies on untestable assumption of unconfoundedness, which states that the setof observable variables properly controls for all confounding factors. Although we can always condition onobservable variables, an endogenous treatment may well be correlated with unobservable variables, causingbias. By contrast, experiments allow us to avoid having to make such untestable assumptions in order toidentify the causal estimates of ad load; the randomized experiment guarantees that the effects we measureare true causal effects rather than spurious correlation.2Nevertheless, field-experimental measurements of how customers respond to prices are still extremelyrare. Amazon experimented with randomized prices to customers in 2000-2001, but the experiment wasnot well-received by the general public. Customers compared notes online and felt it was unfair that theywere receiving different prices from each other. CEO Jeff Bezos publicly stated that it was a “mistakebecause it created uncertainty for customers rather than simplifying their lives.” (PSBJ (2000)) The companyannounced that if it ever again tested differential pricing, it would subsequently give all buyers the lowestprice tested. We are not aware of any reports of Amazon ever resuming this type of randomized pricingacross individuals, but we have (as individual consumers) noticed seemingly random changes in Amazonprices over time. Perhaps due in part to this bad public-relations outcome of the Amazon experiment, mostfirms have been reluctant to run price experiments to estimate demand. Pandora’s decision to run thisexperiment is an important exception to this rule.Field experiments in development economics have often performed binary pricing tests, usually findinglarge effects of changing the price from zero to some positive (but subsidized) price. Examples includeMiguel et al. (2002) on free versus 0.30 deworming medicine, Cohen & Dupas (2007) on free versus 0.60mosquito nets, and Ashraf et al. (2010) on free versus positive prices for water treatment. Berry et al. (2015)advocate the use of the Becker-DeGroot-Marschak (BDM) mechanism to estimate demand by eliciting eachindividual’s willingness to pay, though in their water-filtration application they find some tendency for BDMto underestimate demand relative to an experiment that varies posted prices. Lusk et al. (2010) reviewsthe use of BDM and other lab-in-the-field auction mechanisms to estimate demand for food products in theUnited States; Lusk notes privately to us via email that his repeated attempts to run pricing experimentsin grocery stores have generally failed due to implementation errors by grocery personnel. A rare publishedexample of a posted-price experiment in the developed world is that of Gneezy et al. (2012), who variedthe price (from 5 to 15) of a souvenir photo offered to thousands of tourists at the conclusion of a boatsightseeing tour.To the best of our knowledge our study is the first field experiment to measure the extent to whichconsumers avoid ads by choosing to consume less media content as the ad load increases. Perhaps mostclosely related to our work is the research of Hohnhold et al. (2015), who vary the quality and quantity ofadvertising served in Google search results, finding that increased quantity and decreased quality increasethe “ads blindness” of consumers, making them less likely in the long run to click on ads. Our exercise differsfrom theirs in that we estimate not just the effects on consumers’ interactions with ads, but the extent towhich consumers reduce their consumption of music on Pandora as a result of an increase in ad volume.Our research design has a number of advantages. First, we are able to run a field experiment, allowingus to avoid the untestable assumptions required to infer causal effects from observational data. Our onlinesetting made it possible for us to implement the randomized experiment without administrative errors orsubject noncompliance. Also, because our price is an experiential one (how many ads am I listening to?), andPandora’s audio ad volume naturally varies across individuals for a variety of institutional reasons described2 A nice example of an observational study is the recent paper of Cohen et al. (2016), who use a regression-discontinuityanalysis to estimate the demand curve for Uber based on discrete changes in “surge pricing.” Because the authors are able toobserve a continuous scarcity state variable that leads to discrete changes in price, they are able to argue that comparisonsabove and below each price-change threshold are as good as an experiment. This argument would be incorrect if consumers anddrivers were somehow gaming their behavior to act differently just above a threshold than they do just below a threshold, whichseems unlikely. A stronger concern about their study is how representative their results may be, since high surge prices in theirstudy apply mainly to those who travel late at night or during morning rush hour, and these demand elasticities might not berepresentative of all Uber riders. Finally, because they exploit variation at the level of an individual ride, they are measuring ashort-run elasticity, which might well be smaller than the long-run elasticity that would result if a treatment consumer receivedconsistently high prices and got used to Uber being relatively expensive versus other transit options. Our experiment scores wellon both representativeness and on measuring the relevant long-run demand elasticity, because we apply experimental variationin prices to all Pandora listeners over a long period of time.2
below, the risks of consumers feeling unhappy about perceiving unfair differences in treatment are lower.Second, we managed to expose listeners not just to a binary treatment, but to nine different intensities ofadvertising, with the maximum treatment approximately twice as large as the minimum treatment. Third,we conduct the experiment for 21 months, enabling us to estimate long-run effects on listening behavior.Fourth, our sample size in the millions allows us to estimate the treatment effects with considerable precision.The results add to our scientific understanding of ad-avoidance behavior by consumers, which contributes inturn to our understanding of two-sided markets for ad-supported free content.The remainder of this paper proceeds as follows. In the next section, we describe the details of theexperimental design and provide validation of the randomized treatment assignment. Next we present ourmain results on the sensitivity of listeners to advertising intensity, including outcomes of hours listened, dayslistened, and probability of listening at all. In section 4, we measure the increased demand for a substituteproduct (ad-free subscriptions) due to increased advertising load. Next we look at heterogeneous treatmenteffects, finding interesting differences between older and younger listeners. In section 6 we take advantage ofthe experimental design to look at the effect of the number of commercial interruptions. The final sectionconcludes.2Experimental DesignBetween June 2014 and April 2016, Pandora Internet Radio conducted a large-scale experiment to measurethe sensitivity of listeners to the number of audio ads they hear interrupting their music stream. Duringthis time period, we randomized 19% of listeners into one of ten different treatment groups: nine treatmentgroups each with 1% of listeners, plus a 10% control group receiving the Pandora status quo. Each treatmentgroup received different levels of audio advertising when they listened to Pandora via their mobile devices,with an individual’s treatment kept consistent for the entire period of the experiment. New listeners joiningPandora were assigned to treatment using the same randomization (a hashing function of user ID with aunique randomization seed not used in any other current or historical experiments at Pandora).We implemented a 3x3 experimental design, separately varying the number of commercial interruptionsper hour and the number of ads per commercial interruption. At the time the experiment began, thestatus quo was for listeners to receive four commercial interruptions per hour. We will often refer to eachcommercial interruption as a “pod” of ads. The status quo at the start of the experiment was for pods toalternate deterministically between one and two ads per interruption, for an average of 1.5 ads per pod. Theexperiment assigned listeners to receive either 3, 4, or 6 interruptions per hour, and to receive either 1, 1.5,or 2 ads per interruption, with each of the 9 possible combinations getting its own 1% group of listeners.We will use the following shorthand to refer to these treatments: 3x1 for three 1-ad pods per hour, 6x1.5for six pods per hour alternating between one and two ads per pod, and so on. We note that the large10% control group was redundant with the status-quo 4x1.5 treatment. By varying ad load in these twoseparate dimensions, we enable ourselves to measure whether listeners have a preference for more commercialinterruptions versus longer commercial interruptions, conditional on the platform’s desired number of adsper hour.The actual number of ads received by an individual will usually differ from the number of ads justdescribed in our experimental design. This happens for a number of institutional reasons. First, ad deliverydepends somewhat on listener behavior. For example, ads are delivered according to a given schedule, and alistener who listens to only a single song might not receive any ad at all during that listening session. Also, dueto resource constraints, Pandora chose to implement the experiment only in its mobile application (Androidand iOS), not on the Pandora website or on other pieces of client software, such as those in automobiles.Listening on mobile devices constituted approximately 80% of Pandora listening during this time period, sothe experiment does generate considerable variation in advertising exposure to individuals, but listeners wholistened only on the website from their desktop computers would receive no effective differences in treatment.The total amount of realized experimental treatment, therefore, depends on how much listening an individualdoes on different devices. In our analysis, we consider the impact on total listening across all devices, ratherthan restricting attention to listening on mobile devices, since many consumers listen via multiple devicesand we would expect listener perceptions of Pandora’s value to depend on the total amount of advertisingthey receive during all listening sessions they do.3
Second, Pandora’s ad delivery also depends on advertiser demand. Unlike in many digital advertisingmarkets, there is no well-developed auction market for online audio advertising. Instead, all audio adson Pandora are sold via forward contracts with advertisers. These contracts generally specify targetingattributes (such as “males aged 25-44 who live in San Diego and who are listening to punk-rock music”),as well as frequency caps that prevent the same listener from hearing the same advertisement more thana specified number of times per day or week. Given these delivery constraints, Pandora sometimes has noappropriate ad to play for a given listener on a given scheduled ad-delivery opportunity. At such moments,the ad opportunity will go unfilled and the listener will get to listen to more music instead of the scheduledadvertisement. The realized “fill rate” (fraction of Pandora ad-delivery opportunities that actually get filledwith an ad) can vary with listener attributes, with the time of day, and with the time of year.Thus, we observe a considerable difference between the intended ad load and the realized ad load for eachlistener, with the latter being what we expect to affect listener behavior. In our analysis, we therefore useinstrumental-variables estimation, as treatment assignment causes plenty of exogenous variation in realizedad load, amidst other potentially endogenous variation.We consider several different outcome measures in this experiment. Listeners may react to the increased“price” of additional audio advertising by reducing their listening in one of several ways. We consider totalhours listened, number of days active in a given month, and probability of listening at all to Pandora duringa given time period. Finally, we measure the impact on the probability of purchasing an ad-free subscriptionto Pandora, which represents a substitute (costing approximately 5 per month) for the ad-supported versionof the music service. For confidentiality reasons, we have normalized the listening hours and days metrics bydividing all observations by the control-group mean and multiplying by 100. We remind the reader of thenormalization with the abbreviation “norm.” in our tables of results.We next validate our randomized experiment by verifying that treatment assignment is uncorrelated withother variables of interest. In particular, we compute means of the outcome variables during the pretreatmentperiod, which we define as the month of May 2014. Table 1 displays comparisons of the outcome variablesfor the two treatment groups with the highest (6x2) and lowest (3x1) ad loads, showing that the variables arefairly similar across treatment groups. Each observation corresponds to a listener who used the ad-supportedversion of Pandora at least once during the experiment period. We next perform a χ2 test for the equalityof these means over all ten of the treatment groups (nine plus control, where control receives the sametreatment as the 4x1.5 treatment group). As can be seen in table 2, each of these tests fail to reject the nullhypothesis of equality at the 5% level, giving us a successful randomization check.Table 1: Pretreatment Period Summary Statistics (Means and Standard Errors)Total Hours (norm.)Days Active (norm.)Audio Ads (norm.)Audio Pods (norm.)Ad Capacity (norm.)Percent Paid UsersPercent MaleSample 0.012)18,342,916Lowest Ad 833,826Highest Ad ,909Table 3 shows the means of the amount of treatment received between June 2014 and March 20163 for the3 Technically,the experiment ended on April 7, 2016. For expositional convenience, our outcome period will be the ”final4
Mean Ads Per Hour by Treatment Groupas Percentage of Control1501301109070Aug 14Nov 14Feb 15May 15Aug 15Nov 15Feb 16May 16TimeLowest Ad LoadHighest Ad LoadFigure 1: Realized Mean Ad Load per Hour by Treatment GroupMean Ad Load by City with 95% CI, Highest Ad Load Group3.84.04.24.4PHILADELPHIA DETROIT NEW YORK MACON SAVANNAHBINGHAMTON Figure 2: Mean Final Month Ad Load by Place of Residence, Highest Intended Treatment Group5
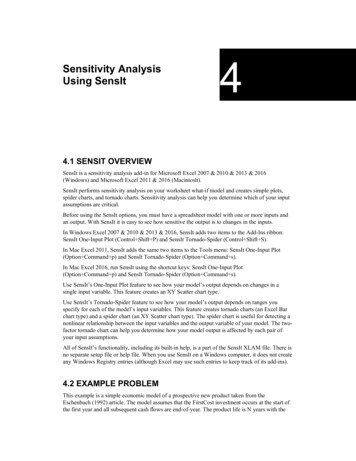
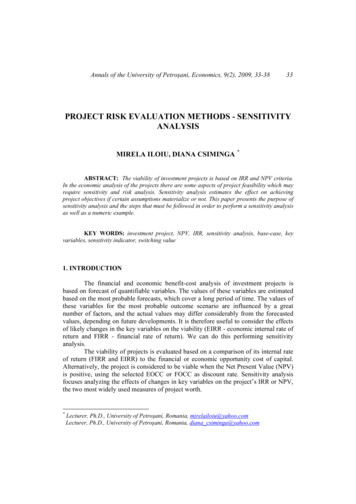
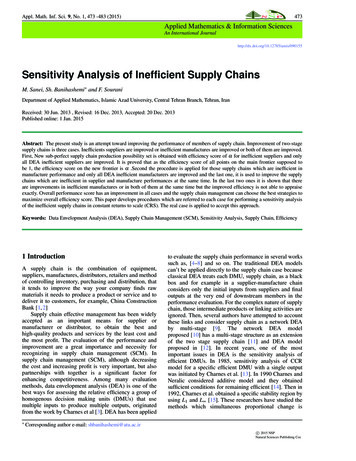
Table 2: χ2 Test for Equality of Means Across All Treatment Groups, Pretreatment PeriodTotal HoursDays ActiveAudio AdsAd CapacityPaid UsersMaleTest Stat.4.3353.5627.3724.7349.8097.362P Value0.8880.9380.5980.8570.3660.599Table 3: Treatment Period Summary StatisticsAudio Ads per HourAudio Ad Pods per HourAd Capacity per HourPercent with Non-empty PodsAudio Ads per PodSample 408(0.006)1.228(0.000)18,342,916Lowest Ad 19)1.054(0.000)1,833,826Highest Ad 18)1.428(0.002)1,831,909highest and lowest treatment groups (6x2 and 3x1) compared with the control (4x1.5). We see that treatmentassignment does, as intended, manipulate the realized ad load. The highest treatment group receives 37%more ads per pod and 33% more pods per hour than the lowest treatment group, for a total of 80% moreads per hour. For reference, the third row of the table shows the mean ad capacity per hour, or the numberof audio ads that listeners would have received if every ad opportunity were filled by an advertiser. Thesenumbers differ from the intended ad load numbers (6x2 12, 4x1.5 6, and 3x1 3) for several reasons havingto do with the details of ad serving on Pandora. For example, listening sessions of different lengths canresult in different numbers of ads per hour due to the details of the timing of ads. The most notable reasonfor differences is that the experiment manipulated advertising only for those listening via mobile apps, notfor those listening via the Pandora website.Figure 1 shows how the amount of treatment varies from one week to the next. This time series plotshows the amount of ad-load treatment received by the highest (6x2) and lowest (3x1) treatment groups,divided by the ad load of the control group. We point out two key features. First, the experiment wasdesigned to ramp up slowly over a period of six weeks, visible at the left side of the graph, in case listenerswould find a sudden increase in ads to be jarring. Second, the amount of treatment-control difference variessomewhat over time, since realized ad load differs from intended ad load in a way that depends on advertiserdemand. In particular, we can see that the treatment effect is a bit higher in December than it is in January,because advertiser demand is very high in December and relatively low in January.While we will use the experiment to identify differences in listening behavior across treatment groups, itis interesting to note that there also exists considerable variation in ad load within each treatment group.Advertisers’ demand varies, for example, by different ages, genders, and cities of residence (DMAs). Figure 2illustrates the variation in realized ad load across six randomly selected cities, within the highest treatmentgroup. The overall distribution of realized treatment within this treatment group can be seen in Figure 3.month” of the experiment, defined as March 8 to April 7, 2016.6
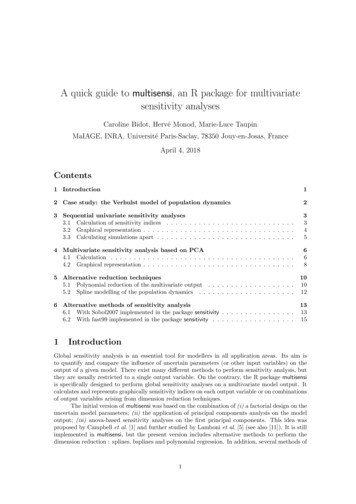
0.100.000.05Density0.15Distribution of Realized Ad Load,Highest Treatment Group051015Ads per HourFigure 3: Distribution of Ad Load, Highest Intended Treatment Group3Measuring the Sensitivity of Listeners to AdvertisingMean Listened Hours by Treatment Groupas Percentage of Control10210098Aug 14Nov 14Feb 15May 15Aug 15Nov 15Feb 16May 16TimeLowest Ad LoadHighest Ad LoadFigure 4: Mean Total Hours Listened by Treatment GroupFigure 4 plots the number of hours listened each week in the highest and lowest ad-load treatments,each relative to the control group. Total hours listened diverges relatively gradually from that of the controlgroup, with the highest ad-load treatment group gradually listening fewer and fewer hours relative to control,while the lowest ad-load group gradually listens more and more hours. Figure 5 shows that this gradualchange also holds true for the number of listeners actively listening to Pandora each week. By the end ofthe experiment, the highest treatment group has 2% fewer active listeners than control, while the lowesttreatment group has 1% more listeners than control. Most importantly, we see in both graphs of the weeklytreatment effect how important it is that we ran the experiment for over a year. In both graphs, we see thatthe treatment effect grows over the course of an entire year, stabilizing for the most part only after 12-15months of treatment. Table 4 shows that the treatment assignment impacted the total hours and active days7
Number of Unique Listeners by Treatment Groupas Percentage of Control1011009998Aug 14Nov 14Feb 15May 15Aug 15Nov 15Feb 16May 16Aug 16TimeLowest Ad LoadHighest Ad LoadFigure 5: Mean Weekly Unique Listeners by Treatment GroupTable 4: Final Month Summary StatisticsTotal Hours (norm.)Days Active (norm.)Sample owest Ad Load101.740(0.243)101.683(0.134)1,833,826Highest Ad Load97.169(0.225)97.403(0.131)1,831,909in a fashion consistent with theory (i.e. users who were exposed to a higher ad load listened for fewer hoursrelative to the control, while those who were exposed to a lower ad load listened to more hours).The experimental design allows us to measure the changes in listener behavior due to changes in thenumber of audio ads they receive. Figure 6 shows the estimated demand curve for Pandora listening in thefinal month of the experiment, as a function of the number of ads per hour received during the previous 21months of treatment. Each of the nine treatment groups and the control group are plotted as a single point.We can see that this demand curve is strikingly linear, much like the simplified demand curves plotted inprinciples-of-economics textbooks. Since none of the points deviates very much from the best-fit line, weinfer that the number of pods per hour and the number of ads per pod have only second-order impactson listening behavior, with ads per hour being the first-order explanatory variable. We will return to thisquestion below with an explicit model.The best-fit line displayed in Figure 6 is the result of two-stage-least-squares (2SLS) estimation. We use2SLS instead of ordinary least squares (OLS) because we don’t have complete control over treatment, forthe variety of reasons discussed above, so that the realized ad load (number of ads per hour, aka “price”)differs from what the experiment set as the intended maximum ad load. Here, the first stage regresses therealized ad load on nine treatment dummy variables, which simply estimates the mean realized ad load ineach treatment group, as illustrated by the horizontal coordinates in Figure 6. The main equation (thesecond stage) regresses the outcome variable (hours listened in the final month) on the realized ad load,where the first stage causes us to use t
A Field Experiment on Pandora Internet Radio Jason Huang David H. Reiley Nickolai M. Riabov April 21, 2018 Abstract A randomized experiment with almost 35 million Pandora listeners enables us to measure the sensi-tivity of consumers to advertising, an important topic of study in the era of ad-supported digital content provision.