Transcription
Downloaded By: [University of Colorado, Boulder campus] At: 12:23 18 June 2008Aerosol Science and Technology, 42:465–471, 2008c American Association for Aerosol ResearchCopyright ISSN: 0278-6826 print / 1521-7388 onlineDOI: 10.1080/02786820802178514Design and Operation of a Pressure-Controlled Inlet forAirborne Sampling with an Aerodynamic Aerosol LensRoya Bahreini,1,2 Edward J. Dunlea,1 Brendan M. Matthew,1,2,3 Craig Simons,1,2Kenneth S. Docherty,1 Peter F. DeCarlo,1,4 Jose L. Jimenez,1,5 Charles A. Brock,2and Ann M. Middlebrook21Cooperative Institute for Research in Environmental Sciences, University of Colorado, Boulder,Colorado, USA2Earth System Research Laboratory, National Oceanic and Atmospheric Administration, Boulder,Colorado, USA3Now at Eastman Kodak Company, Windsor, Colorado, USA4Department of Atmospheric and Oceanic Sciences, University of Colorado, Boulder, Colorado, USA5Department of Chemistry and Biochemistry, University of Colorado, Boulder, Colorado, USATwo pressure-controlled inlets (PCI) have been designed andintegrated into the Aerodyne Aerosol Mass Spectrometer (AMS)inlet system containing an aerodynamic aerosol lens system for usein airborne measurements. Laboratory experiments show that sizecalibration and mass flow rate into the AMS are not affected bychanges in upstream pressure (P0 ) of the PCI as long as the pressurewithin the PCI chamber (PPCI ) is controlled to values lower thanP0 . Numerous experiments were conducted at different PPCI , P0 ,and AMS lens pressures (PLens ) to determine particle transmissionefficiency into the AMS. Based on the results, optimum operatingconditions were selected which allow for constant pressure sampling with close to 100% transmission efficiency of particles in thesize range of 100–700 nm vacuum aerodynamic diameter (dva )at altitudes up to 6.5 km. Data from an airborne field study arepresented for illustration.INTRODUCTIONAerosols have gained much interest in recent years due totheir effects of deteriorating visibility, air quality, and humanhealth, as well as their direct and indirect effects on climate. Efforts to understand the different processes that lead to formationand growth of aerosols have involved ambient measurements ofReceived 25 October 2007; accepted 3 May 2008.This work was partially supported by NASA grant NNG04GA67Gand NSF/UCAR grant S05-39607. RB and PFD acknowledge a CIRESpostdoctoral visiting fellowship and an EPA STAR graduate fellowship(FP-91650801), respectively. We thank Jim Kastengren at CIRES foruseful discussions and fabrication of the second design of the PCI andthe AMS community for many useful discussions.Address correspondence to Roya Bahreini, Cooperative Institute forResearch in Environmental Sciences, University of Colorado, Boulder,CO 80309, USA. E-mail: Roya.Bahreini@noaa.govphysical and chemical properties of aerosols and their precursors. To meet this challenge, several new aerosol instrumentshave been developed that utilize aerodynamic lenses in orderto focus particles in the sampled air into a narrow beam before detection using mass spectrometry (Schreiner et al. 1998;Schreiner et al. 1999; Tobias and Ziemann 1999; Jayne et al.2000; Su et al. 2004; Zelenyuk and Imre 2005; Murphy 2007).These lenses also have the potential to be used in other particle measurement techniques such as optical particle sizing. Theoperating pressure in all such lenses is lower than atmospheric,most commonly 2 mbar (Liu et al. 1995a; Liu et al. 1995b).Many of these aerosol instruments are being used in airbornestudies in the troposphere where the ambient pressure decreasesas a function of altitude but remains much above the lens operating pressure.The Aerodyne Aerosol Mass Spectrometer (AMS) is onesuch instrument that uses a Liu-type aerodynamic lens. TheAMS provides quantitative and size-resolved information aboutnon-refractory composition of aerosols, and has been utilized in multiple ground based and airborne measurements(Jayne et al. 2000; Bahreini et al. 2003; Jimenez et al. 2003;Drewnick et al. 2005; DeCarlo et al. 2006). The standard AMSinlet system consists of a 100 µm diameter critical orifice(COdown ) upstream of the aerodynamic lens, that reduces theinlet pressure of the aerodynamic lens to 2 mbar when sampling at sea level pressure (1013 mbar), and an aerodynamic lenssystem to focus the particles into a beam (Liu et al. 1995a; Liuet al. 1995b). Particle transmission through the AMS standardinlet at sea level is 100% for sizes between 100–150 nm to400–600 nm in vacuum aerodynamic diameter (dva ), dependingon the specific lens used (Jayne et al. 2000; Liu et al. 2007).Since the pressure drop across COdown is more than a factor oftwo, the orifice operates under critical, or choked, conditions465
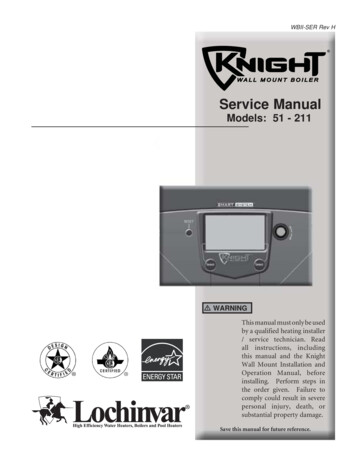
Downloaded By: [University of Colorado, Boulder campus] At: 12:23 18 June 2008466R. BAHREINI ET AL.with a constant volumetric flow rate. The nozzle at the end ofthe aerodynamic lens acts as a second critical orifice, setting thepressure in the lens as a function of the mass flow rate entering it. When the pressure upstream of the COdown changes, themass flow rate varies with air density, which leads to changesin lens pressure, and thus in particle velocity and transmissionefficiencies (Zhang et al. 2002; Bahreini et al. 2003). With laboratory calibrations of these effects, the data can be correctedin post-processing (Bahreini et al. 2003), but the differences inparticle transmission can be large, especially at the upper endof the particle size range and difficult to calibrate for. A pressure controlled inlet (PCI) that maintains a constant pressureupstream of the lens with varying sampling pressure conditionscould improve quantification of airborne measurements with anAMS.Controlling the inlet pressure for aerosol measurements is notas straightforward as for gas phase measurements due to particleinertia. Lee and co-workers (1993) developed a sampling inletthat allows particles contained in high-pressure gases to equilibrate to the ambient flow conditions at atmospheric pressurebefore being extracted with high efficiency by a sampling probe.In this article we discuss the design and airborne application oftwo PCI models, based on the design of Lee et al. (1993), withthe AMS.PCI DESIGNThere are two versions of the PCI that were designed, built,characterized in the laboratory, and used in airborne field studies. Both designs are similar in theory to the University of Minnesota pressure reducer (Lee et al. 1993), where the inlet flow atan upstream pressure of P0 expands from an orifice (COup ) intoa chamber with inner diameter Dt (Figure 1). Pressure withinthis chamber (PPCI ) is feedback-controlled by variable pumping through side ports of the chamber. In our system, a pressurecontrolling valve (MKS 640A, MA) with digital readout (MKSPR4000, MA) regulates PPCI using a pump (Pfeiffer MVP 0203AC, MA or Gast DOA-P104-AA, MI) to remove the excessFIG. 1.flow. Particle concentration in the expansion chamber becomesuniform before the sampling flow is extracted at a distance Ldownstream through a tube with inner diameter D S . As suggested by Lee et al. (1993), for minimal deposition losses on thefront side of COup , the orifice size (D O,up ) should be such that St 1, where stokes number (St) is defined asSt ρ p D 2p Cc U0[1]18µD O,upwhere ρ p is the particle density, D p is the particle diameter, Cc isthe Cunningham slip correction, U0 is the velocity upstream ofthe orifice, and µ is the dynamic fluid viscosity (Lee et al. 1993).To minimize particle depositionon the expansion chamber walls, Dt is selected so that St defined as St ρ p D 2p Cc U O18µD O,up D O,upDt 0.58[2]where U O is the velocity at COup , is less than 1 (Lee et al.1993). Distance L is selected such that it is beyond the stoppingdistance of particles. Considering ammonium nitrate particlessmaller than 600 nm (D p ), the values for St and St are,respectively, 0.02 and 0.14 for PCI-I and 0.03 and 0.16for PCI-II designs operating at 467 mbar.Main dimensions of both PCI designs are give in Table 1. PCII design was used with the Q-AMS (an AMS with a quadrupolemass spectrometer) aboard the NOAA WP-3D research aircraftfor the 2004 New England Air Quality Study—IntercontinentalTransport and Chemical Transformation (NEAQS-ITCT) fieldproject. To minimize the residence time in the PCI, a smaller,second design (PCI-II) was later built and used in 2006 witha ToF-AMS (an AMS with Time-of-Flight mass spectrometers) instruments aboard the NSF/NCAR C-130 during theMegacity Initiative: Local and Global Research Observations(MILAGRO) and the 2006 Intercontinental Chemical Transport Experiment (INTEX-B) field studies, and aboard theSchematic and main dimensions of the PCI- AMS inlet design. See text for definition of terms.
Downloaded By: [University of Colorado, Boulder campus] At: 12:23 18 June 2008PRESSURE CONTROLLED INLET AND AERODYNAMIC LENSTABLE 1Dimensions and operating parameters of the two PCI designs467di-(2-ethylhexyl) sebacate (DOS) particles, formed by atomizing a solution of DOS in isopropyl alcohol, then dried and sizedas above, while polystyrene latex spheres (Duke Scientific, NC)PCI-IPCI-II were used for the size calibrations. For PCI-II model, all experiments were performed with ammonium nitrate particles, driedD O,up (µm)180180and sized as above.Dt (mm)31.819.6Experiments were performed with both PCI designs whileL(mm)152.471.6varyingPPCI from 107–653 mbar. In these experiments, variD S (mm)10.210.2oussizesof COdown were used to allow for different lens pres107–683467–653P PC I (mbar)suresandto optimize the final operating conditions. In addition,D O,down (µm)120–300120–150experimentswere performed at different P0 in order to mimicP Lens (mbar)1.33–2.01.65–1.95airbornemeasurementsand determine how particle transmis223.4–5.0Residence time, τ PC I (s)sionefficiencyisaffectedwhen the PCI samples from pressuresWeight (kg)1.80.5higher or lower than the chamber’s set point. During the experiments with P0 lower than that in Boulder, CO, i.e., 840 mbar,anadditional critical orifice was used on the monodisperse flowNOAA WP-3D research aircraft during the Texas Air Qualityoutof the DMA, before the flow splitter.Study/Gulf of Mexico Atmospheric Composition and ClimateStudy (TexAQS/GoMACCS) field campaign (Drewnick et al.2005; DeCarlo et al. 2006). Since particle transmission within Particle Size Calibrationsthe AMS depends on the aerodynamic lens system used and theAs particles are accelerated into the AMS vacuum system,lens pressure rather than the type of detector used with the AMS their ultimate velocity is size dependent (Jayne et al. 2000). Ve(quadrupole vs. time-of-flight), for simplicity, we will not refer locity calibration curves are obtained by converting the particleto the specific type of AMS used in the different experiments. time-of-flight into velocity for particles with a known size andThe three different lenses used for these experiments have the composition. Size calibrations for the PCI-I model were persame design with nominally similar transmission characteris- formed with P0 varying from 267–822 mbar, PPCI 107 mbar,tics. However, slight variations in lens transmission without a DO,down 300 µm, resulting in PLens 1.33 mbar and Q S 1PCI were observed and are discussed in the results section. Parti- STP cm3 s1 . The calibrations for the PCI-II design were carriedcle transmission through PCI-I and PCI-II, when detached from out under the conditions shown in Table 2. For the base cases,the AMS sampling inlet, was characterized by isokinetically in- size calibrations were performed without the PCI and with thetroducing monodisperse ammonium nitrate particles in the size appropriate DO,down to obtain a similar PLens as for the experirange of dva 95–620 nm into a particle counter (TSI CPC ments with the PCI in place.3025-A, St. Paul, MN) and the PCI upstream of another particle counter (N-MASS [Brock et al. 2000] for tests with PCI-IParticle Transmission Efficiencyand TSI CPC 3022-A for tests with PCI-II). Particle transmisThe overall collection efficiency in the AMS system, CE(dva ),sion through the PCI was determined to be close to 100% forisdefinedas the ratio of the number (or mass) of particles desubmicron aerosols in this size range.tected by the AMS relative to the number (or mass) of particlesintroduced into the AMS inlet (Huffman et al. 2005). ThereEXPERIMENTALare three major factors affecting CE as a function of particleIn order to characterize the performance of the PCI and AMS size (dva ): E L or particle transmission efficiency through theaerodynamic lens system, two types of particle experimentswere performed: size calibrations and transmission efficiency.TABLE 2For these experiments, monodisperse particles were generatedSummary of operating conditions in experiments with PCI-IIby atomizing a dilute solution of the desired species with a Colmodel. In all experiments, D O , up 180 µmlison atomizer (3076, TSI), drying the polydisperse particlesP0PPCIDO,down PLensQ S (STPby passing the flow through a diffusion drier filled with silica3 1(mbar)(mbar)(µm)(mbar)cms )gel, and size selecting with a low-voltage Differential Mobility Analyzer—DMA (a custom design DMA, now produced as840Not used1201.951.53Model 2000c, Brechtel Mfg., Hayward, CA or a TSI SMPS8406531301.921.393936). The flow containing the monodisperse particles from the600set to 653 (actual 547)1301.651.06DMA was then divided through a flow splitter and sampled by8405471301.651.06a Condensation Particle Counter (CPC 3025A or CPC 3010,7276531301.911.39TSI) and by the AMS through the PCI. For PCI-I model, par8404671501.761.31ticle transmission tests were performed with dry, monodisperse
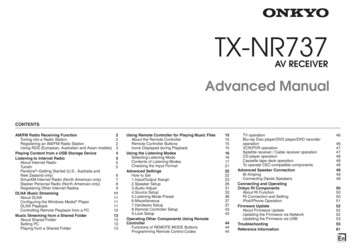
Downloaded By: [University of Colorado, Boulder campus] At: 12:23 18 June 2008468R. BAHREINI ET AL.inlet/lens system, E S or the striking efficiency of the measuredparticles on the AMS vaporizer relative to spherical particles,and E b or the fraction of particles hitting the vaporizer that arevaporized which is reduced by particle bounce off of the vaporizer. Since ammonium nitrate or DOS particles are used forthese experiments, E S and E b are equal to 1 (Huffman et al.2005; Matthew et al. Submitted). Hence a measurement of CEis equivalent to the particle transmission through the inlet/lenssystem, E L .Here, particle transmission efficiency through the PCI andthe aerodynamic lens inlet system, E L , as a function of particle size, dva , is calculated as the ratio of particles detected bythe AMS to those detected by the CPC when both AMS andCPC isokinetically sample monodisperse particles (e.g., Liu etal. 2007). For large enough particles, the number detected by theAMS is the number of particles counted as single particles. However, if the particles are small such that the mass of most of theindividual particles does not generate a signal response largeenough to cross the user-defined single-particle signal threshold, then the number of particles detected is calculated from themass measured by the AMS. When sampling from a DMA, itis also possible to sample multiply charged particles that havethe same mobility diameter as the singly charged particles buthave a larger physical diameter. In these experiments, when sizeselecting particles smaller than 300 nm, the number concentration of multiply charged particles was relatively small (1–12%depending on the size); yet they contributed to a significant fraction of the total mass (8–40% depending on the size). Therefore,when calculating E L for particles smaller than 300 nm, only theFIG. 2. Ambient (P0 ), PCI chamber (PPCI ), and lens pressures (PLens ) throughout a descent (a) as well as “airbeam” signal and mass flow rate (QS ) (b) during a research flight aboard NOAA WP-3D aircraft during the 2006 TexAQS/GoMACCS field campaign. Also plotted are measured and post-correctedairbeam signal (c) from a previous airborne measurement with an AMS withoutusing the PCI.FIG. 2.mass and number concentration of singly charged particles havebeen taken into account based on the signal fraction of the singlycharged particles determined from the AMS mass distribution.The following formula is used to calculate the number of singly
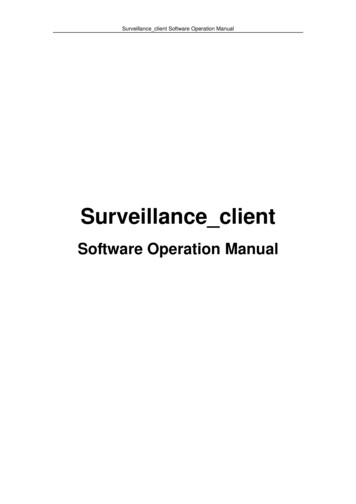
Downloaded By: [University of Colorado, Boulder campus] At: 12:23 18 June 2008PRESSURE CONTROLLED INLET AND AERODYNAMIC LENScharged particles detected following the mass-based method:Np SNH4 NO3 ·MNO3 · f q 1π 3d · ρNH4 NO36 m· M FNO3[3]where N p is the calculated number concentration of singlycharged particles detected by the AMS, MNO3 is the total measured mass concentration of nitrate, f q 1 is the mass fractionof singly charged particles determined from the AMS mass distribution, SNH4NO3 is the Jayne shape factor (0.8) (Jayne et al.2000; DeCarlo et al. 2004), dm is the selected mobility diameter, ρ NH4NO3 is the material density of ammonium nitrate (1.72g/cm3 ), and MFNO3 is the nitrate mass fraction (0.775). A similarequation is used to calculate the number of multiply charged particles in order to estimate the fraction of singly charged particlesout of total particles detected by the AMS. This number fractionis then used as our best approximation to estimate the numberconcentration of only the singly charged particles counted bythe CPC.RESULTS AND DISCUSSIONWhen the AMS samples from variable P0 without a PCI, iteffectively samples different mass flow rates. The internal standard of the instrument is the detected air ion signal (for nitrogenor oxygen), known as the “airbeam” (AB) (Allan et al. 2003).The AB is the measured ion rate for nitrogen (or oxygen) inthe difference signal (unblocked beam-blocked beam) and is theproduct of the number of nitrogen (or oxygen) molecules reaching the AMS detection region per unit time by their detectionefficiency (ions detected per molecule reaching the ionizationregion). When sampling at constant pressure and temperature,the mass flow rate and the flux of air molecules into the system are constant and the AB should track only with changes indetection sensitivity. One will introduce an artifact if the ABmeasured at variable P0 is used as the internal standard without correcting the effect of sampling pressure (Bahreini et al.2003). As shown in Figure 2a for AMS airborne measurementsduring the 2006 TexAQS/GoMACCS study onboard the NOAAWP-3D aircraft using PCI-II, PPCI was well controlled (at 467mbar) during a descent from 4.3 km to 0.8 km, corresponding toP0 changes from 595 to 922 mbar. The constant pressure withinthe PCI chamber (PPCI ) allowed for a constant lens pressure(PLens ) in the AMS (Figure 2a) and removed any pressure effects on the measured flow rate and the detected air signal tobetter than 2% (Figure 2b), and thus eliminated the need tocorrect the data for varying flow rate or airbeam signal. Plotted in Figure 2c are the measured and post-corrected air signal data points from a previous airborne measurement with anAMS (Bahreini et al. 2003) which did not incorporate a PCI onits inlet. After accounting for pressure effects, there still seemto be 10% random variation in the corrected air signal. Withthe PCI-I model maintained at PPCI 107 mbar and operatedin front of an AMS during the NEAQS-ITCT 2004 study, the469mass flow rate varied within 2% and the AB varied within 10%.As mentioned previously, sampling from variable P0 resultsin variable PLens and therefore variable degrees of supersonicexpansion from the nozzle at the end of the lens into the timeof-flight vacuum sizing chamber of the AMS. When the lenspressure is reduced, the expansion is less strong and particlesreach a lower terminal velocity. Since particle size is inferredfrom the time particles take to travel through a fixed distance inthe sizing chamber, this also results in pressure dependent sizecalibration (Bahreini et al. 2003). Previous experiments without a PCI have shown that a 6% reduction in P0 can cause a14% reduction in PL and lead to a measurable deviation in theobserved particle velocity, and therefore, the deduced particlesize (Bahreini et al. 2003). The PCI removes this dependence(Figure 3) where the velocity of dry monodisperse NH4 NO3particles as calculated from their corresponding times-of-flightfollows the same calibration curve regardless of P0 . Furthermore, this velocity calibration is unchanged from the base case(i.e., PCI removed from the inlet) since PLens values are similarin these experiments. Note that these experiments were carriedout with ammonium nitrate, and the lack of a deviation in thesize calibration indicates that this semi volatile species did notexperience significant evaporation in the PCI at these operatingconditions. Experiments using the PCI-I design and PSL particles (not shown) demonstrate that the velocity calibration isconstant with P0 267–828 mbar when PPCI was controlled at107 mbar.Transmission efficiency, E L , of particles as a function of sizethrough the lens can also be affected by variable P0 . A series ofexperiments were conducted to characterize E L when the AMSsampled through the PCI at variable PPCI . Experiments usingPCI-I model show that with PPCI 107 mbar and DO,down FIG. 3. Size calibration is unchanged in experiments with similar lens pressure (PLens ). Data points are size selected dry ammonium nitrate particles.
Downloaded By: [University of Colorado, Boulder campus] At: 12:23 18 June 2008470R. BAHREINI ET AL.TABLE 3Summary of operating conditions in experiments with PCI-Imodel. In all experiments, P0 840 mbar and DO,up 180 µmPPCI (mbar)Not used683433107FIG. 4. AMS transmission efficiency, EL , as a function of particle size, dva ,with PCI-I (a) and PCI-II (b,c) designs at different operating conditions.300 µm (PLens 1.33 mbar), transmission efficiency of particles larger than dva 200 nm is poor compared to transmissionwithout the PCI (DO,down 120 µm) (Figure 4a). Since this configuration was used for the 2004 NEAQS-ITCT airborne study,DO,down (µm)PLens (mbar)1201301403002.01.871.381.33there were substantial particle transmission losses as a functionof size in the raw field data, to which a correction was applied.Interestingly, particle beam position studies in the AMS vacuumchamber, carried out using a beam width probe (Huffman et al.2005) while varying P0 in the range of 267–827 mbar, showedthat the fraction of particles in the center of the particle beamdid not change significantly, regardless of size or transmissionefficiency. This indicates that particle transmission losses forthese conditions were occurring upstream of the AMS chamber,i.e., in the PCI and aerodynamic lens system. Tests of the firstPCI design after the 2004 field study (sampling conditions summarized in Table 3 and results shown in Figure 4a) showed thatthere was an improvement in E L when PPCI was controlled inthe range of 433–683 mbar compared to PPCI 107 mbar. Sincethe highest altitude expected during subsequent airborne studieswith NOAA WP-3D or NSF C-130 aircrafts is less than 7 km,the lowest PPCI tested with the PCI-II design was 467 mbar. Asshown in Figure 4b, with PPCI in the range of 467–653 mbar,P0 840 mbar, and PLens 1.65–1.95 mbar, E L stays close to100% for all particle sizes tested. However, E L of particles largerthan dva 450 nm is reduced if P0 is lower than the set point ofthe PCI chamber pressure (filled diamond vs. open square datapoints in Figure 4c). Thus, in order to avoid lack of pressure control at some altitudes during aircraft sampling for example, theoptimum PPCI is the lowest controllable pressure with a matching DO,down that would still allow PLens to be similar to that of thebase case condition ( 1.6–1.9 mbar). For this reason, PPCI 467 mbar along with DO,down 150 µm were selected for sampling aboard NSF C-130 aircraft during MILAGRO/INTEX-Bas well as the measurements made on NOAA WP-3D aircraftduring the 2006 TexAQS/GoMACCS field study.Note that for the data points without the PCI, E L values inFigure 4a are different than those in Figure 4b predominantlydue to transmission variations among nominally similar aerodynamic lenses. Although not shown, when PCI-II design wasplaced in front of the aerodynamic lens used to test with PCI-Idesign and was operated at PPCI 467 mbar and PL 1.79mbar, transmission of the particles larger than dva 500 nmdecrease to values less than 0.8, indicating that the lens designand machining characteristics have a stronger influence on particle transmission than the PCI design. Furthermore, E L valuespredicted for the AMS lens system by the Fluent model (Liu
Downloaded By: [University of Colorado, Boulder campus] At: 12:23 18 June 2008PRESSURE CONTROLLED INLET AND AERODYNAMIC LENSet al. 2007) lie in between the different measurements, possiblydue to different DO,down and PLens in the experiments (Tables2–3) compared to those in the simulations (100 µm and 1.73mbar) or because of different transmissions across nominallysimilar lens systems.CONCLUSIONSDesign and operational characteristics of two PCI designs aredescribed here as they were implemented on AMS instrumentswith an aerodynamic aerosol lens system. Laboratory experiments show that particle size calibrations in the AMS remain unchanged within measurement precision when it samples throughthe PCI at pressures higher than PPCI . Characterization experiments on the PCI also reveal that particle transmission efficiencyremains close to 100% if PLens 1.65–1.95 mbar, PPCI is controlled at 467–653 mbar, and P0 is higher than PPCI . Basedon the results from these experiments, a suitable combination ofDO,down (150 µm) and PPCI (467 mbar) was selected that allowsfor pressure controlled conditions within the PCI at altitudes upto 6.5 km. Airborne measurements using PCI-II model, operated under these conditions upstream of an AMS, show that themass flow rate and “airbeam” signal of the AMS are well controlled and stay constant with variations smaller than 2% duringa typical flight.REFERENCESAllan, J. D., Jimenez, J. L., Williams P. I., Alfarra, M. R., Bower, K. N.,Jayne, J. T., Coe, H., and Worsnop, D. R. (2003). Quantitative SamplingUsing an Aerodyne Aerosol Mass Spectrometer. Part 1: Techniques ofData Interpretation and Error Analysis, J. Geophys. Res. 108 (D3):4090,doi:10.1029/2002JD002358.Bahreini, R., Jimenez, J. L., Wang, J., Flagan, R. C., Seinfeld, J. H., Jayne, J. T.,and Worsnop, D. R. (2003). Aircraft-Based Aerosol Size and CompositionMeasurements During ACE-Asia Using and Aerodyne Aerosol Mass Spectrometer, J. Geophys. Res., 108 (D23):8645, doi:10.1029/2002JD003226.Brock, C. A., Schroder, F., Karcher, B., Petzold, A., Busen, R., and Fiebig, M.(2000). Ultrafine Particle Size Distributions Measured in Aircraft ExhaustPlumes, J. Geophys. Res. 105 (D21):26555–26567.DeCarlo, P. F., Kimmel, J. R., Trimborn, A., Jayne, J., Aiken, A. C., Gonin,M., Fuhrer, K., Horvath, T., Docherty, K. S., Bates, D. R., and Jimenez, J. L.(2006). A Field-Deployable High-Resolution Time-of-Flight Aerosol MassSpectrometer, Anal. Chem. 78 (24):8281–8289.DeCarlo, P. F., Slowik, J. G., Worsnop, D. R., Davidovits, P., and Jimenez, J. L.(2004). Particle Morphology and Density Characterization by Combined Mobility and Aerodynamic Measurements. Part 1: Theory, Aerosol Sci. Technol.38 (doi: 10.1080/027868290903907):1185–1205.Drewnick, F., Hings, S. S., DeCarlo, P., Jayne, J. T., Gonin, M., Fuhrer, K.,Weimer, S., J. Jimenez, L., Borrmann, K. L. D. S., and Worsnop, D. R. (2005).A New Time-of-Flight Aerosol Mass Spectrometer (TOF-AMS)—Instrument471Description and First Field Deployment, Aerosol Sci. Technol. 39 (7):637–658.Huffman, J. A., Jayne, J. T., Drewnick, F., Aiken, A. C., Onasch, T., Worsnop,D. R., and Jimenez, J. L. (2005). Design, Modeling, Optimization, and Experimental Tests of a Particle Beam Width Probe for The Aerodyne AerosolMass Spectrometer, Aerosol Sci. Technol. 39 (12):1143–1163.Jayne, J. T., Leard, D. C., Zhang, X., Davidovits, P., Smith, K. A., Kolb, C. E., andWorsnop, D. W. (2000). Development of an Aerosol Mass Spectrometer forSize and Composition Analysis of Submicron Particles, Aerosol Sci. Technol.33:49–70.Jimenez, J. L., Jayne, J. T., Shi, Q., Kolb, C. E., Worsnop, D. R., Yourshaw, I., Seinfeld, J. H., Flagan, R. C., Zhang, X., Smith, K. A., Morris, J., and Davidovits,P. (2003). Ambient Aerosol Sampling with an Aerosol Mass Spectrometer, J.Geophys. Res., 108 (D7):8425, doi:10.1029/2001JD001213.Lee, J. K., Rubow, K. L., Pui, D. Y. H., and Liu, B. Y. H. (1993). Design andPerformance Evaluation of a Pressure-Reducing Device for Aerosol Samplingfrom High-Purity Gases, Aerosol Sci. Technol. 19 (3):215–226.Liu, P., Ziemann, P. L., Kittelson, D. B., and McMurry, P. H. (1995a). Generating Particle Beams of Controlled Dimensions and Divergence: I. Theory ofParticle Motion in Aerodynamic Lenses and Nozzle Expansion, Aerosol Sci.Technol. 22:293–313.Liu, P., Ziemann, P. L., Kittelson, D. B., and McMurry, P. H. (1995b). GeneratingParticle Beams of Controlled Dimensions and Divergence: II. ExperimentalEvaluation of Particle Motion in Aerodynamic Lenses and Nozzle Expansions, Aerosol Sci. Technol. 22:314–324.Liu, P. S. K., Deng, R., Smith, K. A., Williams, L. R., Jayne, J. T., Canagaratna,M. R., Moore, K., Onasch, T. B., Worsnop, D. R., and Deshler, T.(2007). Transmission Efficiency of an Aerodynamic Focusing Lens System: Comparison of Model Calculations and Laboratory Measurements forthe Aerodynamic Aerosol Mass Spectrometer, Aerosol Sci. Technol. 41:721–733.Matthew, B. M., Onasch, T. B., and Middlebrook, A. M. (Submitted 2008). Collection Efficiencies in an Aerodyne Aerosol Mass Spectrometer as a Functionof Particle Phase for Laboratory Generated Aerosols, Aerosol Sci. Technol.Murphy, D. M. (2007). The Design of Single Particle Laser Mass Spectrometers,Mass Spectrom. Rev. 26 (2):150–165.Schreiner, J., Schild, U., Voigt, C., and Mauersberger, K. (1
Many of these aerosol instruments are being used in airborne studies in the troposphere where the ambient pressure decreases . characterized in the laboratory, and used in airborne field stud-ies. Both designs are similar in theory to the University of Min-nesota pressure reducer (Lee et al. 1993), where the inlet flow at .