Transcription
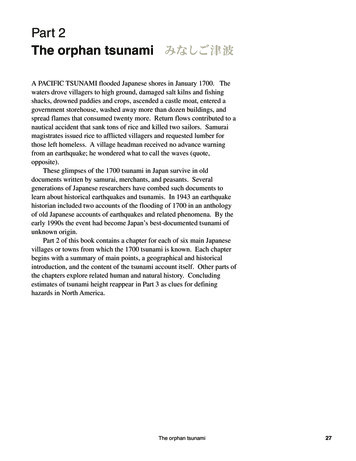
Report of Investigation 2019-3REGIONAL TSUNAMI HAZARD ASSESSMENT FOR FALSE PASSAND PERRYVILLE, ALASKAE.N. Suleimani, J.B. Salisbury, D.J. Nicolsky, and R.D. KoehlerFalse Pass, Alaska. Photo: Amy Macpherson.Published bySTATE OF ALASKADEPARTMENT OF NATURAL RESOURCESDIVISION OF GEOLOGICAL & GEOPHYSICAL SURVEYS
REGIONAL TSUNAMI HAZARD ASSESSMENT FOR FALSE PASSAND PERRYVILLE, ALASKAE.N. Suleimani, J.B. Salisbury, D.J. Nicolsky, and R.D. KoehlerReport of Investigation 2019-3State of AlaskaDepartment of Natural ResourcesDivision of Geological & Geophysical Surveys
STATE OF ALASKAMichael J. Dunleavy, GovernorDEPARTMENT OF NATURAL RESOURCESCorri A. Feige, CommissionerDIVISION OF GEOLOGICAL & GEOPHYSICAL SURVEYSSteve Masterman, State Geologist and DirectorPublications produced by the Division of Geological &Geophysical Surveys (DGGS) are available for free downloadfrom the DGGS website (dggs.alaska.gov). Publications onhard-copy or digital media can be examined or purchased inthe Fairbanks office:Alaska Division of Geological & Geophysical Surveys3354 College Rd., Fairbanks, Alaska 99709-3707Phone: (907) 451-5010 Fax (907) 451-5050dggspubs@alaska.gov dggs.alaska.govDGGS publications are also available at:Alaska State Library,Historical Collections & Talking Book Center395 Whittier StreetJuneau, Alaska 99811Alaska Resource Library and Information Services (ARLIS)3150 C Street, Suite 100Anchorage, Alaska 99503Suggested citation:Suleimani, E.N., Salisbury, J.B., Nicolsky, D.J., and Koehler, R.D., 2019, Regionaltsunami hazard assessment for False Pass and Perryville, Alaska: Alaska Division ofGeological & Geophysical Surveys Report of Investigation 2019-3, 16 p., 2 sheets.doi.org/10.14509/30192
ContentsAbstract. 1Introduction. 1Project Background: Regional and Historical Context. 3Community Profiles. 3Seismic and Tsunami History. 3Methodology and Data. 3Methodology. 3Computational Grids and Data Sources. 4Tsunami Sources. 6Scenario 1. Mw 9.0 earthquake: SAFRR-type event. 8Scenario 2. Mw 9.0 earthquake: Maximum slip at 15–25 km (9–15 mi) depth. 9Scenario 3. Mw 9.0 earthquake: Maximum slip at 25–35 km (15–22 mi) depth. 9Numerical Model of Tsunami Propagation and Runup. 9Modeling Results. 9Summary. 13Acknowledgments. 14References. 14FiguresFigure 1. Map of the western Alaska Peninsula and eastern Aleutian Islands. 2Figure 2. Nested bathymetry/topography grids for numerical modeling of tsunamipropagation and runup. 6Figure 3. Vertical coseismic deformations corresponding to scenarios 1–3. 7Figure 4. Maximum tsunami height for scenarios 1–3 in the level 3 grid for False Pass. 10Figure 5. Maximum tsunami height for scenarios 1–3 in the level 3 grid for Perryville. 11Figure 6. Maximum composite tsunami height for False Pass. 12Figure 7. Maximum composite tsunami height for Perryville. 12Figure 8. Time series of water level for scenarios 1–3 at False Pass and Perryville. 13TablesTable 1. Tsunami effects at False Pass and Perryville. 4Table 2. Nested grids used to compute propagation of tsunami waves generated in the PacificOcean to the communities of False Pass and Perryville. 5Table 3. Significant credible tsunami sources for False Pass and Perryville. 8Map SheetsSheet 1. Tsunami hazard map for False Pass, AlaskaSheet 2. Tsunami hazard map for Perryville, Alaska
REGIONAL TSUNAMI HAZARD ASSESSMENT FOR FALSE PASSAND PERRYVILLE, ALASKAE.N. Suleimani,1 J.B. Salisbury,2 D.J. Nicolsky,1 and R.D. Koehler 3AbstractWe assess potential tsunami hazard for the coastal communities of False Pass onUnimak Island and Perryville on the Alaska Peninsula. The primary tsunami hazard forthese communities is considered to be near-field, with the major threat originatingfrom tsunamigenic earthquakes along the Alaska–Aleutian megathrust. Wenumerically model tsunamis generated by three different megathrust earthquakes,analyze tsunami wave dynamics, and develop approximate tsunami hazard mapsfor the communities. The hypothetical tsunami scenarios examined simulate Mw9.0megathrust earthquakes with a slip distribution in the 5–54 km (3–33 mi) depth rangealong the Alaska–Aleutian megathrust. The maximum runup heights are 13 m (42ft) in False Pass and 21 m (69 ft) in Perryville. Results presented here are intendedto provide guidance to local emergency management agencies in initial tsunamiinundation assessment, evacuation planning, and public education for mitigation offuture tsunami hazards.INTRODUCTIONTsunami hazards along Alaska’s Pacific coastline are high. Virtually all of Alaska’s southern andsoutheastern coasts are defined by major offshorefault systems. Unlike tsunamis that are caused bydistant earthquakes on the other side of the Pacific,Alaska’s greatest tsunami hazards originate justoffshore and can inundate coastlines within an hourof a causative earthquake. This reduces the timeavailable to respond and evacuate, and can producedrastically higher wave heights than far-traveledtsunamis. Because many Alaska communities hugthe shoreline (due to some combination of steepmountains, dense forests, and/or reliance on theopen water for transportation), many Alaskacommunities are within the tsunami inundationzone and are at risk of rapid flooding. In additionto earthquake-generated (i.e., tectonic) tsunamis,mass movements of sediments down slopes (eitheron land or in the ocean) can also generate tsunamis.While rapid tsunami flooding is the immediateconcern after a large coastal earthquake, dangerousnear-shore ocean currents and permanent changesto the local coastline are additional concerns.The local, tectonic tsunami danger to communities on the Alaska Peninsula and in the AleutianIslands comes primarily from the Alaska-Aleutiansubduction zone (fig. 1). This subduction zonemarks the boundary between the Pacific plate tothe south and the North American plate to thenorth. Relative to the North American plate, thePacific Plate is moving northwest at approximately5–8 cm (2–3 inches) per year, colliding with theNorth American plate and diving beneath it in aprocess known as subduction. The latest sequenceof large megathrust earthquakes began in 1938Alaska Earthquake Center, Geophysical Institute, University of Alaska, P.O. Box 757320, Fairbanks, Alaska 99775-7320;ensuleimani@alaska.edu2Alaska Division of Geological & Geophysical Surveys, 3354 College Rd., Fairbanks, Alaska 99709-3707.3Nevada Bureau of Mines and Geology, Mackay School of Earth Science and Engineering, University of Nevada, Reno,1664 North Virginia Street, MS 178, Reno, NV 895571
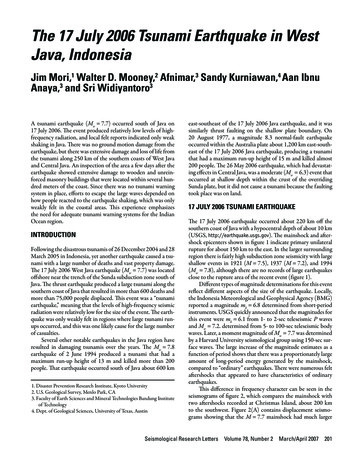
Report of Investigation 2019-358 N2North American PlateKodiak Is.aulsinsaAlBering Sea56 NnPeakService Layer Credits: Esri, Garmin, GEBCO,NOAA NGDC, and other contributorsPerryville19381948Unimak Is.54 N1964False PassdslanIsFoxShumaginIslands1946oneion zianut-Ale1957kaAlas165 Wuctsubd162 WPacific Ocean159 W156 W153 WFigure 1. Map of the western Alaska Peninsula and eastern Aleutian Islands, showing the locations of the communities of FalsePass and Perryville. The rupture areas in the latest sequence of great and large earthquakes are shown by shaded ovals.with a Mw 8.3 earthquake west of Kodiak Island(Estabrook and others, 1994). Four subsequentevents, the 1946 Mw 8.6 Aleutian (Lopez andOkal, 2006), 1957 Mw 8.6 Andreanof Islands(Johnson and others, 1994), 1964 Mw 9.2 Alaska(Kanamori, 1970), and 1965 Mw 8.7 Rat Island(Wu and Kanamori, 1973; not pictured) earthquakes, ruptured almost the entire length of themegathrust. Tsunamis generated by these greatearthquakes reached Alaska coastal communitieswithin minutes and resulted in widespread damageand loss of life (National Geophysical DatabaseCenter/World Data Service [NGDC/WDS]).The specifics of tsunami hazards are particular to each community and vary considerablyover large regions. The shape of the coastline, localbathymetry, and topography all affect tsunamiimpacts. More importantly, however, is the earthquake source (the location, size, and style) beingconsidered and the community’s location relativeto that earthquake.The impacts of future earthquakes andtsunamis can be reduced if citizens, emergencymanagers, and city planners take steps to mitigatethe hazards. This report is intended to supporthazard mitigation efforts by providing approximate tsunami hazard estimates for False Pass andPerryville. The scenario earthquakes, numericaltsunami models, and resulting maps are developedon a regional level and lack the precision of studiesthat are fully tailored to individual communities(e.g., Nicolsky and others, 2013; Nicolsky andothers, 2014; Suleimani and others, 2013; 2015).The current study does not include sensitivity tests
Regional tsunami hazard assessment for False Pass and Perryville, Alaska3and is based on three scenario earthquakes. Evenso, the results provide a good first approximationof tsunami hazard. The maps, documentation,and available digital data provide a foundation forpublic education, support the development of evacuation procedures, and provide insights intendedto improve community resilience.the ship “Manning” transported people from theKatmai area to Ivanof Bay and later to the newvillage site. The village was originally called “Perry”,but the “ville” was added to conform to the name ofthe area’s post office, established in 1930. Perryvilleis only accessible by boat and aircraft. Scheduledand charter flights are available from King Salmon.PROJECT BACKGROUND:REGIONAL AND HISTORICALCONTEXTCommunity ProfilesSeismic and Tsunami HistoryFalse Pass (54 49'40"N, 163 23'57"W),population 60, is on the eastern end of UnimakIsland on a strait that connects the Pacific Oceanto the Bering Sea; another part of the communityis across the strait on the westernmost tip of theAlaska Peninsula (fig. 1). False Pass is 1,040 km(646 mi) southwest of Anchorage and 322 km (200mi) east of Dutch Harbor. According to the AlaskaDepartment of Commerce, Community andEconomic Development’s Division of Communityand Regional Affairs (DCCED/DCRA, 2013), thearea was originally settled by a homesteader in theearly 1900s, and the first cannery was establishedin 1917. Alaska Natives relocated to False Passwhen the cannery was built. The cannery operated almost continuously until it was destroyed byfire in 1981. The city was incorporated in 1990.False Pass is a federally recognized tribe, primarilyUnangan. Fishing, fish processing, and subsistenceactivities are major parts of the lifestyle. Boat andaircraft are the only ways to get to False Pass.Perryville (55 54'49"N, 159 09'04"W), population 113, is on the southern coast of the AlaskaPeninsula (fig. 1). It is 805 km (500 mi) southwest of Anchorage, and 443 km (275 mi) southwest of Kodiak. Perryville is an Alutiiq communityand a federally recognized tribe, and maintains asubsistence lifestyle. Commercial fishing providescash income. According to DCCED (2013), thecommunity was founded in 1912 as a refuge forAlutiiq people driven away from their villages bythe eruption at Mount Katmai. Captain Perry ofPerryville and False Pass are on opposite endsof the Shumagin Islands archipelago, a regioncomprised of 20 small islands where the rate ofplate convergence is approximately 63–66 mm(2.5–2.6 in) per year (fig. 1; DeMets and others,1990; Page and others, 1991; Argus and others,2010). The Alaska-Aleutian megathrust beneaththe Alaska Peninsula region has produced significant tsunamigenic earthquakes in the past. Referto “Seismic and Tsunami History” in Nicolsky andothers (2017) for a detailed description of theseevents and a summary of the tectonic regime of thewestern Alaska Peninsula.According to the National Centers forEnvironmental Information (NCEI; formerlyknown as National Geophysical Database Center[NGDC]) Global Historical Tsunami Database (doi.org/10.7289/V5PN93H7) and Lander(1996), both False Pass and Perryville have beenaffected by historical tsunamis (table 1). On April1, 1946, a Mw 8.6 earthquake near UnimakIsland triggered a major destructive tsunamiin the Pacific Ocean (Lopez and Okal, 2006).Local waves reached 42 m (138 ft) on UnimakIsland and 3 m (10 ft) in Perryville. The GreatAlaska Earthquake of March 27, 1964, resultedin some damage at the False Pass cannery. Otherearthquakes and tsunamis likely affected theareas around False Pass and Perryville in the past;however, no records of events prior to 1946 areavailable.METHODOLOGY AND DATAMethodologyThe regional tsunami hazard maps presentedhere are the product of collaborative efforts
4Report of Investigation 2019-3Table 1. Tsunami effects at False Pass and Perryville: data from the National Centers for Environmental Information (NCEI;formerly known as National Geophysical Data Center [NGDC]) Global Historical Tsunami Database (doi.org/10.7289/V5PN93H7) and comments from Lander (1996).DateMagnitude (Mw)OriginMaximum WaterHeight (m)CommentsaFalse Pass04/01/19468.6Unimak Island,Alaska42.0Relatively lightdamage atthe False Passcannery. Pilingswere scattered.3.0Tsunami wavesaffected thearea about 4.5hours after theshock. Three orfour waves werereported.Perryville03/27/19649.2Gulf of AlaskaLander, 1996abetween state and federal agencies to assist coastalcommunities in Alaska with tsunami hazardassessment. In recent years, similar tsunami hazardstudies have been published for other communities(Nicolsky and others, 2011; Nicolsky and others,2013; Nicolsky and others, 2014; Suleimani andothers, 2010; Suleimani and others, 2013, 2015).Because the currently-available DEMs for thesesouthern Alaska communities are of insufficientquality for high-resolution modeling, we followthe National Tsunami Hazard Mitigation Program(NTHMP, 2010) guidelines for determiningtsunami hazard zones for areas that have eitherlow risk due to small population size and minimalinfrastructure vulnerability, or do not have accessto high-resolution tsunami inundation maps. Thetsunami hazard maps for False Pass and Perryville aredeveloped using the methodology described in detailin Suleimani and others (2018a). In short, for threescenario earthquakes, we modeled water dynamicsfrom source to community and computed maximumtsunami wave heights using the highest resolutiongrids available (see table 2). Each model run covers6 hours of post-earthquake tsunami propagationto account for all waves in the wave train, as wellas secondary (reflected) wave interactions. At everylocation throughout the high-resolution grids, themaximum tsunami height from any of the threeearthquakes is saved, and we use these maximumvalues to extrapolate wave heights on land in a new,“composite” map of maximum runup heights thatcan be expected from the earthquake scenarios.Computational Grids and DataSourcesTo develop a regional tsunami hazard map weuse a series of nested computational grids. A nestedgrid allows for higher resolution in areas where itis needed without expending computer resourcesin areas where it is not. The bathymetric and topographic relief in each nested grid is based on DEMsdeveloped at the National Centers for EnvironmentalInformation (NCEI) of the National Oceanic &Atmospheric Administration (NOAA) in Boulder,
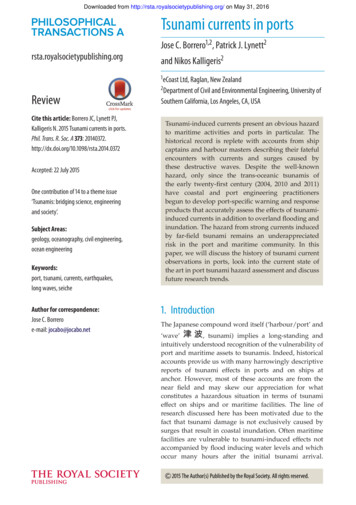
Regional tsunami hazard assessment for False Pass and Perryville, Alaska5Table 2. Nested grids used to compute propagation of tsunami waves generated in the Pacific Ocean to the communities of False Pass and Perryville. The fine-resolution grids are used to compute the inundation. Note that the grid resolution in meters is not uniform and is used to illustrate grid fineness in the region of the western Alaska Peninsula. The firstdimension is the longitudinal grid resolution; the second is the latitudinal resolution.Grid nameResolutionarc-secondsMeters (nearFalse evel 0, Northern Pacific120 120 1,850 3,700120 00' E –100 00' W10 00' N –65 00' NLevel 1, Eastern Aleutians24 24 430 740171 58' W –157 02' W52 00' N –57 28' NLevel 2, Coarse resolution,False Pass8 8 150 250161 47'44" W – 54 14'35" N –163 48'42" W 55 30'14" NLevel 2, Coarse resolution,Perryville8 8 150 250157 29'20" W – 54 35'51" N –161 31'16" W 56 37'12" NLevel 3, Fine-resolution,False Pass8/3 8/3 48 82162 50'51" W – 54 37' N –163 28'45" W 54 58'56" NLevel 3, Fine-resolution,Perryville8/3 8/3 48 82157 58'40" W – 55 30'58" N –159 35'34" W 56 26'28" NColorado. The extent of each grid used for the FalsePass and Perryville mapping project is shown in figure2 and listed in table 2. The coarsest grid, level 0, with2-arc-minute (approximately 2 km) resolution, spansthe central and northern Pacific Ocean. The bathymetric data for the 2-arc-minute-resolution grid isextracted from the ETOPO2 dataset (NCEI/NOAA,doi.org/10.7289/V5J1012Q). We use two intermediate grids between the coarsest- and highest-resolution grids (table 2). The first intermediate grid of24 arc-second resolution (level 1) was developed toaccommodate the current tsunami mapping projectfor False Pass and Perryville as well as other tsunamimapping efforts for communities located in the FoxIslands, St. Paul Island, and St. George Island (fig. 2).The data sources and methodology used to developthe 24-arc-second DEMs are described in detail byLim and others (2011). The 8-, and 8/3-arc-secondDEMs were developed by the National Oceanic andAtmospheric Administration’s NCEI in the scope ofNTHMP (Jason Caldwell, oral communication).The spatial resolution of the fine-resolutiongrid cells, about 48 82 m (157 269 ft), satisfiesNOAA minimum recommended requirements forestimation of the tsunami hazard zone (NationalTsunami Hazard Mapping Program [NTHMP],2010); however, no DEM verification effortswere conducted to reduce uncertainties in thehigh-resolution, level 3, False Pass and Perryvillegrids. Therefore, in this report we do not performhigh-resolution runup modeling, but provide anestimation of the tsunami hazard zone by extrapolating the maximum composite tsunami waveheight on land according to the tsunami scenariosdescribed below. We account for uncertaintiesinherent to this method by applying a safety factor
Report of Investigation 2019-358 N6St. Paul Is.56 NSt. George Is.PerryvilleLevel 3Bering SeaFalsePassLevel2Service Layer Credits: Esri, Garmin,GEBCO,Level 3NOAA NGDC, and other contributorsLevel 254 NdsFoxnIsla52 NLevel 1Pacific OceanLevel 0174 W171 W168 W165 W162 W159 W156 WFigure 2. Nested bathymetry/topography grids for numerical modeling of tsunami propagation and runup. The coarsestgrid, level 0, covers the central and northern Pacific Ocean. The location of each embedded grid is marked by a redrectangle. Refer to table 2 for grid parameters.of 1.3 (Suleimani and others, 2018a) to the estimated hazard zone.Tsunami SourcesIn this project we use a deterministic approachto develop potential tsunami sources, which isdistinctly different from the probabilistic hazardanalyses used in projects with different objectives,such as land-use planning or insurance estimates(Geist and Parsons, 2006). Alaska tsunami hazardmaps are produced on the basis of significant credible tsunamigenic earthquake scenarios for a givensegment of the coastline. Although we do notexplicitly develop worst-case tsunami scenarios forFalse Pass and Perryville, we use the underlyingassumptions and results from previous high-resolution tsunami mapping studies (see for example,Nicolsky and others, 2017) regarding the maximumconsidered earthquake scenarios for other locationsalong the Alaska-Aleutian subduction zone.In this regional tsunami hazard assessmentwe consider three characteristic tsunamigenicearthquake scenarios (e.g., Suleimani and others,2018a). These potential megathrust ruptures havea uniform slip distribution along strike, but differin the downdip slip distribution pattern such thatthe depth range at which the maximum slip occursvaries from the shallow region close to the trenchto the deeper parts of the plate interface. Allruptures have the same lateral extent, which isdetermined by the location of communities andconstrained by maximum seismic moment. Referto Suleimani and others (2018a) for a description
Regional tsunami hazard assessment for False Pass and Perryville, Alaskaof the scenario development and for the proposedslip distributions.The three characteristic tsunami scenarios forFalse Pass and Perryville are outlined below. Thevertical coseismic deformations for these scenariosare shown in figure 3. The main rupture parameters and amount of permanent subsidence in thecommunities are listed in table 3.Displacement, m57 NScenario 1: MW9.0 earthquake, SAFRR-type event.PerryvilleFalse Pass55 N53 N51 N164 W160 W156 W152 WDisplacement, m57 NScenario 2: MW9.0 earthquake, maximum slip at 15 - 25 km depth.PerryvilleFalse Pass55 N53 N51 N164 W160 W156 W152 WDisplacement, m57 NScenario 3: MW9.0 earthquake, maximum slip at 25 - 35 km depth.PerryvilleFalse Pass55 N53 N51 N164 W160 W7156 W152 WFigure 3. Vertical coseismic deformations corresponding toscenarios 1–3. Blue areas are associated with coseismic groundsubsidence; areas of uplift are shown in red.
8Report of Investigation 2019-3Table 3. Significant credible tsunami sources for False Pass and Perryville. “Actual subsidence” is the subsidence that themodel shows for the community, which may be (significantly) less than the maximum expected subsidence across theentire region for that same earthquake scenario.Depthrange,km (mi)Maximum slipdepthrange,km p, m (ft)uplift,ence,m (ft)m (ft)Actualsubsidence inFalsePass,m (ft)Actualsubsidence inPerryville,m (ft)1Mw 9.0earthquake:SAFRR-typeevent, slip nearthe trench8–54(5-33)11–14(7-8.5)55–65-3.4 (-11.2) 14.7 (48.2)(180-213)-0.2(-0.7)-0.4(-1.3)2Mw 9.0earthquake:Maximum slipat 15–25 km(9.3–15.5 mi)depth5–35(3-21.7)15–25(9.3-15.5)34–35-6.3 (-20.7) 13.2 (43.3)(111-115)-0.3(-1.0)-0.5(-1.6)3Mw 9.0earthquake:Maximum slipat 25–35 km(15.5–21.7 mi)depth14–45(8-26)25–3534–35 (111-5.7 (-18.7) 12.6 Scenario 1. Mw 9.0earthquake: SAFRR-typeeventA hypothetical Mw 9.0 earthquake rupturing the Alaska–Aleutian megathrust. During the 2011 Tohoku earthquake alarge amount of slip occurred in a shallow region betweenthe subducting and overriding plates near the Japan trench(Fujii and others, 2011; Shao and others, 2011). The USGSScience Application for Risk Reduction (SAFRR) project, incollaboration with NOAA and State of California agencies,has developed a plausible hypothetical tsunami scenario(Kirby and others, 2013) to describe the impacts of a tsunami generated by an earthquake in the Alaska Peninsularegion (Ross and others, 2013). Here we assume that theslip distribution in the downdip direction is the same asthat in the SAFRR source, where greater slip occurs close tothe trench. This hypothetical rupture is positioned acrossthe undersea shelf from False Pass and Perryville. The slipis distributed almost uniformly along strike except for theedges of the rupture, where it tapers. The maximum slipof 46 m (151 ft) is at a depth of 5–15 km (3–9 mi). Verticalcoseismic deformations for this scenario are shown infigure 3a.
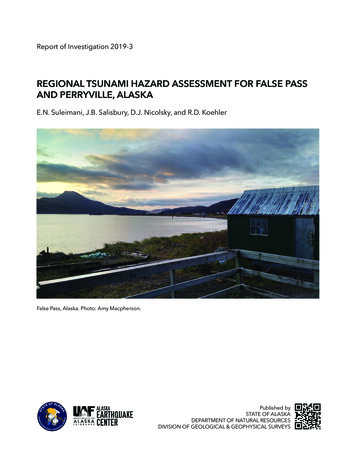
Regional tsunami hazard assessment for False Pass and Perryville, AlaskaScenario 2. Mw 9.0earthquake: Maximum slip at15–25 km (9–15 mi) depthA hypothetical Mw 9.0 earthquake rupturing the Alaska–Aleutian megathrust. The slip is distributed almost uniformly alongstrike except for the edges of the rupture, where it tapers.The maximum slip of 35 m (115 ft) is at a depth of 15–25 km(9–15 mi). Vertical coseismic deformations for this scenarioare shown in figure 3b.Scenario 3. Mw 9.0earthquake: Maximum slip at25–35 km (15–22 mi) depthA hypothetical Mw 9.0 earthquake rupturing the Alaska–Aleutian megathrust. The slip is distributed almost uniformly alongstrike except for the edges of the rupture, where it tapers.The maximum slip of 35 m (115 ft) is at a depth of 25–35 km(15–22 mi). Vertical coseismic deformations for this scenarioare shown in figure 3c.Numerical Model of TsunamiPropagation and RunupThe numerical model currently used by theAlaska Earthquake Center (AEC) for tsunami inundation mapping is a nonlinear, flux-formulated,shallow-water model (Nicolsky and others, 2011)that has been validated (NTHMP, 2012) through aset of analytical benchmarks and tested against laboratory and field data (Synolakis and others, 2007).The application of the model to tsunami inundationmapping of Alaska’s coastal communities, includingits assumptions and limitations, is described in anumber of previous tsunami reports (for example,Suleimani and others, 2018b). In this study weconduct all model runs using bathymetric datathat correspond to the Mean Higher High Water(MHHW) tide level in False Pass and Perryville.For each tsunami scenario, we first calculate themaximum tsunami wave heights in the highest-resolution grid over the course of the entire model runin the following way: at each grid point, the tsunamiwave height is computed at every time step duringthe tsunami propagation time and the maximumvalue is kept. Then we compute the compositemaximum wave height from all considered scenariosby again choosing the maximum value for each gridpoint among all scenarios, and plot the results.9MODELING RESULTSFigures 4 and 5 show the maximum tsunamiheights for scenarios 1–3 in the False Pass andPerryville level 3 grids, respectively. In the False Passarea, all scenarios produce a similar energy pattern.The highest tsunami amplitudes are present alongthe south shore of the Ikatan Peninsula, which actsas a shelter for Ikatan Bay and False Pass. In thePerryville grid, scenarios 1 and 2 result in highertsunami amplitudes along the coastline east of thecommunity, while scenario 3 generates high-amplitude waves that are almost uniformly distributedalong the southern coast of the Alaska Peninsula.We show the maximum composite tsunamiheight (including inundated coastlines) for allscenarios calculated for the vicinity of False Passin figure 6. The absolute maximum value of thetsunami height in this region is 10 m (32.8 ft); multiplied by a safety factor of 1.3 it predicts 13 m (42.7ft) for the maximum estimated runup height forFalse Pass. Figure 7 shows the maximum compositetsunami height for all scenarios calculated for thevicinity of Perryville. The absolute maximum valueof the tsunami height in this region is 16 m (52.5ft); multiplied by a safety factor of 1.3 it predicts21 m (68.9 ft) for the maximum estimated runupheight for the community of Perryville.
Report of Investigation 2019-3Maximumtsunami height30 m54 50'NScenario 1: MW9.0 earthquake, SAFRR-type event.FalsePassula20insksAlaenaP105UnimakIs.Ikatan Bay32Ikatan Peninsula54 40'N10.6163 15'W163 WMaximumtsunami heightScenario 2: MW9.0 earthquake, maximum slip at 15 - 25 km depth.ksAla30 m201054 50'NFalsePassulainsenaP5UnimakIs.Ikatan Bay32Ikatan Peninsula54 40'N10.6163 15'W163 WMaximumtsunami heightScenario 3: MW9.0 earthquake, maximum slip at 25 - 35 km depth.aksAla1054 50'NFalsePass30 m20sulinenaP5UnimakIs.Ikatan Bay32Ikatan Peninsula154 40'N100.6163 15'W163 WFigure 4. Maximum tsunami heights for scenarios 1–3 in the level 3 grid for False Pass.
Regional tsunami hazard assessment for False Pass and Perryville, AlaskaMaximumtsunami height30 mScenario 1: MW9.0 earthquake, SA
False Pass, Alaska. Photo: Amy Macpherson. State of Alaska Department of Natural Resources Division of Geological & Geophysical Surveys Report of Investigation 2019-3 REGIONAL TSUNAMI HAZARD ASSESSMENT FOR FALSE PASS AND PERRYVILLE, ALASKA E.N. Suleimani, J.B. Salisbury, D.J. Nicolsky, and R.D. Koehler.