Transcription
Downloaded from http://rsta.royalsocietypublishing.org/ on May 31, 2016Tsunami currents in portsJose C. Borrero1,2 , Patrick J. Lynett2rsta.royalsocietypublishing.organd Nikos Kalligeris21 eCoast Ltd, Raglan, New Zealand2 Department of Civil and Environmental Engineering, University ofReviewCite this article: Borrero JC, Lynett PJ,Kalligeris N. 2015 Tsunami currents in ports.Phil. Trans. R. Soc. A 373: ccepted: 22 July 2015One contribution of 14 to a theme issue‘Tsunamis: bridging science, engineeringand society’.Subject Areas:geology, oceanography, civil engineering,ocean engineeringKeywords:port, tsunami, currents, earthquakes,long waves, seicheAuthor for correspondence:Jose C. Borreroe-mail: jocabo@jocabo.netSouthern California, Los Angeles, CA, USATsunami-induced currents present an obvious hazardto maritime activities and ports in particular. Thehistorical record is replete with accounts from shipcaptains and harbour masters describing their fatefulencounters with currents and surges caused bythese destructive waves. Despite the well-knownhazard, only since the trans-oceanic tsunamis ofthe early twenty-first century (2004, 2010 and 2011)have coastal and port engineering practitionersbegun to develop port-specific warning and responseproducts that accurately assess the effects of tsunamiinduced currents in addition to overland flooding andinundation. The hazard from strong currents inducedby far-field tsunami remains an underappreciatedrisk in the port and maritime community. In thispaper, we will discuss the history of tsunami currentobservations in ports, look into the current state ofthe art in port tsunami hazard assessment and discussfuture research trends.1. IntroductionThe Japanese compound word itself (‘harbour/port’ and, tsunami) implies a long-standing and‘wave’intuitively understood recognition of the vulnerability ofport and maritime assets to tsunamis. Indeed, historicalaccounts provide us with many harrowingly descriptivereports of tsunami effects in ports and on ships atanchor. However, most of these accounts are from thenear field and may skew our appreciation for whatconstitutes a hazardous situation in terms of tsunamieffect on ships and or maritime facilities. The line ofresearch discussed here has been motivated due to thefact that tsunami damage is not exclusively caused bysurges that result in coastal inundation. Often maritimefacilities are vulnerable to tsunami-induced effects notaccompanied by flood inducing water levels and whichoccur many hours after the initial tsunami arrival.2015 The Author(s) Published by the Royal Society. All rights reserved.
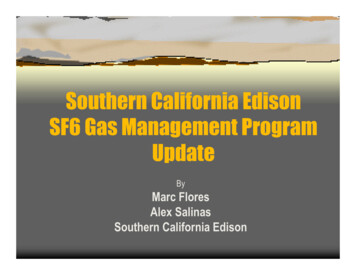
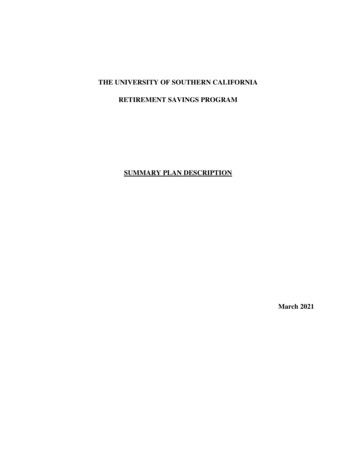
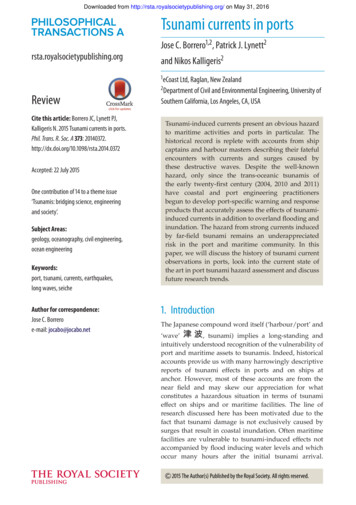
Downloaded from http://rsta.royalsocietypublishing.org/ on May 31, 2016(a)(b)10 000no. shipsmillions of 191019351960year19852010Figure 1. Growth in global ocean cargo tonnage since 1970 (a) and global fleet size since 1910 (b).While this phenomenon has been observed repeatedly in the past, it has not been well studiedin the context of hazard mitigation. This can be explained by the fact that resolving tsunamicurrent speeds with a numerical model is computationally intensive and requires relatively finecomputational mesh sizes resulting in very large numerical grids that require extremely longrun times, making them impractical for many modelling efforts. Furthermore, while there areseveral estimates of current speed based on eyewitness accounts, there is a paucity of quantitativeinstrumental data on tsunami-induced current speeds making model calibration and validationdifficult. Also, recent studies (e.g. [1]) suggest that eyewitness estimates are generally unreliableand tend to overestimate actual current speeds. In recent years, the effects of tsunami currents inports and harbours have been observed and recorded at many locations around the world.2. Growth of the maritime sectorSince World War II, the amount of goods and material shipped globally by sea has growntremendously (figure 1). This is due to several factors, among them population growth,globalization and the shifting of manufacturing centres to Asia. One important factor allowingfor this shift has been the advent of the shipping container. The simple technological shift ofmoving freight in standard-sized containers revolutionized the shipping industry [2], providingcost savings by allowing for goods to be shipped over multiple modes of transport (ship, railand truck) without additional handling. This reduces direct port costs such as storage and labouras well as indirect costs [3]. Since 1910, the number of cargo ships has grown by nearly threeand a half times from just over 30 000 to nearly 104 000 [4]. Besides the growth in shipping, therehas also been tremendous growth, particularly in the USA, of private boat ownership and thenumbers of marinas needed to satisfy the space requirements for on-the-water storage of thesevessels. This growth in ocean cargo, shipping traffic, port capacity and recreational users hassignificantly increased the exposure of these economic sectors to tsunami hazards. Especiallywhen one considers that prior to 2004, a major trans-oceanic, basin wide tsunami had not occurredsince 1964.3. Historic examplesOne of the earliest historical examples of a trans-oceanic tsunami causing damage to ports inthe near and far field is that of the great earthquake and tsunami of 13 August 1868 near Arica,Peru (now Chile). In Arica, an American side-wheel gunboat, the USS Wateree, was at anchorwhen the earthquake struck at 17.05 that afternoon. Commander James H. Gillis reported [5].80rsta.royalsocietypublishing.org Phil. Trans. R. Soc. A 373: 2014037280002100 103oilmain bulk cargoother dry cargototal
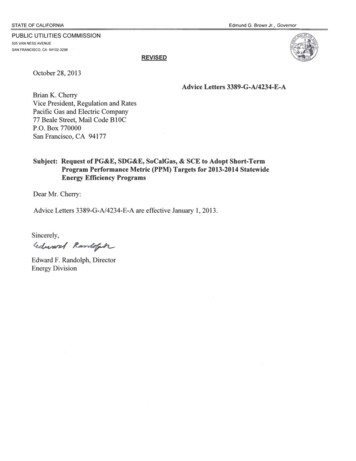
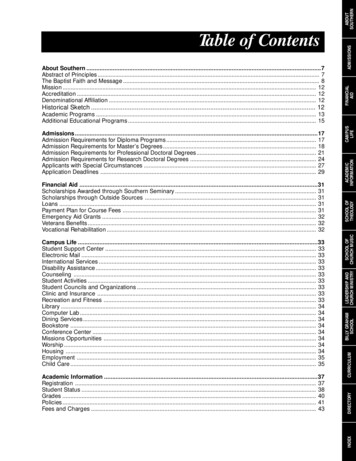
Downloaded from http://rsta.royalsocietypublishing.org/ on May 31, 2016(a)3Figure 2. In 1868, the USS Wateree was at anchor along with several other ships near the location of the present-day port (a).The tsunami waves and surges pushed the ship aground on the beach some 5 km to the north (red dot). The grounded Watereein 1869 (b) and what remains today (c). Image credit: Google Earth (a), US Naval Historical Centre, Murray Greene Day (b) andJose C. Borrero (c).witnessing the complete destruction of the town of Arica from the deck of the Wateree. By 17.20the sea was receding and by 17.32 the first tsunami surge was affecting the ships at anchor.Gillis then reported a tremendous current pulling the ship north and east towards shore. As thissurge retreated, two smaller ships nearby were left grounded and 90 fathoms (165 m) of anchorchain were paid out from the Wateree as she was pulled seaward. After only a few minutes, asecond surge commenced and this time 100 fathoms (183 m) of anchor chain were let out to keepthe Wateree under control. Several smaller surges were reported before a third surge occurredbetween 18.00 and 19.00. As this surge receded, the anchor chain was ripped from the Watereeand the ship was set adrift. The fourth and subsequent surges pushed the Wateree some 5 kmnorth of her initial position where she was eventually grounded at a distance of 430 m inland and3.7 m above the high water mark. All told, only two members of the Wateree crew were killed;however more than 212 men from the 16 ships at anchor in Arica were lost that day [6]. TheWateree was never recovered and to this day its rusting boilers sit stranded in the desert, a vividreminder of the terrible tsunami (figure 2).Sixteen hours later, across the Pacific Ocean, the Arica tsunami arrived in the predawn hoursof 15 August in Lyttelton Harbour, on the east coast of New Zealand’s South Island. Accordingto Gibson [7], the initial withdrawal induced a current of 12 knots (approx. 6.2 m s 1 ) and left.(b)rsta.royalsocietypublishing.org Phil. Trans. R. Soc. A 373: 201403721 km(c)
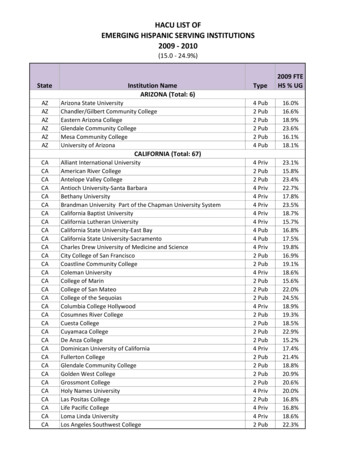
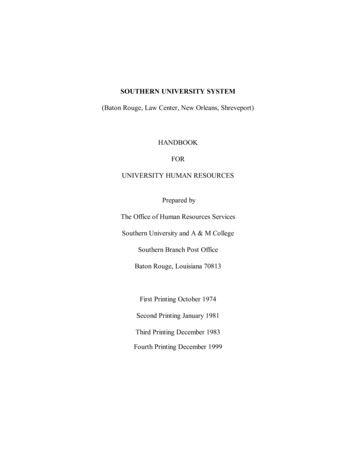
Downloaded from http://rsta.royalsocietypublishing.org/ on May 31, 2016The ketch Margaret, lying on the beach near the Government wharf, had her warps carriedaway, and on the rebound of the wave she was carried into the harbour, where she fouledthe schooner Annie Brown, carrying away her own bulwarks, staunchions, and mainmast,and also doing some damage to the schooner. The schooner Jeannie Duncan was lying at therailway wharf alongside the p. s. Novelty. The former has sustained considerable damage,and the Novelty had her bulwarks and staunchions from the fore to the main riggingdestroyed. The drawback out of the harbour took the Novelty down as far as Gollan’s Baywhere she tried to bring up, but her best bower anchor and chain snapped; by this time,however, she had steam up, and was able to steam against it.Modern reconstruction of the 1868 tsunami at Lyttelton [9] shows that the largest surges occurredduring the falling tide, which may have tempered its effects. It also suggests such an eventoccurring today would result in near total inundation of the Lyttelton Port facilities, potentiallycrippling one of New Zealand most important ports.One year earlier, a large earthquake in the Lesser Antilles caused extreme damage in manyCaribbean ports [10]. In the Port of Saint Thomas, the commander of the USS Susquehanna notedthe formation of a large whirlpool in the centre of the bay, pulling floating debris towards it. TheSusquehanna dropped her second anchor holding her in place, enabling the crew to assist withthe rescue of stranded and damaged vessels. Another nearby US vessel, the DeSoto, was spunaround repeatedly in the receding waves, until finally settling in a large gyre in the centre ofbay, spinning slowly for hours. This account is noteworthy in its description of the large eddiesand whirlpools that are often generated in ports and harbours during a tsunami, and how thesefeatures lead to strong, dynamic and persistent currents.4. Events in the modern era: 1960, 1964, 2004, 2010 and 2011The tsunami of 1960 generated in southern Chile can be considered the first significant transoceanic tsunami in the era of modern port infrastructure and logistics. Sievers et al. [11] vividlyrelate numerous eyewitness accounts as tsunami waves heavily damaged or destroyed opencoast ports such as Ancud, Maullin and Corral in the near field. Notable accounts include quickthinking by crewmen and dock workers at Caleta Mansa, who were working to unload cargowhen tsunami effects began. The ship’s cables were cut leaving stevedores aboard the ship whileothers on the dock and on land ran to nearby high ground. Because of the rapidity with which thiswas done no lives were lost. The ship succeeded in leaving the port even after running aground.The following day, the conditions at Caleta Mansa were sufficiently normal to permit the ships toenter and disembark the stevedores.At Puerto Corral, several ships were lost including the cargo steamer Carlos Haverbeck(figure 3) which, despite having an anchor over the side and engines running at full power,was dragged into the bay by the flooding tsunami currents. The currents then forced the CarlosHaverbeck into a collision with another ship and over a buoy whose lines became fouled in itspropellers. An attempt to secure the ship with the aid of a nearby tug failed as forceful withdrawalof the tsunami surge overcame the Haverbeck’s last remaining anchor line and dragged her out.was surging round the vessels, tearing them from the different wharfs, and breakingtheir warps like twine. It caught the John Knox, barque, and dashed her against thescrew-pile-jetty, carrying away her starboard quarter, and snapping her best bower cable,also the 8-inch hawsers which held her to the wharf.4rsta.royalsocietypublishing.org Phil. Trans. R. Soc. A 373: 20140372areas dry that are normally more than 4.5 m deep at low water. Since the receding water leftseveral ships lying aground they were entirely vulnerable to the returning surge which causeda sea-level rise of more than 7.6 m in approximately 20 min. Newspaper accounts from the timesuggest that vessels in Lyttelton Harbour suffered serious damage where ships were torn fromtheir moorings or driven into the wharves. According to the Lyttelton Times of 17 August 1868(as quoted by Lost Christchurch [8]), the incoming wave:
Downloaded from http://rsta.royalsocietypublishing.org/ on May 31, 20165.towards the open ocean where she ran aground and was stuck until a second wave entered CorralBay. This surge then carried the Haverbeck towards the centre of the bay grounding her on a largesand bank over which she was dragged several times before finally coming to rest. After the firstthree largest surges abated, the crew of the Haverbeck had the opportunity to evacuate the shipon the last remaining tender, transporting 10–12 crewmen at a time to safety. As the last load ofsurvivors were in the process of evacuating at 22.40 (approx. 7 h after the earthquake), a strongcurrent developed that smashed the rescue boat against the Haverback’s hull, forcing them tomake their escape on a small raft. This last group, which included the captain and senior officers,was carried around the bay by the currents until finally running aground at 1.15 on 23rd May,10 h after the ordeal began.The effects of the 1960 Chile tsunami were felt in ports across the Pacific, including NewZealand, California, Hawai’i and other Pacific islands, and Japan. In New Zealand, ports alongthe east coast of the North and South Islands were strongly affected by surges lasting for days.The strongest effects included grounded ships, boat collisions, strong currents and sedimentationand erosion occurring in Whitianga, Gisborne and Lyttelton Harbour [12–14]. In the Hawai’ianIslands, Eaton et al. [15] and Cox & Mink [16] reported on the extensive damage to Hilo harbouron Hawai’i and flooding at Kahului harbour on Maui. In California at the Port of Los Angeles, thetsunami caused 1 million in damage with wave heights estimated to be near 2 m and currentsestimated to be eight knots (4 m s 1 ) in the harbour. Over 800 vessels broke their moorings, mostlysmall craft; 40 were sunk and 200 damaged [17].In Japan, Susaki Port on Shikoku Island suffered damage as overtopping surges flooded atimber storage facility, turning the timbers into floating debris that damaged many structures[18]. Horikawa [19] reported on the effects of the 1960 tsunami in Japan. He noted the differencebetween the effects caused by the 1960 tsunami relative to historical near-field events and relatedthis discrepancy to whether or not a particular location was affected by resonance due to a matchbetween the period of the incident tsunami and the fundamental period of the bay or harbourin question. Horikawa also reported on strong current and scour caused by the Chile tsunamiin Japan. For example at Hachinoe, a current of 10 knots (approx. 5.1 m s 1 ) broke moorings,while at Miyako currents of five to eight knots (approx. 2.6–4.1 m s 1 ) impeded vessel traffic.rsta.royalsocietypublishing.org Phil. Trans. R. Soc. A 373: 20140372Figure 3. The cargo steamer Carlos Haverbeck sunk in Bahia Corral after being battered by surges from the 1960 Chile Tsunami.(Photo: NOAA/NGDC, Pierre St. Amand.)
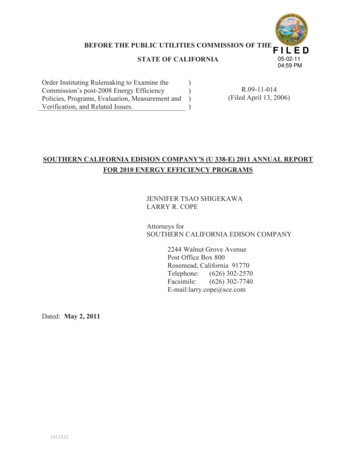
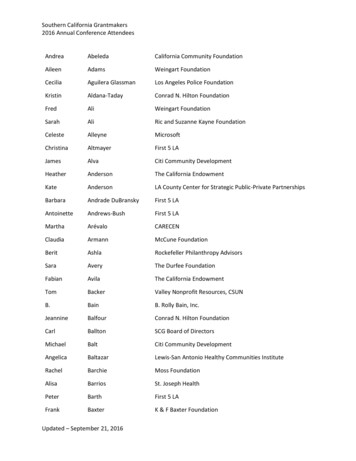
Downloaded from http://rsta.royalsocietypublishing.org/ on May 31, 20166.rsta.royalsocietypublishing.org Phil. Trans. R. Soc. A 373: 20140372Other effects in Japan described by Horikawa [19] include scour around coastal structures leadingto collapse.The great Prince William Sound earthquake of 27 March 1964 [20] generated an extremetsunami in the near field with run-up in excess of 30 m at several sites and a maximum run-up of67.1 m in Valdez [21]. The strongest effects outside of Alaska were focused primarily on northernCalifornia where the port at Crescent City was destroyed and the town water front was heavilydamaged by tsunami run-up of nearly 5 m. However, owing to the location and orientation of theearthquake, the effects in the rest of the Pacific were relatively benign with only Hawai’i reportingsignificant effects [21].More than 40 years had passed when the world was again affected by a major trans-oceanictsunami. Overall, the 26 December 2004 tsunami had a relatively modest impact on ports andshipping in the Indian Ocean although maritime facilities in the near and mid-field (i.e. Indonesiaand Thailand) suffered tremendously. Notable were the extreme devastation of the port facilitiesat Lhok Nga, near Banda Aceh, where the freighter Andalas was capsized at her moorings and a90 m coal barge was deposited on the beach [22]. Also destroyed was Banda Aceh’s principal portfacility at Ulee Lheue where a large area of the working water front suffered co-seismic subsidenceand large-scale scour and erosion by over washing tsunami flow depths of approximately 10 m[22]. Remarkably neither a pile supported ferry wharf nor mooring dolphins for a power barge atUlee Lheue were significantly damaged by the tsunami [18] despite the fact that the barge itselfwas deposited 4 km inland in a residential area. Fritz et al. [23] deduced tsunami flow speeds of2–4 m s 1 at inland sites by using particle tracking and image processing of videos shot in thestreets of Banda Aceh, several kilometres from the shoreline.Sheth et al. [24] reported that no major ports in mainland India were significantly damaged.However, many intermediate and minor ports were strongly affected. In Kerala in the southwest,several smaller ports were affected by sand deposition reducing the available draft for vessels. InTamil Nadu, the fishing port at Chennai suffered serious damage resulting in the deaths of 150fishermen. At the Chennai commercial port, damage was not significant; however, the tsunamibroke the mooring lines of one ship allowing it to collide with two others, causing damage to theships and mooring dolphins. Tsunami-induced sedimentation in the port of Chennai reportedlyrequires 2.5 million in dredging costs [25]. Elsewhere in the Tamil Nadu region, Maheshwariet al. [26] also describe heavy damage at Nagappattinam Port, which remained closed for severalweeks after the tsunami. Severe damage was also reported at Kanyakumari Port but no damagewas reported at Tuticorin, an important port serving the oil and coal industries.In the far-field, during the 2004 Indian Ocean tsunami, three occurrences of ships being tornfrom their moorings were detailed in field survey reports by Okal et al. [27–29]. A 50 m freighterwas torn from its moorings by strong currents that peaked approximately 6 h after tsunamiarrival at Toamasina, Madagascar. Strong currents occurring 4 h after tsunami arrival at Le Port,Reunion Island broke the mooring lines of a 196 m freighter and caused the ship to collide withnearby docks, damaging gantry cranes. And, thirdly, a 285 m freighter whose mooring lines werebroken 90 min after tsunami arrival in Salalah, Oman drifted before being intentionally grounded.Another freighter (292 m) was affected by tsunami currents outside the harbour, colliding with abreakwater and incurring minor damage to the fuel tank.In November 2006, Crescent City, CA, USA suffered the effects of tsunami currents followingan M 8.3 earthquake, with the epicentre located near the Kuril Islands [30]. While tsunamiwarnings were initially cancelled throughout the Pacific due to relatively small wave heights onnear-source tide gauges, continued monitoring suggested that the tsunami could be potentiallydamaging on the US west coast, prompting the issuance of a site-specific advisory for CrescentCity. The tsunami peaked in Crescent City approximately 3 h after arrival with a maximumtsunami height of 1.8 m. While the tsunami did not cause any flooding, the strong currents pinnedfloating docks to their pilings, allowing the water to overtop and causing significant damage,particularly to docks located nearest to the entrance of the inner harbour, where the currents werestrongest. The small-boat harbour, which had been severely damaged during the 1964 Alaskatsunami, was re-built in the early 1970s [30]. The ageing docks and the inadequate piling height
Downloaded from http://rsta.royalsocietypublishing.org/ on May 31, 2016Raichlen [39] described the spectral characteristics of tide gauge records from the 1960 Chile and1964 Alaska tsunamis at several locations on the North American west coast and two Pacificislands. For the 1964 Alaska event, he found that the spectral responses at three Californiasites (Santa Monica, Los Angeles and La Jolla) were roughly similar. He also showed that, atLos Angeles, these peaks were also evident during the 1960 Chile tsunami. Besides the lowfrequency component ubiquitous to these sites for both events, he noted that the higher frequencycomponents at each site were most probably dependent on the geometric specifics of thatparticular location.5. History of tsunami hazard mitigation efforts in modern ports7rsta.royalsocietypublishing.org Phil. Trans. R. Soc. A 373: 20140372(without a cap at the end) allowed some floating docks to be lifted off the pilings, also contributingto the damage.Ports around the Pacific were affected by the trans-oceanic tsunamis of 2010 and 2011. TheMaule, Chile earthquake and tsunami of February 2010 generated strong and damaging currentsin San Diego, Ventura and Santa Cruz harbours. Effects included boats swamped by standingwaves resulting from the interaction between the ebbing tsunami current and incoming swells,docks damaged by strong currents, boaters forced to stay offshore for over 6 h until the tsunamisurges abated, and the breaking free of two large vessels, causing minor damage in collisions withother boats and harbour structures [31].The Tohoku tsunami of March 2011 disrupted maritime activities throughout the PacificOcean. In the near field, port damage was severe throughout the coastline adjacent to the sourceregion, with many ports and marine facilities completely destroyed. Tsunami current speeds of3–10 m s 1 at different stages in the tsunami wave train in Kesennuma Bay were deduced from theanalysis of survivor videos by Fritz et al. [32], who also showed that the current was the strongestduring the latter stages of the outflow phase of the initial wave. The strongest far-field effects andmost severe damage occurred in Crescent City. Very strong currents in the inner harbour resultedin severe damage to docks and to boats that remained in the harbour [1]. Fortunately, most of thecommercial fishing vessels evacuated the harbour before the tsunami arrived and were spared. InSanta Cruz, strong currents, greater than 13 knots (7 m s 1 ), accompanied surges that penetrateddeep into the rectangular harbour basin, the largest of which occurred some 3 h after initialtsunami arrival, causing considerable damage throughout the harbour. At both Crescent City andSanta Cruz significant sedimentation and scour were also reported [33]. In Ventura, it is worthnoting that the strongest and most damaging surges occurred at 01.00 PST on 12 March some15 h after initial tsunami arrival [31]. Additionally, disruptions to maritime activities and damageby tsunami currents were reported in New Zealand [34] and along the east coast of Australia [35]where tsunami waves affected port facilities for up to 2 days. As noted by Borrero & Greer [14], theeffects of the 2011 Tohoku tsunami in California are analogous to tsunamis from South Americaaffecting New Zealand with the orientation and distance between the Japan subduction zonerelative to California being roughly similar to the location and orientation of the South Americansubduction zone to New Zealand. However, the 1960 event notwithstanding, New Zealand lastsuffered the effects of a major South American tsunami in the late 1800s, when New Zealand’sport infrastructure was much less developed than today.Japan’s economy and ability to trade suffered as a result of the extreme level of damage tomaritime facilities and ships as a result of the 2011 Tohoku tsunami. The tsunami reportedlycaused the loss of as many as 1 million shipping containers forcing carriers to react by extendingthe life of older containers and by deploying ships to reposition empties [36]. Preliminaryestimates indicated that the value of damage to building and infrastructure is about 300 billionwhile estimates by the World Bank put the cost of the damage caused by the earthquake andtsunami to Japan’s economy at 122– 235 billion—equivalent to 2.5–4% of the country’s GDPin 2010 [36]. The potential effect on trade even prompted hearings and reports before the USCongress [37,38].
Downloaded from http://rsta.royalsocietypublishing.org/ on May 31, 2016Predicting the behaviour of tsunami-induced currents in ports and harbours requires anunderstanding of how these fast-moving flows interact with coastal infrastructure, such asbreakwaters and wharves (figure 4). While the strongest average currents are likely to beassociated with the resonance modes of a particular harbour [47–50], localized currents may notbe. Such localized currents can be driven by boundary effects, jets and large eddies, and so canbe de-coupled from the forcing, and possibly resonant, conditions. As flows accelerate aroundport structures, boundary shear leads to flow separation which, as the oscillatory waves pass, cancreate transitional turbulent structures, known as coherent eddies or turbulent coherent structures(TCS). These TCS can greatly increase the drag force on affected infrastructure and the ability ofthe flow to transport debris and floating objects. Large TCS are ubiquitous with tsunamis and their.6. Present research directions8rsta.royalsocietypublishing.org Phil. Trans. R. Soc. A 373: 20140372The work of Camfield [40] summarized what was then the state of the art in models andtools for assessing tsunami hazards in ports and harbours, including discussions on calculatingresonant characteristics of irregularly shaped harbour basins (e.g. [41]) and discussion of tsunamiwave interaction with coastal structures and tsunami induced currents. Observations of effects inports from the 2004 Indian Ocean event were used as the backbone for the PIANC [18] documentwhich provided a comprehensive discussion of tsunami basics and port-specific effects. Tsunamidata collected on tide gauges throughout the Indian Ocean from the 2004 event were rigorouslyexamined by Rabinovich & Thomson [42], setting the standard for the examination of deep oceanand coastal tide gauge data and the effect of tsunami excitation on harbour or port resonances.Lynett et al. [43] focus on the generation and significance of tsunami-induced jets and eddiesin harbours. They discussed a number of recent observations of tsunami ‘whirlpools’, and aBoussinesq-type model provided good qualitative agreement with the observations. One of theprimary conclusions of this paper was that numerical dissipation errors, often due to up-winddiscretization of nonlinear advection terms, can greatly influence the generation and evolution oftsunami eddies.With some confidence in a numerical model’s ability to accurately predict tsunami currents ina harbour, it is then feasible to generate current-based hazard maps. Lynett et al. [44] summarizerecent harbour hazard mapping efforts in California. In this paper, a simple correlation wasfound between hindcasted (modelled) currents and observed damage. Damage to harbour assets,such as floating docks and vessels, initiates with simulated currents of three knots (approx.1.5 m s 1 ), and reaches moderate and major damage thresholds at current speeds of six knotsand nine knots (approx. 3.1 and 4.6 m s 1 ), respectively. These thresholds are subjected to manyuncertainties affecting both the engineering capacity of the infrastructure as well as the tsunamiinduced currents themselves. For example, the capacity of a structural component, or the loadit can withstand before failing, is highly dependent on its age and deterioration. Predictions ofcurrents are particularly sensitive to bathymetry data errors and to numerical errors (e.g. [43]).However, the current thresholds of 3/6/9 knots noted above are, on average, good indicatorsof various damage levels. This current–damage connection allows for the generation of damagepotential maps, which can be used for both during-event positioning of vessels as well as longterm planning of harbour infrastructure. Indeed, the work of Lynett et al. [44] is leading to thedevelopment of US national guidelines for maritime tsunami hazard assessment and products bythe National Tsunami Hazard Mitigation Program. Outside of the USA, this approach was usedby Borrero et al. [45] to assess the tsunami hazard at ports in New Zealand.The relationship between current speed, tsunami height and vessel damage was explored indetail by Suppasri et al. [46], who developed detailed loss functions for small vessels using datafrom more than 20 000 small vessels damaged during the 2011 Tohoku tsunami. Their analysisdetermined loss functions for both measured tsunami heights and modelled hindcast currentspeed. They also differentiated the loss functions for sites in the near- and mid-field relative tothe tsunami source. However, their velocity estimates relied on a model subject to the numericaldissipation errors described by Lynett et al. [43].
Downloaded from http://rsta.royalsocietypublishing.org/ on May 31, 20169(b)Figure 5. Overview of the tsunami effects in the Port of Salalah, Oman during the 2004 tsunami. (a) The path of a 285 mcontainer ship, which drifted on the currents in the port for hours after its mooring lines were broken. (b) The numericalrecreation of the event,
The tsunami of 1960 generated in southern Chile can be considered the first significant trans-oceanic tsunami in the era of modern port infrastructure and logistics. Sievers et al. [11] vividly relate numerous eyewitness accounts as tsunami waves heavily damaged or destroyed open coast ports such as Ancud, Maullin and Corral in the near field.