Transcription
10Broad Applications of Multi-ColourTime-Resolved Flow CytometryBen J. Gu and James S. WileyFlorey Neuroscience Institutes, The University of MelbourneAustralia1. IntroductionFlow cytometer has become an indispensable tool used in medical research. After 50 years’development, flow cytometry has been dramatically advanced in its capability andsensitivity. Different refinements of hardware and software have also been developed toaccommodate the diverse applications in biomedicine, biology and chemistry. However, thebasic principle is still the same: as fluorescent particles in suspension pass through one ormore focused laser beams, their fluorescence emission signals are processed in real time(Sklar et al., 2007). The intensity of emission signal is proportional to number of fluorescencemolecules illuminated on the fluorescent particle. This feature also enables kineticmeasurement of fluorescence changes over a certain period of time in a specific subpopulation of particles in suspension, which is known as time-resolved flow cytometry (TRFCM). Considering the speed and throughput of flow cytometry, TR-FCM is particularattractive in studying cellular process of molecule binding, uptake of dye and influx/effluxover a scale of seconds or minutes. Diverse applications are also applied in TR-FCM,including time-resolved fluorescence decay measurement using a pulsed laser (Condrau etal., 1994a; Condrau et al., 1994b), high-throughput high-content screening of air-bubbleseparated samples using the HyperCyt system (Edwards et al., 2001b; Ramirez et al., 2003),and most frequently, real-time cellular kinetics, such as Ca2 influx, intracellular pHchanges, cell morphology and ligand-receptor interactions. These broad applications makeTR-FCM a powerful technique in discovery of cellular functions.In this chapter, we will use studies of the P2X7 receptor as an example of the applications ofTR-FCM in assessing this receptor’s cellular functions in real-time. The P2X7 receptor has aubiquitous distribution in nearly all tissues and organs of the body with the highestexpression in immune cells of monocyte-macrophage origin. The receptor is present as atrimer and its activation by extracellular ATP opens a cationic channel which graduallydilates to a larger pore over tens of seconds. Activation of P2X7 is associated with massiveK efflux which is a cofactor for assembly of the NALP3 inflammasome and secretion ofinflammatory interleukins from myeloid cells. Prolonged activation of P2X7 leads toapoptotic death of the cell. P2X7 also has a function in the absence of its ligand, namely therecognition and phagocytosis of foreign particles in the absence of opsonins (Gu et al., 2010;Gu et al., 2011), and these features suggest that P2X7 and its downstream signallingpathways are important in innate immunity.www.intechopen.com
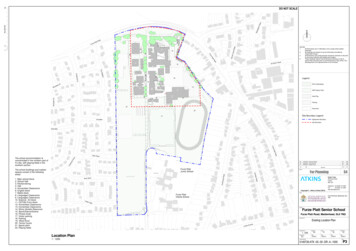
186Flow Cytometry – Recent Perspectives1.1 Equipment required for kinetic flow cytometryThe state-of-art flow cytometry is capable of measuring up to 50,000 events per second. Forkinetic flow cytometry, events are accumulated and averaged over successive time intervals,typically 1 to 10 seconds or longer. Most kinetic studies require addition of an agonist orprobe either to start or during the run, which may take 2 to 5 seconds. This time limitationhas prevented the use of kinetic flow cytometry in studying rapid molecular interactionsoccurring on a time frame of less than one second. Over the last few decades, a number ofon-line injection/mixing devices have been developed to reduce the dead-time to less thanone second. One of these devices is the stopped-flow and coaxial mixing (Nolan & Sklar,1998), another commercially available device is the Time Zero system produced by ml). This device allows precisetemperature control and stirring of cells suspension to which a stimulus (agonist) isdelivered within one second, allowing uninterrupted measurement of cellular response.Fig. 1. A picture of Time Zero module integrated with a FACSCalibur flow cytometerThis Time Zero system is compatible with almost all the BD flow cytometers, as well as oldmodels of Coulter flow cytometer (EPICS, Elite). It consists of two modules, the Time Zeromodule with water-jacket tube holder and the Air Supply module. An additionalcirculating water bath is also needed if temperature control is required. To install thisdevice, the Air Supply module has to be connected to the air pressure system of the flowcytometer via a three-way valve, the sample nozzle has to be connected with a soft tubingand the short tubes (2.5 mL) have to be used instead of regular 5 mL FACS tubes. Thesechanges may take 10-15 min to setup and another 10-15 min to clean up after each run.Since most flow cytometers are shared core facilities, other users may be affected by thesechanges. If subsecond cell response is not crucial for the study, an alternative way is tounscrew the sample platform (takes about 10 seconds) and fit the water-jacket tube holderon the sample bar of a BD flow cytometer (Fig. 1). The Air Supply module is therefore notwww.intechopen.com
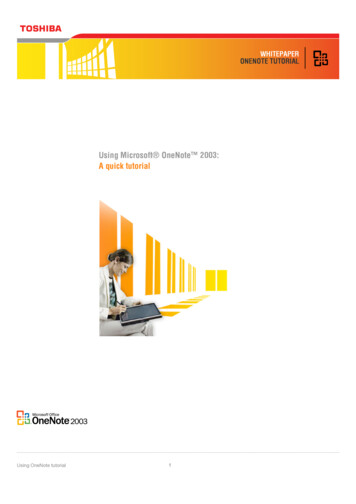
187Broad Applications of Multi-Colour Time-Resolved Flow Cytometryneeded, and regular 5 mL tubes can be used. However, the tube has to be physicallyremoved and replaced after the addition of stimulus, which incurs a delay of 2-5 secondsbefore recording. In either case, a tiny stir bar (1x3 mm) has to be placed in the bottom oftube in order to mix cells. A major advantage of the Time Zero system is the device formagnetic stirring of the reaction cuvette, which maximizes the number of cell-cellinteractions as well as rapidly mixing agonist or probe into the suspension. It is also a goodidea to leave a small amount of water inside the water-jacket tube holder to ensure goodthermal conductivity to the tube.1.2 Quantitation of the kinetic response of cellsLinear Mean ChannelThe two methods used to quantitate the kinetic response are either slope of a curve or areaunder a curve. In general, slope of a curve is more appropriate for rapid linear responseswhile area under a curve is more accurate for non-linear responses. Since most cellularresponses are the results of multiple driving forces, and variations between each intervalsare often seen in flow cytometry, area under a curve may be a better way to describe thequantitative information given by kinetic flow cytometry.a2agonista3a1a0c1c2c3b1b2b3c0b0TimeFig. 2. A schematic illustration of area under a curveTo quantify dye uptake, arbitrary units of area under a curve in a certain time period (anumber of time intervals, n*Δt) after addition of stimulus is calculated (Fig. 2). The basal line(without stimulus) has to be adjusted to the same level as the test line (with stimulusadded). The area under a curve between the basal and test lines is considered as the sum ofn trapezoids (Fig. 2). Therefore, the following mathematical model based on the trapezoidrule is used for the area calculation:a0,a1 an are the linear mean channel values of each interval from the ATP-inducedethidium uptake curve while b0,b1 b60 are those from the basal line, and c0,c1 c60 are thosefrom the adjusted basal line. Therefore,Area(1) 0.5 x (a0-c0 a1-c1) x ΔtArea(2) 0.5 x (a1-c1 a2-c2) x ΔtArea(n) 0.5 x (an-1-cn-1 an-cn) x Δtwww.intechopen.com
188Flow Cytometry – Recent PerspectivesArea 0.5 x Δt x (sum(a0,a1, an-1) sum(a1,a2, an)-sum(c0,c1,.cn-1)-sum(c1,c2,.c60))as c b Δb Area 0.5 x Δt x ( sum(a0,a1, an) sum(a1,a2, an)-(sum(b0,b1,.bn)-(sum(b1,b2,.bn)-2x n x Δb))The area under a curve can then be calculated using a Microsoft Excel function.1.3 Software for kinetic flow cytometryNot many programs are available to process kinetic data from flow cytometry. The bestfreeware is WinMDI, written by Joseph Trotter of The Scripps Research Institute, La Jolla,CA 92037. The latest version of this freeware can be downloaded fromhttp://facs.scripps.edu/software.html. WinMDI is able to calculate the mean fluorescenceintensity (MFI) between defined time intervals. The data can be saved as a Tab separatedtext file which can then be imported by Microsoft Excel. However, WinMDI was originallywritten for Windows 3, and has not been updated. It can only read FCS 2.0 file, and does notrecognize long file names. A brief tutorial for WinMDI by Dr Gérald Grégori can be found fo/images/TutorialWinMDI.pdf. Amore advanced program is FlowJo from the Tree Star Inc. Its kinetic tool can not onlycalculate MFI over time intervals, but also give both slope and area under the curve.The detailed instruction on the kinetic tool can be found at . Despite a number of bugs in this software, it can read FCS 3.0file (a file format used by all latest flow cytometers) and is compatible with both Mac OSand Windows. Another software called Cyflogic (http://www.cyflogic.fi/) also includes akinetic tool (flux trace) in its licensed version (not the free non-commercial version). Cyflogichas a similar interface as WinMDI, and can also recognize FCS 3.0 files.In the following sections, we will use WinMDI to demonstrate how the kinetic flow cytometryanalysis is performed. To use it, first choose “Display Density Plot” on the menu, select thefile, in the popup window “Format 2D Display”, choose “256x256” for “Display ArrayResolution” which gives a better resolution. Left click on the density plot, choose “Regions” tocreate a polygon gate R1 based on Forward Scatter & Side Scatter. Then choose “Display DotPlot” to draw a dot plot of cell marker (e.g. CD14) versus main fluorescence (e.g. Fura-red,ethidium, or YG). On “Format Dotplot” window, choose “All” for “Plot number of events”.Left click on the dot plot, choose “Regions” to create a “SortRect” gate R2 based on the cellmarker and main fluorescence. After the two gates are set, draw another dot plot of timeversus main fluorescence. On “Format Dotplot” window, choose “All” for “Plot number ofevents”, and check “Kinetics mode”, “Overlay kinetics line” and “Draw kinetics only” to drawa kinetics line in the dot plot (KinPlot). Left click on the plot, choose “Gates”, select “And” forboth R1 and R2. Choose the KinPlot window, then choose “File Save as” to save the date to atabed text file. The file can then be imported by Microsoft Excel.2. Ca2 /Ba2 influx with Fura-Red2.1 PrinciplesCalcium influx/efflux is one of the most important cellular processes driven by opening ofion channels/receptors, including the P2X7 receptor. Following activation by extracellularwww.intechopen.com
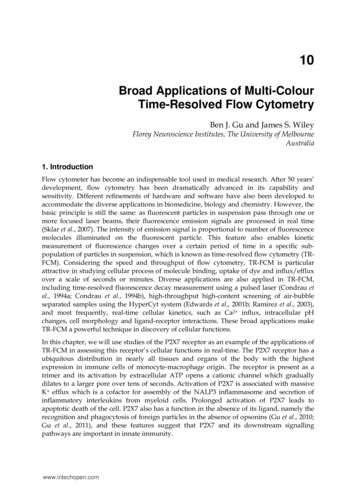
Broad Applications of Multi-Colour Time-Resolved Flow Cytometry189ATP, the P2X7 receptor opens a non-selective cation channel to allow Ca2 influx and K efflux. Many methods have been developed to measure P2X7 function by monitoring thecation flux through the open channel upon receptor activation. The most common ones areelectrophysiological methods (patch-clamp and intracellular microelectrode), which arewidely used in all receptor studies. Fluxes of divalent cations such as Ca2 , Ba2 as well asmonovalent cations such as Rb , Na and Li , have been used to study P2X7 channelfunction either by fluorometry with Fura-2 or with isotopes of these cations. However,interpretation of ionic flux methods requires a homogeneous cell population, while flowcytometric methods are applicable to mixed cell populations. We have developed a timeresolved flow cytometry method to monitor the influx of Ca2 or Ba2 into cells loaded witha fluorescent chelator, Fura-Red. Fura-Red is a fluorescent Ca2 indicator which is excited bya standard argon laser (488 nm) and with emission at long wavelengths ( 660 nm). Thispermits multi-colour analysis of Fura-Red signals in cells tagged with FITC-labelledantibodies using flow cytometry, allowing measurement of P2X7 function in specific celltypes in a mixed cell population. Unlike the other fluorescent Ca2 indicators, fluorescenceof Fura-Red excited at 488 nm decreases once the indicator binds divalent cations such asCa2 or Ba2 (Gu et al., 2001; Jursik et al., 2007).2.2 MethodTo study the Ba2 influx following activation of P2X7 by ATP, mononuclear cells (2x10⁶) areincubated in Ca2 free Na medium (145 mM NaCl, 5 mM KCl, 10 mM Hepes, pH 7.5,supplemented with 0.1% BSA and 5mM glucose) with Fura-Red acetoxymethyl ester (1μg/mL) for 30 min at 37 C. Cells are then washed twice with Na medium (with 1 mM Ca2 )and labelled with FITC-conjugated cell markers for 15 min (CD14 for monocytes, CD19 forB-lymphocytes, CD3 for T-lymphocytes or CD56 for NK cells). These mononuclear cells arewashed once and resuspended in K medium (150 mM KCl, 10 mM Hepes, pH 7.5,supplemented with 0.1% BSA and 5mM glucose) with 1 mM Ba2 at 37ºC. A small magneticstir bar (1x3 mm) is added to the tube before it is inserted into the Time-Zero System. TheFL3 voltage is adjusted to give a linear mean channel fluorescence intensity of 700 for thegated population. No compensation is required between FL1 and FL3. ATP is added 40 seclater. Signals from mononuclear cells are acquired at about 2000 events per second on aBecton Dickinson FACSCalibur flow cytometer and the data comprising forward scatter (logmode), side scatter (log mode), FL1 (log mode), FL3 (linear mode, 1024 channels) and time (2sec intervals) for each event are collected. Digitonin is added at the end of the run toestimate maximum values for Ca2 influx. The data from each run (about 250 sec) is savedinto a listmode file.2.3 Gating and calculationThe listmode file is analysed by WinMDI. Cells are gated by forward and side scatter and bycell type specific antibodies. The linear mean channel of fluorescence intensity (1024channels resolution) for each gated subpopulation (Fig. 4) over successive 2 sec intervals isplotted against time and saved into a text file.The text file is then imported into Microsoft Excel, and the arbitrary units of area above theBa2 influx curve in 20 sec after addition of ATP is calculated using the following functions:www.intechopen.com
190Flow Cytometry – Recent PerspectivesFunction(C5) AVERAGE(C 7:INDIRECT(ADDRESS(D4 5,COLUMN(),4,1),1))(to calculate the average linear mean channel of basal line in the same period before ATP is added intothe test tube)Function(D4) MATCH(0,D 7:D 50,0)(to locate in which interval that ATP is added)Function(D5) AVERAGE(D 7:INDIRECT(ADDRESS(D4 5,COLUMN(),4,1),1))(to calculate the average linear mean channel of basal line before ATP is added)Function(D6) (SUM(INDIRECT(ADDRESS(D4 10,COLUMN()1,4,1),1):INDIRECT(ADDRESS(D4 21,COLUMN()-1,4,1),1)) (D5C5)*10) (SUM(INDIRECT(ADDRESS(D4 11,COLUMN()1,4,1),1):INDIRECT(ADDRESS(D4 20,COLUMN()-1,4,1),1)) (D5-C5)*8)SUM(INDIRECT(ADDRESS(D4 10,COLUMN(),4,1),1):INDIRECT(ADDRESS(D4 21,COLUMN(),4,1),1))-SUM(INDIRECT(ADDRESS(D4 11,COLUMN(),4,1),1):INDIRECT(ADDRESS(D4 20,COLUMN(),4,1),1))(to calculate the first 20 sec area above Ba2 influx curve after addition of ATP)The arbitrary unit of area obtained in Function(D6) is also used to quantify the P2X7 channelfunction. (Excel template is available)Fig. 4. Typical dotplots and gating strategy used to analyse Ba2 influx by Fura-Red in CD14positive monocytes2.4 Notes for techniqueCation influx methods based on Fura-red fluorescence can be applied to kinetic studies inmany channels/receptors which involve Ca2 influx or efflux. In this study, Ba2 is used asa surrogate for Ca2 since cytosolic Ba2 is neither pumped nor sequestered and the Ba2 signal over short times represents the unidirectional influx. Most of the intracellular Ba2 remains in the cytoplasmic region as mononuclear cells lack the mechanisms either topump out intracellular Ba2 or sequester this cation into intracellular organelles. Since P2X7function is greater in Na free and/or Cl- free buffer (Humphreys & Dubyak, 1996; Wiley etal., 1992), isotonic K buffer is used to measure P2X7 function instead of physiological Na buffer.www.intechopen.com
191Broad Applications of Multi-Colour Time-Resolved Flow CytometryIn measurements of Ba2 influx using Fura-red, because of the long wavelength emission ofFura-Red, there is little overlap between FL1 and FL3, and the FL3-FL1 compensation settingcan be ignored. This long wavelength of Fura-Red also limits the interference of yellowcoloured compounds.BasalATP (5650)Ba 2 Influx(Linear MFI of Fura-Red/cell)800600400ATP200Digitonin001234Time (min)Fig. 5. An example of spreadsheet (left) and a typical curve of Ba2 influx into cells (right)3. ATP induced ethidium uptake3.1 PrinciplesA unique feature of the P2X7 receptor observed under physiological conditions is the slowfurther increase in permeability that develops after the initial opening of the P2X7 channel,which is readily studied by flow cytometry (Wiley et al., 1998). Ethidium bromide is aphenanthridinium intercalator which binds both DNA and RNA and is generally excludedfrom viable cells. It has been used previously to assess cell permeabilization by ATP(Gomperts, 1983). Once bound to nucleic acids, the fluorescence is enhanced 20 30 fold. Theexcitation maximum is shifted to 512 nm and the emission maximum is shifted to 605 nm.This long emission wavelength allows simultaneous detection of ethidium influx on theFL2 photomultiplier (570 to 610 nm) in the presence of FITC-labeled antibodies which aredetected on the FL1 photomultiplier (525 nm). Time-resolved flow cytometry generates themean fluorescence intensity of analysed cells over a certain time period. This techniquewww.intechopen.com
192Flow Cytometry – Recent Perspectivesallows a sensitive measurement of the initial rate of ethidium uptake, which is essentiallyunidirectional because of binding of this permeant cation to nucleic acids. By using timeresolved flow cytometry, our group has shown that there is large variation of P2X7 functionamong individuals (Gu et al., 2000) mainly due to genetic polymorphisms which alter thefunction of this receptor (Gu et al., 2004; Gu et al., 2001; Shemon et al., 2006; Skarratt et al.,2005; Wiley et al., 2003)Previous methods used to measure surface P2X7 function have been semi-quantitative andunable to distinguish sub-populations within the overall cell suspension as well as beingunable to distinguish live and dead cells. The two-colour time resolved flow cytometrymethods described here allow quantitative assessment of the abundance of functional P2X7receptors on the surface of different subtypes of leukocytes as well as excluding dead cellsfrom analysis (Gu et al., 2000; Jursik et al., 2007).3.2 MethodMononuclear cells (2x10⁶) pre-labeled with FITC-conjugated cell markers are washed onceand resuspended in 100 μL Na medium with 0.1 mM Ca2 at room temperature. Followingthe addition of 900 μL K medium, a small magnetic stir bar is added to the tube before it isinserted into the Time-Zero System which controls temperature and allows magneticstirring. The FL2 voltage is set at around 595V with a gain of 5.0, at which the linear meanchannel fluorescence intensity for Quantum PE standard beads with MESF 300747 is 48 1(256 linear scale) and the peak channel for right reference standard PE high level beads(MESF 560,000) is 100 1 (256 linear scale). The compensation of FL1-FL2 and FL2-FL1 is 7%and 8% respectively. Ethidium bromide (25 μM) is added, followed 40 s later by addition of1.0 mM ATP. Mononuclear cells are acquired at approximately 1000 events per second by aBecton Dickinson FACSCalibur flow cytometer and the data comprising forward scatter (logmode), side scatter (log mode), FL1 (log mode), FL2 (linear mode, 256 channels) and time (5sec intervals) for each event are collected. The data of each run (approximately 380 sec) issaved into a listmode file.3.3 Gating and calculationThe listmode file is analysed by WinMDI. Cells are gated by forward and side scatter and bycell type specific antibodies (Fig. 6). Cells with maximum ethidium uptake (254 channels orover) are considered as fully permeable necrotic cells and therefore excluded from the assay.The kinetic linear mean channel of fluorescence intensity for each gated subpopulation oversuccessive 5 sec intervals is plotted against time and saved into a text file.To quantify ethidium uptake, arbitrary unit of area under the uptake curve in the first 5min after addition of ATP is calculated. The basal line (without ATP) is firstly adjusted tothe same level as the test line (with ATP added after 40 sec). The area under the ethidiumuptake curve between the basal and test lines is considered as the sum of 60 trapezoids (Fig.1a).The text file is then imported into Microsoft Excel, and the area under the ethidium uptakecurve is calculated using the following functions:www.intechopen.com
193Broad Applications of Multi-Colour Time-Resolved Flow CytometryFunction(C5) AVERAGE(C 7:INDIRECT(ADDRESS(D4 5,COLUMN(),4,1),1))(to calculate the average linear mean channel of basal line in the same period before ATP is added intothe test tube)Function(D4) MATCH(0,D 7:D 30,0)(to locate in which interval that ATP is added)Function(D5) AVERAGE(D 7:INDIRECT(ADDRESS(D4 5,COLUMN(),4,1),1))(to calculate the average linear mean channel of basal line before ATP is added)Fig. 6. Typical dotplots and gating strategy used to analyse ethidium uptake by CD14positive monocytes200BasalATP Ethidium Uptake(Linear MFI/cell)150100ATP500012345Time (min)Fig. 7. An example of spreadsheet (left) and a typical curve of ethidum uptake (right)www.intechopen.com6
194Flow Cytometry – Recent PerspectivesFunction(D6) 2.5*(SUM(INDIRECT(ADDRESS(D4 8,COLUMN(),4,1),1):INDIRECT(ADDRESS(D4 5*12 8,COLUMN(),4,1),1)) SUM(INDIRECT(ADDRESS(D4 9,COLUMN(),4,1),1):INDIRECT(ADDRESS(D4 5*12 7,COLUMN(),4,1),1))-SUM(INDIRECT(ADDRESS(D4 8,COLUMN()1,4,1),1):INDIRECT(ADDRESS(D4 5*12 8,COLUMN()-1,4,1),1))SUM(INDIRECT(ADDRESS(E4 9,COLUMN()1,4,1),1):INDIRECT(ADDRESS(D4 5*12 7,COLUMN()-1,4,1),1))-(D5-C5)*120)(to calculate uptake curve in the first 5 min after area under ethidium uptake curve after addition ofATP)The arbitrary unit obtained in Function(D6) is used to quantify the P2X7 pore function. Timeframe chosen for calculation of ATP-induced ethidium uptake is 5 min. This is simplybecause the linear response after addition of ATP is about 5 min. However, in monocytesfrom some healthy subjects with high P2X7 function, ATP may induce a linear responseonly in the first 2 or 3 min before the fluorescence of cell-associated ethidium reaches themaximum channel number. The calculation model can be readily adapted to shorter timepoints on the ethidium uptake curve. To do this, the time point in above function (5*) canbe replaced by 2*, 3* or 4* for 2, 3 or 4 min respectively.3.4 Notes for techniqueThe peak channel of Standard PE Reference Beads measured on linear mode in FL2 can beas large as 20% from one day to another. Therefore it is essential to calibrate the instrumentdaily before each set of experiments. Furthermore, ethidium concentration, temperatureand the composition of the suspending buffer are critical parameters. The area under theethidium uptake curve increases proportionally with the ethidium concentration up toabout 100 µM. Excess ethidium however might bind to mitochondrial membranes and leadto inaccurate results. Moreover, P2X7 function is dependent on temperature. We haveshown that P2X7 agonists fail to induce ethidium uptake at 12ºC, which is graduallyrestored by a temperature rise up to a physiological value of 37ºC. Results are furtheraltered by the absence or presence of Ca2 , Cl- and Na ions in the acquisition medium.Small amounts of extracellular Ca2 ( 10 μM) in the medium are always included tomaintain cell membrane integrity. However, high concentration of Ca2 may reduce the ATPactivity by binding to its active species, ATP4- or by direct competition for permeation(Wiley et al., 1996). Isotonic K or sucrose media remove the inhibitory effect of Na and/orCl- ions on P2X7 function, which facilitates the detection of differences in P2X7 functionamong individuals. Since multiple factors cause large alterations in the area under theethidium uptake curve, it is essential to keep standardized assay conditions.ATP-induced ethidium uptake is directly proportional to the concentration of ethidiumcation over the range 1 to 100 μM, consistent with permeation of ethidium through adilated pore. 25 μM ethidium bromide is routinely used for measurement of uptakes over a3 to 5 minute time course. The pore formation by activated P2X7 is also sensitive totemperature. P2X7 function decreases at lower temperature while at 12ºC or lower, ATPinduced ethidium uptake is almost completely abolished. It has been reported that removalof extracellular Cl- as well as extracellular Na enhances permeability responses andstimulates the function of the P2X7 receptor (Michel et al., 1999). P2X7 function measured byATP-induced ethidium uptake is greatest in Na free, Cl- free sucrose medium, less in KClmedium, and least in NaCl medium.www.intechopen.com
Broad Applications of Multi-Colour Time-Resolved Flow Cytometry195Leukocyte subtypes are identified by monoclonal antibodies and we observed thatunconjugated anti-CD14, CD3, CD19 or CD16 antibody did not affect ATP-inducedethidium uptake. Thus, with the correct FL2-FL1 compensation, the positively gatedpopulation should give a similar value of area under ethidium uptake curve as thenegatively gated population. While the extremely bright fluorescence of ethidium makesfor accuracy in the uptake measurement, it does make the correct compensation betweenFL1 and FL2 essential. While under-compensation of FL2-FL1 leads to high basal level ofethidium uptake, any over-compensation of FL2-FL1 dramatically reduces the area underethidium uptake curves. Meanwhile, if the FL1-FL2 compensation is too high or too low,the R2 gated population (Fig. 6) will incline towards left or right, respectively. Ethidium uptake can also exclude the necrotic or apoptotic cells from the live cells in the suspension,simply by excluding fluorescent events at the maximum fluorescent channel intensity atzero time which defines the fully permeabilized cells present.4. Phagocytosis of fluorescent latex beads4.1 IntroductionPhagocytosis is a fundamental aspect of the innate immune system which is preserved inspecialized cells of all metazoans. Human monocytes suspended in saline media (withoutserum) rapidly phagocytose a range of foreign particles which are internalized into aphagosome via rearrangement of the actin-myosin cytoskeleton. This innate immunefunction requires recognition of foreign particles by one or more scavenger receptors on themonocyte surface. We have recently shown that an intact P2X7-nonmuscle myosin heavychain IIA complex in monocyte/macrophages can regulate the phagocytosis of a range ofnon-opsonized particles including latex beads, and live and dead Staphylococcus aureus andEscherichia coli (Gu et al., 2010).Technical advances in the assessment of phagocytosis have allowed rapid advances in ourknowledge of molecular interactions associated with engulfment of particles by phagocytes.Confocal microscopy has shown that internal membranes within the cell fuse with plasmamembrane during the course of particle ingestion, and that recycling endosomes are theprimary source of membrane for enlargement of phagocytic cup (Touret et al., 2005). Flowcytometric assessment of particle engulfment has to some extent replaced microscopicobservation (Steinkamp et al., 1982) particularly as the kinetics of uptake of fluorescenttargets by phagocytes can be followed by instruments capable of time-resolvedmeasurements in a stirred cuvette at 37ºC (Gu et al., 2010). These assays of phagocytosis byflow cytometry usually include measurements of fluorescence particle uptake by cells preincubated with cytochalasin D (CytD), an inhibitor of F-actin polymerization and phagocyticcup formation and this control condition allows the assay to distinguish engulfment ofparticles from adhesion. Particle size is also important in flow studies which generallyemploy fluorescent particles ranging from 1 to 3 μm in diameter.Various methods have been employed in phagocytosis studies. However, no publishedmethod reflects the quantitative particle uptake in real time although this parameter isimportant to fully assess the engulfment ability of phagocytes. In this section, we describe aquantitative method to measure the phagocytic ability of human monocytes using timeresolved two-colour flow cytometry.www.intechopen.com
196Flow Cytometry – Recent Perspectives4.2 MethodMononuclear cells (2 106 in 100 μL) are pre-labeled with APC conjugated-anti CD14followed by addition of 900 μL Na medium with 0.1 mM Ca2 with a small magnetic stir bar.The tube is inserted into the Time-Zero System (from Cytek Development, Fremont, CA,USA) which monitors temperature (37ºC) and allows magnetic stirring. 5 to 10 μL yellowgreen carboxylated fluorescent polystyrene latex microspheres (YG bead, 1 µm, fromPolyscience, Warrington, PA) are added 20 sec later. Linear MFI of YG fluorescence iscollected in FL1 (voltage: 380-420, gain: 2.0). Events are acquired at about 1500 events persecond by a Becton Dickinson FACSCalibur flow cytometer. The data of each run arecollected for about 7 min and saved into a listmode file.4.3 Gating and calculationThe listmode file is analysed by WinMDI. Cells are gated by forward and side scatter and bycell type specific antibodies (Fig. 8). The linear mean channel of fluorescence intensity foreach gated subpopulation over successive 10 sec intervals is plotted against time to yieldkinetic data which is saved into a text file.Fig. 8. Typical dotplots and gating strategy used to analyse YG bead uptake by CD14 monocytesTo quantify bead uptake, arbitrary units of area under the uptake curve in first 6.5 min afterad
Fig. 1. A picture of Time Zero module in tegrated with a FACSCalibur flow cytometer This Time Zero system is compatible with almost all the BD flow cytometers, as well as old models of Coulter flow cytometer (EPICS, Elite). It consists of two modules, the Time Zero module with water-jacket tube holder and the Air Supply module. An additional