Transcription
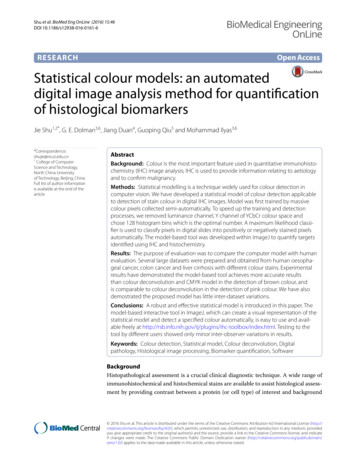
Shu et al. BioMed Eng OnLine (2016) 15:46DOI 10.1186/s12938-016-0161-6BioMedical EngineeringOnLineOpen AccessRESEARCHStatistical colour models: an automateddigital image analysis method for quantificationof histological biomarkersJie Shu1,2*, G. E. Dolman3,6, Jiang Duan4, Guoping Qiu5 and Mohammad Ilyas3,6*Correspondence:shujie@ncut.edu.cn1College of ComputerScience and Technology,North China Universityof Technology, Beijing, ChinaFull list of author informationis available at the end of thearticleAbstractBackground: Colour is the most important feature used in quantitative immunohistochemistry (IHC) image analysis; IHC is used to provide information relating to aetiologyand to confirm malignancy.Methods: Statistical modelling is a technique widely used for colour detection incomputer vision. We have developed a statistical model of colour detection applicableto detection of stain colour in digital IHC images. Model was first trained by massivecolour pixels collected semi-automatically. To speed up the training and detectionprocesses, we removed luminance channel, Y channel of YCbCr colour space andchose 128 histogram bins which is the optimal number. A maximum likelihood classifier is used to classify pixels in digital slides into positively or negatively stained pixelsautomatically. The model-based tool was developed within ImageJ to quantify targetsidentified using IHC and histochemistry.Results: The purpose of evaluation was to compare the computer model with humanevaluation. Several large datasets were prepared and obtained from human oesophageal cancer, colon cancer and liver cirrhosis with different colour stains. Experimentalresults have demonstrated the model-based tool achieves more accurate resultsthan colour deconvolution and CMYK model in the detection of brown colour, andis comparable to colour deconvolution in the detection of pink colour. We have alsodemostrated the proposed model has little inter-dataset variations.Conclusions: A robust and effective statistical model is introduced in this paper. Themodel-based interactive tool in ImageJ, which can create a visual representation of thestatistical model and detect a specified colour automatically, is easy to use and available freely at ex.html. Testing to thetool by different users showed only minor inter-observer variations in results.Keywords: Colour detection, Statistical model, Colour deconvolution, Digitalpathology, Histological image processing, Biomarker quantification, SoftwareBackgroundHistopathological assessment is a crucial clinical diagnostic technique. A wide range ofimmunohistochemical and histochemical stains are available to assist histological assessment by providing contrast between a protein (or cell type) of interest and background 2016 Shu et al. This article is distributed under the terms of the Creative Commons Attribution 4.0 International License (http://creativecommons.org/licenses/by/4.0/), which permits unrestricted use, distribution, and reproduction in any medium, providedyou give appropriate credit to the original author(s) and the source, provide a link to the Creative Commons license, and indicateif changes were made. The Creative Commons Public Domain Dedication waiver ) applies to the data made available in this article, unless otherwise stated.
Shu et al. BioMed Eng OnLine (2016) 15:46tissue. These stains colour the target antigens or proteins, called biomarkers, with different chromogens to visualise them to assist visual microscopic analysis [1].Diaminobenzidene (DAB) is one of the most commonly used stains in immunohistochemistry (IHC); it stains a variety of biomarkers, such as P53 and elastin dark brown.P53 is a tumour suppressor protein expressed predominantly in cell nuclei. Inspecting the distribution of P53, which has been shown to be over expressed in malignanttumours, aids the diagnosis of colorectal cancer [2]. Elastin is the main component ofelastic fibres, usually found in arterial walls. Elastin is also found in the liver and is present a higher density in liver fibrosis and cirrhosis, making it a potentially useful biomarker of the severity of liver fibrosis [3]. A counter-stain, the haematoxylin stain, whichstains the background tissue blue, is normally used a fter DAB staining. Picro-Sirius Red(PSR) is a histochemical stain commonly used to detect fibrosis in liver biopsies [4]. Theconnective tissue matrix is stained red by PSR whilst background liver tissue appears apale yellow colour.Many methods have been used to quantify the stain colour in IHC images [5–7]. However, misdetection is a common problem when two or more chromogens with overlapping absorption spectra are used on one slide [7, 8]. For example, the brown colourpixels were missing from a dark DAB-stained area when the single Y channel in theCMYK model was used for classification [9] (see Fig. 1d). Colour deconvolution (CD)[10], one of the most popular methods, falsely recognized the brown colour pixels inthe dark DAB-stained area as blue colour pixels (see Fig. 1b, c). Colour deconvolutionFig. 1 The previous methods detected stain colour on DAB stained samples. a Column is the original DABstained samples, the upper two samples from WS images and lower two samples from TMA images; b, c columns are the colour deconvolution [10] detected brown and blue colour; d, e columns are the CMYK model[9] detected brown and blue colour in Y and C channelPage 2 of 16
Shu et al. BioMed Eng OnLine (2016) 15:46Page 3 of 16exploits differences in the light absorption spectra of different colour stains, but becauseit is based on a linear light absorption algorithm detection accuracy may be reduced ifthe light is not linearly absorbed by the stain, as is the case with DAB stain [11].In this study we treated the detection of stained pixels as a colour detection problem incomputer vision. Pixels stained a specified colour, positive colour pixels, are consideredas a group of pixels which can be extracted from the background, the negative colourpixels. The method of stain colour detection in digital IHC images proposed here is astatistical colour detection model. A model is created from a huge collection of colourpixels that contains both the positive and negative colour pixels in the image. A maximum likelihood classifier based on statistical models of the positive and negative pixels, is used to classify pixels in digital slides into positively and negatively stained pixelsautomatically.We constructed the model [6] and have demostrated it has high accuracy in detection of DAB stain in colon cancer and PSR stain in liver cirrhosis [5, 7]. In this paper,we first replenished previous experiments by training to get corresponding CD vectorsrather than only using built-in vector. Previous works only presented the evaluation ofcorresponding models, which were trained by corresponding images or mixed images,to colour detection result in each dataset. Thus, we then added many tests to evaluatethe variations of model detecting results across datasets. And finally we compared thedetection result variations between model, trained by images all from another dataset,and corresponding model. The paper is organized as follows: "Methods" section describes how we developed the statistical colour model for staincolour detection. "Softwares" section introduces the interactive tool built in ImageJ. "Experiments and discussion" section describes tests of the model-based tool in several datasets. The results of all these tests demonstrated the robustness and effectiveness of thisstatistical colour detection tool.MethodsStatistical modelThe statistical model presented in [6, 12] has been used for the detection of positiveimmunostain colour. For model construction, the labelled colour pixels are arrangedinto a colour histogram in a specific colour space. For example, in RGB colour space,the pixels are quantized into RGB colour bins. The probability of positive or negative foreach bin is separately calculated as follows.Prob(RGB S) #S[RGB]NSProb(RGB S) #S[RGB]NS(1)In (Eq. 1) S is the positively stained class and S is the negatively stained class, #S[RGB]the number of positively stained pixels with a colour value of [RGB], #S[RGB] the number of negatively stained pixels with a colour value of [RGB], NSthe total number of positively stained pixels and NS the total number of negatively stained pixels.
Shu et al. BioMed Eng OnLine (2016) 15:46Page 4 of 16Maximum likelihoodThe classification of this bin belongs to the target stain or the background is determinedby the maximum likelihood ratio approach.Prob(RGB S) θProb(RGB S)(2)0 θ 1The value of θ is obtained through the experimental results presented in "Experimentsand discussion" section.Colour modelsIt is recognised that Red, Green and Blue (RGB) colour space is not suitable for imageanalysis. One reason for this is that chromaticity information and brightness (luminance) information are mixed together in this colour space, and it is often desirable toprocess chromatic and luminance signals separately. This means that colour detectiontechniques often involve separating the chromaticity signal from the luminance signal.In immunostain detection, it is the chromaticity signal or the colour spectrum that isof interest rather than absolute brightness. The chromaticity signals encode the spectralinformation of the stain and can therefore be used to detect positive staining. From acomputational perspective using a 2D chromaticity space makes it easier to model theprobability density function.r RR G Brg r gg by GR G Bb BR G B(3)r g b2(4)Cb 0.1687 R 0.3313 G 0.5 B(5)Cr 0.5 R 0.4187 G 0.0813 B(6)Prob((rg, by) S) #S[(rg, by)]NSProb((Cb, Cr) S) #S[(Cb, Cr)]NSProb((rg, by) S) #S[(rg, by)]NSProb((Cb, Cr) S) #S[(Cb, Cr)]NS(7)(8)In order to demonstrate that luminance is less important than chromaticity in staincolour detection we tested four colour models, in experiment step one, only some ofwhich used luminance information. The models tested were the RGB colour model, theopponent colour model, the YCbCr model and the CbCr model. In the opponent colour model red–green (rg) and blue–yellow (by) chromaticity signals are derived fromthe original RGB input (Eq. 3). The Cb and Cr chromaticity signals are derived from theoriginal RGB space (Eq. 5). Statistical colour models in the chromaticity space can thenbe constructed (Eqs. 7 and 8).
Shu et al. BioMed Eng OnLine (2016) 15:46SoftwaresInteractive tool in imageJWe developed this colour detection method into a semi-automatic plugin in ImageJwhich could be used to assist with IHC image analysis. The colour detection function isbased on the statistical model presented in "Methods" section ; this allows rapid colourdetection from arbitrary IHC stained slides. This tool was first published in [5], and herewe modified the performance and added built-in models for the detection of stain colourin DAB and PSR stained specimens.Overview of application softwareThe workflow for the interactive tool is presented in Fig. 2. We simplified the workflowin [5] to make it clear. It consists of two phases, the training and detection.Training phaseUsers begin training by selecting a interested colour region (ICR) using a rectangulartool in ImageJ. There are two further components to this visual selection process; selection of the colour of interest and placement of a sliding bar within the scrolling panel,shown in Fig. 3. Background pixels can be filtered out using the sliding bar and appear as255 in the resulting image. A statistical model is constructed from the histogram of theremaining colour pixels, which are quantified and collected. The training phase involvesre-selecting an ICR in multiple training samples to obtain a wide range of shades of thetarget colour. When a new training sample is added the model is re-calculated automatically on the basis of the accumulated histograms.Detection phaseWhen sufficient training samples have been collected, the statistical model created canbe saved for reuse in subsequent detection phases. In the detection phase, the tool allowsFig. 2 Workflow of stain colour detection in the interactive toolPage 5 of 16
Shu et al. BioMed Eng OnLine (2016) 15:46Fig. 3 Stain colour detection in toolbox. This is an illustration of the training phase of colour detection. Theleft image is the original image. The right image is the output image. The colour pixels in the output image arecolours similar to the colours in the selected ROI in the original image. The background pixels are removed byusing the scrolling bar, and are set to be 255 in the output imagethe user to use either the default DAB detection model obtained in our experiment, or asaved user-generated. The selected model can be used to detect similarly coloured stainin IHC images automatically.Experiments and discussionData and three steps testWe proposed three steps experiments to evaluate statistical model and model based tool.Experiments were carried out in three sorts of dataset published in [5, 6]. We will publish these datasets with prepared ground truth online. The purpose of evaluation is comparing the computer model with human evaluation. However, there is no linked patientinformation for each image. We regarded the quantification of stain as quantification ofcolour. Thus, the evaluation was using randomly selected partial of images, in a dataset,to train model and using the rest of the images for testing. The training images were different from the test images.One sort of dataset was obtained from human oesophageal biopsy, one was obtainedfrom human colorectal biopsy, and the other one was obtained from human liver cirrhosis biopsy. Slides come from hundreds of specimen and were prepared in differenttime and scanned using a Hamamatsu scanner. All slides were prepared by NHS TrustNottingham University Hospital. Each whole slide (WS) comes from individual patientand tissue micro array (TMA) slides come from a total of 700 patients [13]. We showthe number of images was used for training and testing in Table 1. These images werePage 6 of 16
Shu et al. BioMed Eng OnLine (2016) 15:46Page 7 of 16Table 1 Number of patients of each datset and the number of images were capturedand used for training and testingPatientsTotal imagesTraining imagesTest images60105060105025/6052048/1891038WSI of oesophageal cancer74TMA of colorectal cancer700PSR stainlivercirrhosis15DAB stainivercirrhosis100used in step two and step three. Whole Slide Images and TMA images, were randomlycaptured from oesophageal cancer dataset and colorectal cancer dataset, respectively.For PSR stained dataset, we separated 15 slides into 60 images with litter overlap regionsand randomly selected 25 images to compromise the experimental dataset. And for DABstained liver cirrhosis dataset, we separated 100 slides into 189 images with litter overlapregions and randomly selected 48 images to compromise the experimental dataset. Theflowchart of carrying out experiments was shown in Fig. 4.Images used in the first step, were captured from whole slides with DAB staining. Weused this dataset to select the colour space, and determine paramenters, such as numberof colour bins and θ. This was already done in [6] and we specified the dataset and brieflydescribed the experimental results in this paper. In step two, slides were prepared withtwo approaches, WS and TMA. Both of them were stained by DAB staining. In this step,we assessed user-independence and detection accuracy as comparing with two previousmethods [5]. Datasets used in step three were stained by PSR staining and DAB staining.This step assessed the proposed model in detecting of different stain colour [5] and thesame stain used on another disease [7]. In this paper, we added tests, in step two and stepthree, to evaluate the variations of detection results among vectors and statistical models. We also added tests to evaluate statistical model in histochemical stain detection andFig. 4 Flowchart of three steps of statistical model test
Shu et al. BioMed Eng OnLine (2016) 15:46compared it with CD method. Each dataset was prepared in different magnification andresolution. We explained them one by one in the following three steps.Step one: testing the tool using different colour modelsDatasetThe data for building the statistical colour models included 20 images with a resolutionof 6720 4200. The models were then tested on another set of 75 images with the sameresolution. Both the training and testing images were captured under 20 magnification. They were randomly captured from 14 whole slides.ExperimentThis semi-automatic tool was first used to label colour-positive pixels manually asdescribed in "Softwares" section from 20 training images. Labeled pixels were collectedand quantized into histogram bins to construct the statistical model based on (Eqs. 1,7 and 8). The ground truth of the test dataset was also prepared manually by using thistool to eliminate all negative colour pixels.The tested colour spaces were listed in "Methods" section. Two spaces which onlyuse chromaticity channels are included: the opponent colour space and CbCr space.It is interesting to note that the CbCr chromaticity space has the smallest number ofoverlapping bins and the experimental results confirmed that this space gave the bestperformance.This indicates that chromaticity is sufficient for accurate colour representation andthat luminance is a distraction when building the model. As mentioned before relying on2D chromaticity signals makes the model simpler, faster to compute and less demandingof memory. The optimal number of histogram bins is 128; this number produced betterresults than 256-bin histograms at a smaller computation cost. Please see more details in[6, 7].Step two: user‑independence of the modelDatasetImages were randomly captured from 74 whole slides and 14 TMA slides. Each TMAslide contained 16 7 cores. We randomly captured 60 images from either kinds ofslide. The training dataset contained 10 WS images with a resolution of 6720 4200 and10 TMA images with a resolution of 5120 4096. Both kinds of images were re-sortedinto three sets of training samples. Each set of training samples consisted of 10 images,such as 10 WS images, 10 TMA images or a mixed set of 10 images (5 WS images and 5TMA images). The test datasets were two datasets comprising DAB-stained WS imagesor DAB-stained TMA images. Both test datasets consisted of 50 images captured under40 magnitude with a resolution of 1680 1050.ExperimentSince the construction of the statistical model is based on collecting colour pixels usingan interactive tool, models constructed by different users may produce different detection results when applied to a given set of images. It was therefore important to evaluatethe robustness of the tool-generated statistical colour detection models. The robustnessPage 8 of 16
Shu et al. BioMed Eng OnLine (2016) 15:46Page 9 of 16of statistical colour models created with the interactive tool was evaluated by measuringdetection accuracy and variations in detection.Four users participated in an experiment investigating detection of the brown colour in DAB-stained IHC images. All four users used the same training dataset to create models using the interactive tool. These models were then tested on the same testdatasets, which were different from the training sets. As users may differ in what coloursthey classify as ’brown’. We calculated their true-positive ratio and false-positive ratioseparately.Each user was required to build three statistical models to detect brown colour. Thecolour pixels used were collected separately from each set of DAB-stained training samples. In this way the four users created 12 models that were automatically generatedfrom the collections of colour pixels they selected using the interactive tool.Models based on TMA training images were tested by TMA test images and modelsconstructed by WS training images were tested by WS test images. The models createdby mixed set of images were tested by both test images. These mentionded tests andresults have been shown in [5, 7]. Here, we added tests to assess the variations of modeltransfer, such as the models constructed by WS training images were tested by TMAtest images and the models constructed by TMA training images were tested by WS testimages.The results obtained are presented as receiver operating characteristic (ROC) curveswith a true positive ratio (TPR) and false positive ratio (FPR) in Fig. 5. These ratios werecalculated from (Eq. 9) ii Dj TjTj i (1 200) i (1 200) FPR TPR (9)GSGSj 1j 1where Tj is the truely detected number of stained positive pixels at intensity level j, GSis the total number of stained positive pixles in ground truth, Dj is the totally detectednumber of pixels at intensity level j and GS is the total number of stained negative pixelsin ground truth. The true-positive and false-positive ratios were cumulatively calculatedin the histogram bins from i (1 200). All 12 models yielded good results, having hightrue-positive ratios and low false-positive ratios. These results showed there were smallvariations between models generated by different users in terms of the true-positive andfalse-positive ratios. For example, for the tests based on WS test images, at a thresholdof 200 (i 200 at Eq. 9), the four user-generated models, either trained by WS or TMAtraining images, all had the true-positive ratio close to 100 % but the false-positive ratiovaried between 7.8 and 8.8 %; for the tests based on TMA test images, they had the truepositive ratio varied between 98.0 and 100 % and the false-positive ratio varied between14.1 and 15.9 %.Step two: comparison of the statistical colour detection method with other methodsDatasetThe dataset used in the comparative study was the same as that used in the robustnessevaluation reported in previous experiment.
Shu et al. BioMed Eng OnLine (2016) 15:46Fig. 5 ROC curves for different user constructed statistical models. The plot at the top left is ROC curves foruser obtained 5 vectors (based on 5 WS images) on 50 WS test images; The plot at the bottom left is ROCcurves for 5 vectors (based on 5 TMA images) on 50 TMA test images; The plot at the top right is ROC curvesfor user constructed statistical models (based on 10 WS images and 10 mixed images) on 50 WS test images;The plot at the bottom right is ROC curves for user constructed statistical models (based on 10 TMA imagesand 10 mixed images) on 50 TMA test images. The horizontal axis is false-positive ratio and vertical axis is truepositive ratioExperimentIn this study we compared the statistical method with two previously developed colourdetection methods in widespread use [9, 10]. All the methods were trained and testedbased on the same datasets, which were prepared from different types of images of IHCstaining. We compared the terms of detection accuracy, separation of stain colours, andvariations between user trained models and vectors.Accuracy of colour detection in DAB‑stained samples The average results from fourusers using the new method were compared with results obtained from colour deconvolution (CD) and CMYK models. The study was conducted in ImageJ. Colour deconvolution was programmed by Landini as a plugin for ImageJ [14] based on the NationalInstitutes of Health Image macro. Instead of using single DAB-stained sample, we trainedthe CD vectors by the same 10 training samples, 5 WS images and 5 TMA images inmixed set, as used in previous experiment. Vectors for brown colour of DAB stain wereobtained through ImageJ Plugin. Each vector was obatined from one training image. Theywere tested by the corresponding test images. The results were shown in Table 2. Theresults with the 10 vectors obtained in this way were much worse than those obtainedwith the built-in H-DAB vector (R 0.26814753, G 0.57031375, B 0.77642715) (seeFig. 5); we therefore used the built-in vector to discriminate the brown colour from thebackground in the evaluation. The CMYK model was also developed in ImageJ based onthe functions mentioned in [15].As shown in Fig. 6, both in WS and TMA datasets, almost methods produced highlyaccurate results. Statistical models with corresponding training images and CD with builtin vector were achieving close to 100 percent true-positive rate. The mean values of the statistical models, achieved the best results over the 50 WS test images, with a false-positivePage 10 of 16
Shu et al. BioMed Eng OnLine (2016) 15:46Page 11 of 16Table 2 10 CD vectors obtained from 5 WS training images and 5 TMA training imagesfor brown colour detectionImagesWhole ig. 6 ROC curves of CD, CMYK, mean value of ST with three sets of training samples. Colour Deconvolution CD, CMYK colour space CMYK, mean value of ST models trained from corresponding images CorrAvg,mean value of ST models trained from mixed training images MixAvg, mean value of ST models trained fromWS (TMA) training images WS(TMA)Avg. The plot at the top shows the ROC curves for CD (red dashed line),CMYK (brown dotted line), the mean value of ST models with corresponding training images (smooth greenline), the mean value of ST models with mixed training images (smooth purper line), and the mean value ofST models with TMA training images (smooth blue line) on 50 WS test images; the plot at the bottom showsthe ROC curves for CD, CMYK and the mean value of ST models with three sets of traning images (WS, Mixedand TMA training images) on 50 TMA test images. The horizontal axis is false-positive ratio and vertical axis istrue-positive ratio
Shu et al. BioMed Eng OnLine (2016) 15:46Page 12 of 16rate of 8.3 %; the false-positive rate 12.0 % for the CD method. The CMYK model had thelowest rate, true-positive rate, 92.9 %. The statistical models also achieved the best resultfor the set of 50 TMA test images, a 14.9 % false-positive rate compared with 16.6 % for theCD method. Again the CMYK model had the lowest true-positive rate, 91.4 %.To clarify these results, we calculated AUROC (area under ROC curve). Table 3 showsthat the statistical colour models produced the best results. CD produced much betterresults than CMYK on both WS and TMA test images. Table 2 also shows that the usergenerated models had varied slightly in terms of detection accuracy. For example, forbrown colour detection, the lowest AUC was 94.6 % and the maximum was 97.2 %.These results indicate that models generated by different users using this tool are allhighly accurate and therefore that the method is robust and fairly user-independent.However, CD method with trained vectors has obvious variations in detection results,especially in detection of DAB stained TMA images, see Fig. 5. The results also showthe mixed models and models constructed not from corresponding training images cangenerate similar results to the models only trained by corresponding training images. Itdemostrates the model constructed by the whole range of colour shades can be adoptedin different datasets obtained from different diseases for the same stain colour detection.Dark stain colour detection Normal brown colour was detected easily and separatedfrom the background by all three methods. Detection of brown coloration in a darkstained slide is more challenging however; the CMYK method undercounted darkbrown-coloured pixels (Fig. 1d, e) whereas CD falsely detected dark brown as the colour blue (Fig. 1b, c). This evaluation of CMYK demonstrated that a colour space-basedmethod performed less accurately in stain colour detection [16]. Classification of multistain colours in colour space may be affected by overlap. The CD method also suffersfrom this problem and the non-linear light absorption of DAB stain. The statisticallybased interactive tool detected dark brown and blue correctly (see Fig. 7).Step three: use of statistical colour models in assessment of human histopathologyDatasetWe prepared two datasets in this experiment, one contained 25 images randomlyselected from 60 images stained with PSR, and the other contained 48 images randomlyTable 3 The AUC values of the ROC curves of 12 models, when false positive ratio equals10 %Whole slideTMAModel (WS) (%) Model (TMA)(%)Model (mix) (%) Model (WS) (%) Model (TMA)(%)Model (mix) (%)User1 97.297.097.195.895.995.9User2 97.297.197.195.895.995.9User3 97.096.994.695.896.696.6User4 1CD93.994.5CMYK86.169.3WS whole slide test images; TMA TMA test images; ST(WS) statistical model constructed on 10 WS training images; ST(TMA)statistical model constructed on 10 TMA training images; Mix statistical model constructed on 10 mixed training images (5WS images and 5 TMA images); AVG average values of four user-detected results; CD colour deconvolution
Shu et al. BioMed Eng OnLine (2016) 15:46Fig. 7 The statistical model detected stain colour on IHC stained samples. a, b columns are the DAB-stainedsamples from WS images; c, d columns are the DAB-stained samples from TMA images; e column is a PSRstained liver cirrhosis sample; f column is a DAB-stained liver cirrhosis sample showing elastin fibrosis. Theimages in top row are original IHC stained images; the images in middle row are model-detected brown orpink colour; the bottom row is model-detected counter stain colour, blue or yellowselected from 189 slides stained with DAB. In the former dataset, we created a statisticalcol
Interactive tool in imageJ We developed this colour detection method into a semi-automatic plugin in ImageJ which could be used to assist with IHC image analysis. The colour detection function is based on the statistical model presented in "Methods" section ; this allows rapid colour detection from arbitrary IHC stained slides.