Transcription
PUBLIC SECTOR TRENDS201823STATE OF THE PUBLIC SERVICE SERIESRICHARD BOYLEDECEMBER 2018FULL COLOUR VERSION (CYMK)
PUBLIC SECTOR TRENDS201823STATE OF THE PUBLIC SERVICE SERIESRICHARD BOYLEDECEMBER 2018FULL COLOUR VERSION (CYMK)
2
CONTENTSPUBLIC SECTOR TRENDSForeword5Selected findings61.Introduction92.The size, cost and inputs of the public sector103.The quality and efficiency of public administration324.Sectoral performance595.Trust, satisfaction and confidence in public administration71Appendix 190Indicators used to make up the Public Administration Quality indicatorDr. Richard Boyle is Head of Research, Publishing and Corporate Relations with the Institute of Public Administration. He has written extensivelyon public service reform and on the evaluation of public services.Stephen Beamish and Jeanne Magnetti provided assistance in preparing a number of the charts for publication.3
4
PUBLIC SECTOR TRENDSFOREWORDThis report examines trends in public sector development and is the tenth in our annual series. The intention is to helpinform the debate on Ireland’s public sector and public administration, and its role in Irish society.Here we try to bring some evidence to bear on the important debate on the future shape, size and direction of the publicsector. Using data gathered from a number of sources, information on the size and cost of the public sector, the qualityof public administration, efficiency and performance, and levels of trust and confidence is presented in a simple butrigorous manner.In the State of the Public Service research series, we seek to provide evidence-informed research and commentaryon key aspects of contemporary Irish public administration. The authors of these reports bring their considerableexpertise and practical knowledge to the topics selected to provide evidence, insights and recommendations to supportfuture development. Our aim is that these reports will not only inform, but also challenge current thinking about how theIrish public service performs. We intend that these short research reports will be of relevance and use not only to publicservants, but also to policy makers and the wider public.Dr Marian O’SullivanDirector GeneralInstitute of Public Administration5
SELECTED FINDINGSThe size, cost and inputs of the public sectorThe quality and efficiency of public administration Average government spending per person was 16,137in 2017. In 2018 the numbers employed in the public servicerose to over 323,000, back above what it was in 2008. As the economy has grown, the proportion of theworkforce working in the public sector has fallen, andis currently just below 15 per cent. Spending on public service pay and pensions continuesto grow. Spending was at 19.5billion in 2018. The proportion of women in senior managementpositions is low in comparison to other Europeancountries. The highest proportion of women on state agencyboards are in agencies reporting to the Departmentsof Education and Skills (46 per cent) and Children andYouth Affairs (45 per cent). Sick leave levels in the defence forces have risen inrecent years, compared to other sectors where theyhave remained relatively steady.6The quality of Ireland’s public administration is seen bybusiness executives as above the European average.Ireland came 7th of the EU28 on this indicator in 2018. On public service values such as independence frompolitical interference, reliability and fairness, Irelandscores well above the European average. People’s view of the provision of public services inIreland have improved and Ireland now ranks just abovethe European average. The public’s view of the quality of education services isabove the European average. Their view of the qualityof health, public transport and childcare is below theEuropean average. Sixty per cent of the public, and just under half ofbusiness users, see the civil service as efficient. Ireland ranks first in Europe with regard to open datamaturity in 2017, up from 18th in 2015.
PUBLIC SECTOR TRENDSSectoral performanceTrust and confidence in public administrationEducation The 2015 OECD PISA survey shows that Ireland has ahigher ranking than the European average in maths,sciences and reading. Levels of trust in government and in parliament areimproving from a very low base. They are now backabove the European average, and growing. Ireland delivers a reasonable level of educationalefficiency when comparing reading and mathsperformance to spending per student across Europe. The opinion of executives that Ireland’s educationsystem meets the needs of a competitive economyremains above the European average.Health Ireland performs well compared to most Europeancountries with regard to life expectancy at birth (81.5years) and healthy life expectancy at birth (72.1 years). Against a ‘basket’ of outcomes assessed by the EuroHealth Consumer Index, Ireland performed around theEU28 average in 2017, slightly down from 2016, when itwas above the European average. Ireland’s hospitals display comparatively high levelsof efficiency compared to other European countrieswith regard to length of stay in hospital. But the rate ofpotentially avoidable hospital admissions is high. Trust in local authorities is now above the Europeanaverage after several years of being below the average. Sixty per cent of the population tend to trust thepublic administration in Ireland. This is just above theEuropean average. Trust in the police has fallen significantly. Satisfaction with the civil service is quite high.Satisfaction with the education system is amongst thehighest in Europe. Satisfaction with the quality of healthcare is below the European average. Just over half of respondents are satisfied with localauthority services, but only a minority of the public seetheir local council as efficient or open and transparent. There were just over 7,000 complaints to Ombudsmanoffices in 2017. Down from a high of just over 8,000 in2014. The number of freedom of information requestscontinues to increase significantly, to just under 34,000in 2017.7
8
PUBLIC SECTOR TRENDS1.INTRODUCTIONThere are no clear or agreed definitions for comparativeranking of public administrations. However, there iswidespread agreement that a number of elements shouldbe included in any assessment: The size, cost and inputs of the public sector. Whilesize, cost and inputs alone are not the sole or evenmain determinants of good public administration,nevertheless in terms of value for money in the deliveryof public services, keeping check on the size, cost andother inputs of the public sector and public service is animportant consideration. The quality and efficiency of public administration.Public administration includes policy-making, policylegislation and management of the public sector. Suchdimensions of public administration are frequentlymeasured by subjective indicators of quality, whichgive a sense of how good the public administration is.There is also an onus on public administration to deliverservices efficiently. Sectoral performance. The delivery of social andeconomic outcomes in an efficient manner is central toan effective public administration. Trust, satisfaction and confidence in publicadministration. The public ultimately must have trust,satisfaction and confidence in the public administrationof a country if it is to be effective.In this study, we examine indicators for each of these fourelements of public administration. Where possible andappropriate, data is included for other European countries,in order to enable comparisons. In addition, where data areavailable, we have provided trend data going back over thelast decade. The intention is to provide a snapshot of trendsin public administration performance in Ireland, to highlightwhere we are doing well, what challenges are present, andwhere improvements can be made.(ECB) international comparison of public sector efficiency1,a study by the Netherlands Social and Cultural PlanningOffice (SCP) of comparative public sector performance2,the World Bank governance indicators project3, theOECD Government at a Glance project4, and an IPA studycomparing public administrations5.A word of caution about data limitationsThe data presented here should be interpreted with greatcare. First, there is the issue of whether the indicators usedto represent public administration provision and qualityreally captures what public service is about. Indicators,by their nature, only give a partial picture. Second, muchof the international comparative data in this report isqualitative data derived from opinion surveys. Some of thissurvey data comprises small-scale samples of opinionfrom academics, managers and experts in the businesscommunity. The survey data is thus limited in terms ofboth its overall reliability and the fact that some surveysrepresent the views of limited sections of the community.Third, the point scores arrived at on some indicators (on ascale from 1–10 for the IMD and WEF data and between–2.5 and 2.5 for the World Bank governance indicators)should not be interpreted too strictly, as there are marginsof error associated with these estimates. Fourth, changesover short periods should be viewed cautiously. Manyof the indicators assessed represent ‘snapshots’ at oneparticular point in time. Small shifts in annual ranking arenot particularly meaningful.In all, when interpreting the findings set out in this paper,these limitations should be borne in mind. In particular,small variations in scores should be interpreted cautiously.These may be no more than random variations to beexpected given the data being used. What is of interest is toidentify broad patterns and trends emerging from the data.In a number of charts, as well as showing Ireland’s ratingrelative to the European Union (EU) averages, the topranked and bottom ranked country as at the time of themost recent data gathering are included for comparativepurposes.In its style and content, the report draws on a number ofefforts to benchmark and compare public sector efficiencyand performance. These include a European Central Bank12345Afonso et al (2003)Social Cultural and Planning Office (2004)See x#homeSee le (2007)9
2.THE SIZE, COST ANDINPUTS OF THE PUBLICSECTORHere we present a range of indicators that show the size,cost and other inputs of the public sector and public service6610In this study, the public service is defined as the public sector minus the commercial state-sponsored bodies.
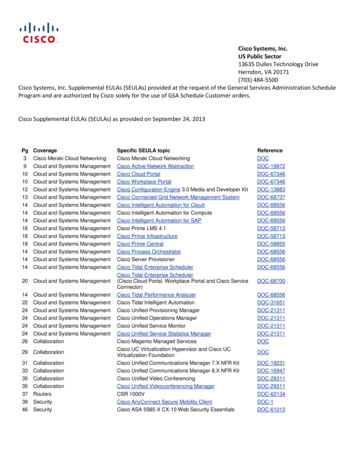
PUBLIC SECTOR TRENDSGovernment expenditure as a share of the economy in Ireland is below the EU28 averageFIGURE 1GENERAL GOVERNMENT EXPENDITURE AS SHARE OF GDP/GNI*Source: 1Ireland2012EU28 A commonly used indicator of public spending inthe economy is expenditure as a percentage of GDP(gross domestic product). From 2008 to 2010, as GDPshrank because of the recession, Ireland’s governmentexpenditure as a percentage of GDP increased rapidly.The particularly large increase in 2010 is mostlyexplained by the impact on government expenditureof specific government support to banks during thefinancial crisis, in the form of capital injections.2013France2014201520162017Ireland GNI* In recent years, the reliability of GDP data for Irelandfor comparative purposes is open to question, due tothe effects of the large scale of multinational companyactivity in Ireland1. In 2017, the Central Statistics Officedeveloped a new indicator, GNI*, or modified GNI(gross national income). Using this indicator, generalgovernment expenditure as a share of the economy isstill below the European average in 2017, at 42 per cent. Since 2011, as spending reductions introduced bythe government came into effect, expenditure as apercentage of GDP had fallen considerably.7John Fitzgerald (2016), Problems with the Irish National Accounts and Possible Solutions, Dublin: Central Statistics Office.11
Government expenditure per head of population remains relatively steadyFIGURE 2GENERAL GOVERNMENT EXPENDITURE PER HEAD OF POPULATIONSource: 7Denmark Expenditure per head of population grew faster inIreland than the EU average up to 2010. The effect ofgovernment support for the banks is clearly visible onthe impact on the figures for 2010. From 2010, generalgovernment expenditure per head fell significantly. From 2013 to 2015 government expenditure per headrose gradually, and was at 16,328 per person in 2015.This is back at the level it was in 2007. Expenditure perhead has since levelled off and is at 16,137 in 2017. Government expenditure per person in Ireland in2017 was the tenth highest in Europe. Denmark,shown on the chart, is one of the highest spenders onthis indicator, while Bulgaria has the lowest level ofgovernment expenditure per head of population in theEU8.812Luxembourg has by far the highest level of general government expenditure per head of population, at 40,178 in 2017, but is atypical. Denmark ismore representative of countries that have a high level of government spending per head of population.
PUBLIC SECTOR TRENDSIrish government expenditure is the most centralised in EuropeFIGURE 3DISTRIBUTION OF GENERAL GOVERNMENT EXPENDITURE ACROSS LEVELS OF GOVERNMENT 2016Source: OECD Government at a Glance Percentage70%Central governmentState governmentLocal governmentSocial security The tasks of government are shared between differentlevels of government. The nature of this share-outvaries markedly between countries. Ireland has the highest share of general gover
FULL COLOUR VERSION (CYMK) FULL COLOUR VERSION (CYMK) TWO COLOUR VERSION PMS: 548CV & 124CV TWO COLOUR VERSION PMS: 548CV & 124CV MONO VERSION MONO VERSION REVERSED VERSION REVERSED VERSION. 2. PUBLIC SECTOR TRENDS 3 Dr. Richard Boyle is Head of Research, Publishing and Corporate Relations with the Institute of Public Administration. He