Transcription
Distributed Processing of Spatial Alarms: A Safe Region-based ApproachBhuvan Bamba , Ling Liu , Arun Iyengar† and Philip S. Yu‡ College of Computing, Georgia Institute of Technology† IBM T.J. Watson Research Center‡ Department of Computer Science, University of Illinois at Chicago{bhuvan,lingliu}@cc.gatech.edu, aruni@us.ibm.com, psyu@cs.uic.eduAbstractSpatial alarms are considered as one of the basic capabilities in future mobile computing systems for enablingpersonalization of location-based services. In this paper,we propose a distributed architecture and a suite of saferegion techniques for scalable processing of spatial alarms.We show that safe region-based processing enables resourceoptimal distribution of partial alarm processing tasks fromthe server to the mobile clients. We propose three differentsafe region computation algorithms to explore the impactof size and shape of the safe region on network bandwidth,server load and client energy consumption. Concretely, weshow that the maximum weighted perimeter rectangular saferegion approach outperforms previous techniques in termsof performance and accuracy. We further explore finer granularity safe regions by introducing grid-based and pyramidbased representation of rectilinear polygonal shapes usingbitmap encoding. Our experimental evaluation shows thatthe distributed safe region-based architecture outperformsthe two most popular server-centric approaches, periodicand safe period-based, for spatial alarm processing.1. IntroductionLocation is becoming an essential communication capability for people to get connected and informed in thewireless and mobile Internet era. Pervasive use of wireless devices, such as smart phones, PDAs and continuedprice reduction of hardware capable of location sensingand positioning (e.g., GPS, Bluetooth, WiFi) has led to anincreasing number of wireless and mobile devices equippedwith both positioning capability and communication as wellas computation capacity. According to [1], the market forGPS devices is growing at around 20% annually with 90%of the devices being portable navigation devices. By endof 2012, mobile phones equipped with GPS are expectedto have around 78% of this market. This makes distributedcomputing at the edge of the wireless and mobile Internetan attractive alternative for performance optimization andenergy saving.Spatial Alarms. Most of us use time-based alarms toremind us of the arrival of a future reference time point;spatial alarms extend the concept of time-based alarms byreminding us of the arrival of a future spatial location ofinterest. The service request “alert me when I am withintwo miles of the dry clean store near my house” is a typicalexample of spatial alarms. A spatial alarm is defined by threeelements: a future location reference known as the alarmtarget, an owner who is the publisher of the alarm and thelist of subscribers of the alarm. We categorize spatial alarmsbased on two criteria: the publish-subscribe scope of thealarms and the motion characteristics of alarm targets andalarm subscribers. According to the publish-subscribe scopeof spatial alarms, we consider three categories of alarms:private, shared and public. Private alarms are installed andused exclusively by the publisher. Shared alarms are installed by the publisher with a list of authorized subscribersand the publisher is typically one of the subscribers. Publicalarms are usually installed with the purpose of sharing themwith all mobile users who are entering the spatial regions ofthe alarms. Mobile users may subscribe to public alarms bytopic categories or keywords, such as “traffic informationon highway 85 North” or “Zagat survey of top-rankedlocal restaurants”. Public alarms can be useful means ofinforming subscribers about hazardous road situations orheavy road congestion. Without loss of generality, the restof the paper assumes that public alarms are subscribed toby all mobile users. According to the motion characteristicsof the alarm target and alarm subscriber, we categorizespatial alarms into three classes: (1) moving subscriber withstatic target, (2) static subscriber with moving target, and (3)moving subscriber with moving target.Challenges of Spatial Alarm Processing. Spatial alarmprocessing requires meeting two demanding objectives: highaccuracy, which ensures zero or very low alarm misses, andhigh scalability, which requires highly efficient processing ofspatial alarms. Existing research on spatial alarm processinghas been focused on either client-centric [2] or servercentric [3] architectures. A client-centric architecture islimited to supporting only private alarms on static target withmoving subscriber or on moving target with static subscriber.This is primarily because other types of spatial alarms require continuous position updates from other mobile clients,which is typically obtained through server-based coordination. In contrast, the server-centric architecture can supportall types of spatial alarms and perform alarm processingoptimizations. However, with increasing number of users andinstalled spatial alarms in the system, the alarm processing
server may become a bottleneck.Paper Scope and Contributions. In this paper, we arguethat client-centric and server-centric architectures are not optimal in terms of developing a general framework for scalingspatial alarms-enabled location services. We propose a saferegion-based distributed architecture for scalable processingof spatial alarms. We show that our distributed architecture,powered by safe region techniques, can significantly aidscalability, by reducing the amount of unnecessary alarmevaluations required in the server-centric architecture, whilemaintaining high accuracy. Our approach offers three uniquefeatures. First, we introduce the concept of safe region inthe context of spatial alarm evaluation. Second, we presentthe design of a distributed alarm processing partitioningscheme for scaling spatial alarm processing. Our approachoptimizes conventional server-centric alarm processing byadvocating mobility and locality aware distribution of alarmprocessing through the safe region-based evaluation framework. More concretely, we compute a safe region for eachmobile subscriber or moving alarm target at the server.We further utilize our distributed partitioning scheme toencourage controlled participation of mobile subscribers insafe region monitoring. By distributing the processing ofspatial alarms in a controlled fashion between the serverand mobile clients, our safe region-based distributed architecture significantly reduces the number of unnecessaryalarm evaluations, increasing the throughput and scalabilityof the system. Last but not the least, we develop a suite ofsafe region computation techniques to analyze the impactof the size and shape of safe region on the client-servercommunication cost, server load and client energy consumption. Concretely, we describe three safe region computationtechniques: (i) Maximum Weighted Perimeter RectangularSafe Region, (ii) Grid Bitmap Encoded Safe Region, and(iii) Pyramid Bitmap Encoded Safe Region. These alternativemethods for safe region computation provide flexible supportfor mobile clients with heterogeneous capabilities in termsof CPU, network bandwidth and energy capacity.In order to validate the effectiveness of our distributedarchitecture and the safe region-based techniques for scalingspatial alarm processing, we perform experimental comparison of our approach with two popular spatial alarm evaluation approaches: periodic evaluation and safe period-basedalarm evaluation. Periodic evaluation can be performed bychecking whether a mobile subscriber is entering the spatialregion of any of its relevant alarms. High frequency isessential to ensure that none of the alarms are missed.Though periodic evaluation is simple, it can be extremelyinefficient due to frequent alarm evaluation and the high rateof irrelevant evaluations. The safe period-based approach [3]allows the system to overcome the deficiencies of periodicevaluation by adaptively computing a safe period for eachmobile subscriber; no alarm processing needs to be performed for the mobile user before its safe period expires.However, safe period computation heavily relies on futuremotion estimation of the mobile user. Our experimental evaluation shows that distributed safe region-based processingoutperforms both periodic and safe period-based approaches,while ensuring 100% accuracy.2. System OverviewIn this section, we describe the concept of safe region,outline our distributed safe region-based partitioning schemeand introduce a grid-based model used to restrict the saferegion computation costs. Concrete safe region computationtechniques are described in subsequent sections.2.1. Safe RegionThe use of safe region for distributed processing of spatialalarms is based on a simple observation: regardless of thetotal number of relevant spatial alarms for a user, onlyalarms that are set on objects near her current positionhave a probability of being triggered. We show that thesafe region approach to spatial alarm processing enablescontrolled distribution of alarm processing load betweenthe server and a selection of mobile users. Such distributedprocessing can significantly enhance server scalability withnominal resource consumption at the client end.We can formally characterize the concept of safe regionfor a given mobile user s, denoted by Ψs , as follows: (i)As long as the user’s position lies within its safe region, theprobability of the user s entering any of its relevant spatialalarm regions is zero. (ii) If the user position lies insideone or more relevant spatial alarm regions, the intersectionof the spatial alarm regions forms the safe region for theuser s. In this case, the probability of any alarms otherthan those associated with this safe region being triggeredis zero. In summary, as long as a mobile user s resideswithin its computed safe region, no spatial alarm evaluationis necessary.The main idea underlying our distributed architecturedesign is twofold. First, we want to use the concept of saferegion to reduce the amount of unnecessary alarm monitoring and alarm checks as the mobile subscribers travel onthe road. Second, we promote the distribution of safe regionbased alarm monitoring by the mobile clients; each mobileclient determines by itself whether it has moved outside itssafe region without requiring global knowledge of relevantspatial alarms and the positions of objects of interest. Animmediate advantage of our safe region-based distributedarchitecture is significant savings in terms of server load andcommunication bandwidth. The main challenge in the designof our distributed architecture is the development of saferegion computation techniques that can provide a carefultrade-off between server load and client energy consumptionby taking into account: (i) the bandwidth required to communicate the safe region from the server to its correspondingmobile client, and (ii) the computation cost at a mobile clientfor monitoring its position with respect to the safe region.In summary, safe region computation must satisfy the
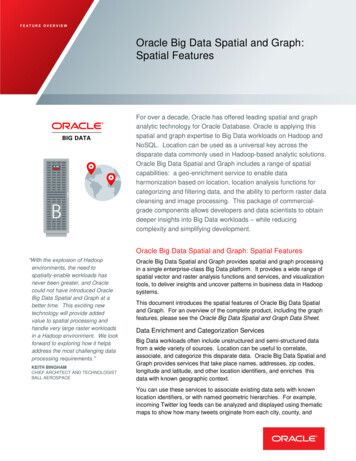
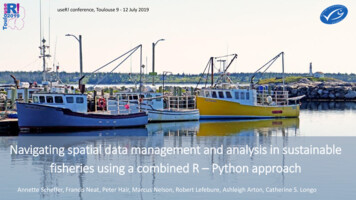
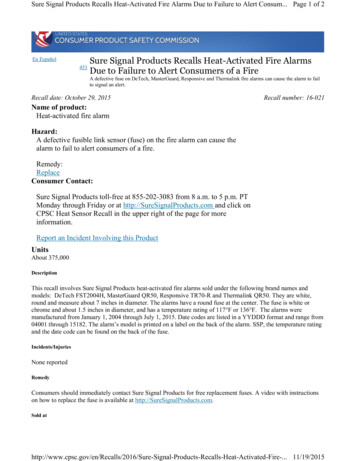
Rr(Ф)ls(t)0.25z 2z 4z 80.2Ф0.150.1ls(t’)(a) Steady Motion Assumption0.05-pi-pi/20pi/2pi(b) Motion Probability DensityFigure 1: Preliminaries for Safe Region Theoremfollowing constraints:Lightweight Construction. Safe region computation shouldinduce a low processing overhead at the server as thiscomputation may need to be performed frequently for largenumber of mobile users.Compact Representation. The safe region should have acompact representation as it needs to be communicatedback to the user resulting in consumption of downstreambandwidth. A rectangular safe region is suitable in terms ofmeeting this requirement.Fast Containment Check. Mobile users need to monitortheir position within the safe region almost continuously. Asimple and fast containment check will enable the clients toperform this function with low energy consumption.Device Heterogeneity. Mobile devices are known by theirdiversity in terms of resource capacity. Safe region computation techniques should be flexible and adaptive to computational heterogeneity of devices.These requirements motivate us to design three alternativesafe region techniques and study the impact of size and shapeof safe region on server load, network bandwidth and clientenergy consumption.2.2. Grid Overlay for Safe Region ComputationThe goal of introducing safe region-based alarm evaluation is to enable the system to focus the processing on alarmsthat are in the vicinity of the mobile subscribers’ currentlocations. In order to effectively support this objective, weuse a grid structure overlaid on top of the Universe ofDiscourse considered by the system. Figure 3(a) shows thecurrent grid cell of mobile user s. Though, using the currentgrid cell of a mobile user as its safe region is simple, whenthe number of intersecting spatial alarms is large, the useof this grid cell as safe region is too costly. Not only is thecost of communicating the large number of spatial alarmsto the mobile user high, but the computational cost of themobile client monitoring its position with respect to the saferegion also increases dramatically. Therefore, we dedicatethe next two sections to present algorithms that control thecomplexity of the size and shape of safe regions, making saferegion-based processing truly attractive for scaling spatialalarm processing.3. Maximum Weighted Perimeter RectangularSafe RegionThe safe region approach aims to reduce the number ofalarm evaluations performed by the server. A rectangularshape has many properties required of the safe region asmentioned before. In this section, we discuss the maximumweighted perimeter rectangular safe region computationapproach and present a safe region computation algorithmbased on the concept of dynamic skylines [4].Figure 1(a) displays a mobile user s at position ls (t);assume that ls (t ) is the previously recorded position of theclient. The probability density function (pdf) for the clientmotion inside the safe region, denoted by p(φ), is given by: y π/2 φ 1 z y/z · π , if π/2 φ π/2 2πp(φ) y φ π/2 1 z y/z · π , otherwise2πIn the above pdf formula, y, z are parameters of steadiness such that y/z 1. Figure 1(b) displays the pdf fory 1 and for different values of z. The value of y/zdetermines the weight to be assigned to the probability ofthe client moving in the direction of its current motion. zdetermines the granularity of change in φ for which theprobability value decreases. As shown in Figure 1(b), theprobability of the client moving in a direction such that 0 φ π/z is the same; for values of φ π/z, this probabilitydecreases. Assuming random direction of motion would leadto a probability of 1/2π for all values of φ.We now present an algorithm to compute the maximumweighted perimeter safe region for a user. Our algorithmapplies the concept of dominating point and appropriateheuristics to find the four skyline points [5] which form thecorner points of the rectangular safe region. The algorithmaccepts the current position vector l s for a user s and thecurrent grid cell G(l s ) in which the user s resides as inputs.The set of relevant alarms intersecting the grid cell G(l s ) areconsidered for safe region computation. In case there areno relevant alarm regions intersecting the grid cell G(l s ),the entire cell is returned as the safe region. Otherwise,the algorithm proceeds in the following four steps outlinedbelow. We refer readers to [6] for a complete description ofthe algorithm.Step 1: Determine Candidate Point Set. The algorithmpartitions the cell G(l s ) into four quadrants with currentsubscriber position {ls .x, ls .y} as the origin. We define aset of candidate points (C) and a set of tension points (T )for each quadrant. The candidate point set is the set of pointswhich can potentially form a corner point of the safe region.Concretely, the set of candidate points is determined asfollows. First, the spatial region corner for each relevantalarm is selected as a candidate point in its appropriate
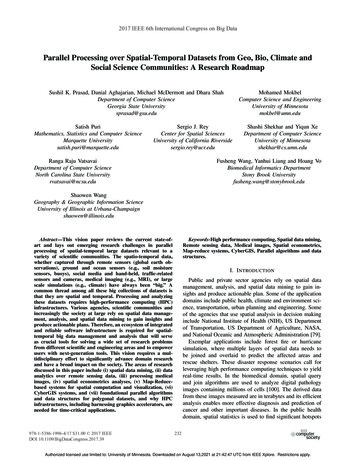
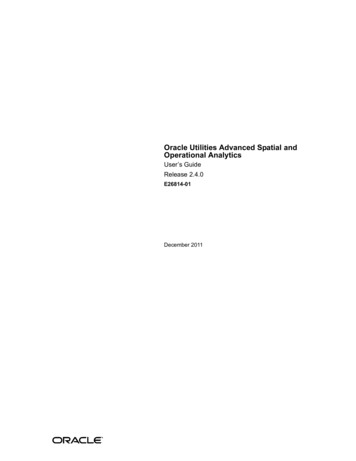
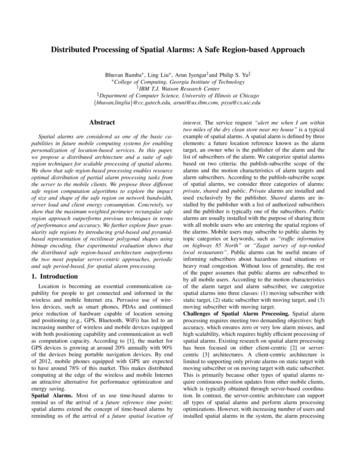
IIIC23C34C33IIIC22 C21 C11 C12 C13s C42C32 C41C31C14C43 C44(a) Candidate Point SetIVIIIT22 T21T33T32III T31T11sT12T42IIIT22T43T41T33IV(b) Tension Point SetIII T31IIIT22T12θsT33T43T41IV(c) Component RectanglesT12sθT43IIIIV(d) Final Safe RegionFigure 2: Maximum Weighted Perimeter Safe Region Computationquadrant. The algorithm trims the set of candidate pointsin the next step. We remove points which fully dominate1any other point in C. Finally, the points are sorted accordingto increasing distance of their x-coordinate from the origin.Step 2: Determine Tension Point Set. Tension pointsare selected from the set of candidate points. In this step,we process the set of candidate points in the followingmanner to obtain the set of tension points. Each tensionpoint TQi , where Q {1, 2, 3, 4} represents the quadrantthe point belongs to, is assigned the same x-coordinate asthe corresponding candidate point CQi . TQi is assigned thesame y-coordinate as that of CQi 1 , or TQi 1 if TQi andTQi 1 have the same x-coordinate.Step 3: Determine Component Rectangles. The set oftension points form the opposite corner (opposite to theorigin) of the set of candidate component rectangles ineach quadrant. The final safe region is composed of theintersection of the component rectangles from each quadrant.Step 4: Determine Safe Region from Component Rectangles. Computation of the maximum weighted perimeter saferegion can be involved and can lead to expensive computations. As opposed to an optimal solution which enumeratesevery possible combination of component rectangles andcomputes the weighted perimeter for each combination thustaking quartic time, our approach performs greedy decisions.We first select the quadrant in which the pdf value of theexpected motion of the object is maximum. The componentrectangle with the largest weighted perimeter in this quadrantis selected. Quadrants are further selected dependent onthe distribution of motion pdf values in the quadrant. Ateach step, the component rectangle which forms the saferegion with the largest weighted perimeter is selected. Thealgorithm continues until all four quadrants are processedusing this greedy heuristic.Figure 2 shows an example of our safe region computation approach. The candidate point set (black dots) forthe given scenario is as shown in Figure 2(a). Figure 2(b)displays the set of tension points obtained from the candidatepoint set as explained in Step 2. Figure 2(c) displays thecomponent rectangles formed by selecting a few of thetension points. The shaded region, as shown in Figure 2(d),forms the final safe region.1. P1 is said to fully dominate P2 , if P1 .x P2 .x and P1 .y P2 .y.4. Bitmap Encoded Safe Region ComputationCompact representation of rectangular safe regions leadsto low server-to-client communication cost and fast containment detection at the client end. However, the rectangularshape restriction is not optimal in terms of maximizing thesafe region area. For mobile clients with high computationalcapacity, we can provide safe regions of finer granularity,more precisely, safe regions of larger size and more complexin shape.In this section, we relax the rectangular shape restrictionand consider rectilinear polygonal representations for saferegion. We introduce bitmap encoded safe region (BSR)techniques for quickly and efficiently representing rectilinearpolygons using bitmaps. This approach provides flexibilityin safe region computation by providing larger, complexsafe regions for powerful clients, thus personalizing thesafe region for each client according to its computationalcapacity. Recall Figure 3(a), which displays the grid cell forsubscriber s with four relevant intersecting alarm regions.One approach is to use the grid cell (minus spatial alarmregions) as the safe region for the client and communicate itto the client. This approach forces the server to communicatethe current grid cell and all relevant alarms overlapping withthe grid cell to the mobile client. Each alarm region may berepresented by the bottom-left and top-right corner points.This approach can be considered optimal since it maximizesthe size of the safe region by communicating to the client thecomplete knowledge of all alarms in its vicinity. However,this approach may be cost prohibitive in terms of server-toclient communication cost and computation cost incurred atthe client in presence of large number of relevant alarms. Forexample, for areas with high alarm density the server maypush a large number of alarms onto the client which wouldlead to heavy load for weak clients. To counter this problem,we develop the concept of bitmap encoded safe regions,which provides an estimation of the actual safe region usinga bitmap, allowing for trade-off between the size of thebitmap and the accuracy of safe region representation.Definition 1: A bitmap encoded safe region represents asafe region Ψs for subscriber s using a bitmap B. A bitvalue of 1 indicates that a predefined region (cell) belongsto the safe region; whereas a 0 bit indicates the negation.We first describe a Grid Bitmap Encoded Safe Region(GBSR) computation technique and exhibit its inability to
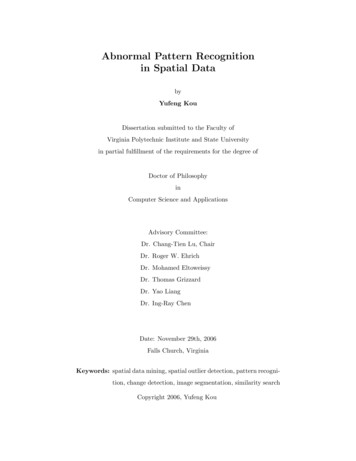
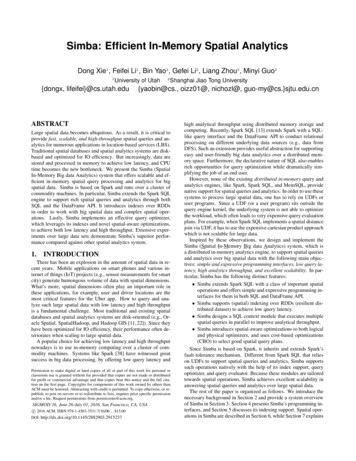
R(S,A1)sR(S,A2)Ps0 0 00 1 10 1 a) Grid CellBITMAP CODING 0111110001 BITMAP CODING 0 000011010(b) Grid Bitmap Encoding (3 3)(c) Grid Bitmap Encoding (9 9)0 0 00 1 10 1 01000111111000111001 1 1 0 0 0 11 1 1 0 0 0 11 1 1 0 0 0 111111 1 101 1 001 1 0BITMAP CODING 0000011010 111001001(d) Pyramid Bitmap EncodingFigure 3: Bitmap Encoded Safe Region Computationaccurately and efficiently represent safe regions. An extension to this approach using the pyramid data structure [7],referred to as the Pyramid Bitmap Encoded Safe Region(PBSR) approach, allows us to represent safe regions accurately as well as efficiently. BSR techniques exhibit thefollowing advantages: (i) for low alarm density regions, it allows for further reduction of alarm evaluations compared tothe rectangular safe region approaches, (ii) it supports varying granularity of safe region computations thus supportingheterogeneity among client capabilities, and (iii) clients candetermine their position with respect to the safe region usinga predefined worst-case number of computations.4.1. Grid Bitmap Encoded Safe RegionThe safe region for a subscriber s can be represented bythe set of grid cells as shown in Figure 3(b).Proposition 2: We use a grid bitmap scheme to representthe safe region within the grid cell shown in Figure 3(a).The α β cell Ci,j is represented by a single bit B(Ci,j ).If Ci,j Σmk 1 R(s, Ak ) , we set B(Ci,j ) 1 denotingthat the entire cell Ci,j belongs to the safe region Ψs , elsewe set B(Ci,j ) 0 and split Ci,j into U V smaller equisized cells. The same encoding procedure is used for eachsmaller cell.Figure 3(b) shows the safe region representation for thesafe region of Figure 3(a) using a bitmap encoding scheme.No alarm regions intersect the three shaded cells whichare represented by 1’s; other cells intersecting with alarmregions are represented by 0’s. The safe region is representedusing a simple bitmap B 0000011010 which representsthe cell bit values in a raster scan fashion. The first zero bitcorresponds to the entire cell, indicating that the cell does notbelong to the safe region and has intersecting alarm regions.As visible from Figure 3(b), this bitmap encoding is able torepresent only a small portion of the grid cell thus providinga poor estimate of the actual safe region. Figure 3(c) presentsa 9 9 split of the cell at a finer resolution which allows formore accurate representation of the safe region. However,this approach is inefficient for the following two reasons:(i) it unnecessarily uses a much larger bitmap than requiredto represent the safe region, and (ii) different regions havedifferent alarm densities thus making it difficult to select auniform grid cell size. The PBSR approach overcomes thesedeficiencies by allowing for more accurate representations ofthe safe region while providing a smaller bitmap size.4.2. Pyramid Bitmap RepresentationThe pyramid representation splits cells in the base gridL) 0 only into U V smaller cells,(level L 0) with B(Ci,jwhere αU α/U , βV β/V , where U, V are a systemdefined parameters. The process may be further repeatedfor several iterations to form smaller cells at each level thusforming a pyramid data structure of height h. Figure 3(d)shows the safe region calculation using a pyramid structure0with h 2. By splitting cells with B(Ci,j) 0 into a3 3 grid we obtain a much finer granularity and thus moreaccurate representation for the safe region. Compared to thegrid-based approach which either does not represent the saferegion accurately (3 3 grid in Figure 3(b)) or computes amuch larger bitmap (9 9 grid in Figure 3(c)), the PBSRapproach provides flexibility in computation of the saferegion. For example, the GBSR approach requires 82 bits,1 bit for the entire cell and 81 bits for the 9 9 grid, torepresent the safe region in Figure 3(c). In comparison, thePBSR approach requires only 64 bits, 1 bit for the entirecell, 9 bits for the cells at level 1 and 54 bits for the cellsat level 2, to represent the same safe region as shown inFigure 3(d).We omit the algorithm for safe region estimation usingPBSR due to space constraints and refer interested readersto our technical report [6]. However, a brief outline ofthe procedure is given below. The pyramid representationof the base cells is constructed for height h by splittingcells iteratively into U V cells. This step is performedoffline by the server thus providing a precomputed pyramidrepresentation for safe region computation. Next, startingfrom the base cells (level L 0) we determine if each cellintersects any relevant alarms. Cells not intersecting with anyL) 1relevant alarm regions are assigned a bit value B(Ci,jindicating that they are a part of the safe region; else a cellis assigned bit value 0. For cells at each level L 1 (L h)which have an assigned bit value 0, we consider the relevantU V children cells at Level L and assign a bit value 0 or1 considering intersection of the cell with relevant alarms ateach level of the pyramid.Proposition 3: The PBSR approach for safe region computation allows us to represent the safe region Ψs in terms ofa bitmap of size B . The height of the pyramid h allows us
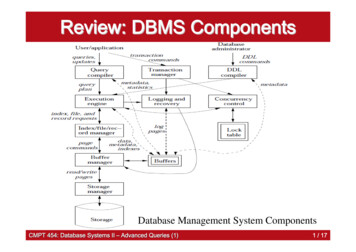
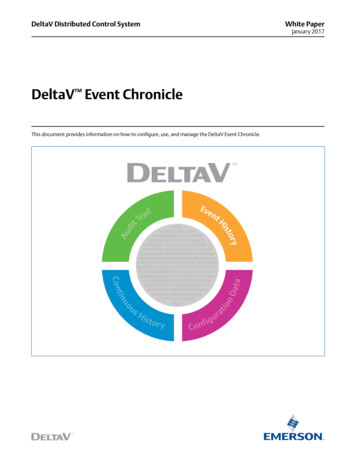
y 1,z 4y 1,z 1615y 1,z 320.41.7521.737 1.735 1.7330.6251.6291.608 1.607 1.6061.111.5091.488 1.485 1.4842.51.4181.395 1.391 1.39101.3821.348 1.343 1.34Time (minutes)Cell SizeNon –(sq. km.) WeightedAlarm ProcessingSafe Region ComputationTotal Processing10500.4 0.625 1.11 2.510Grid Cell Size (sq. km.)(a) Number of Client-to-Server Mes- (b) Server Processing Time forsages (in millions)Weighted Perimeter Approach (y 1,z 32)Figure 4: Performance of Rectangular Approachto control the accuracy of representation of the safe regionat the cost of computing a larger bitmap for more accuraterepresentations.We define Coverage and Bitmap Size which allow usto control the quality of the safe region representation forour BSR computation techniques. The coverage of a saferegion representation Ψs , denoted by η(Ψs ), is definedas the ratio of area of the safe region using the PBSRrepresentation to the area of the grid cell. The bitmap sizefor safe region Ψs is defined as the number of bits in thePBSR representation of the safe region. In practice, wewant to achieve high coverage with as small bitmap size aspossible. Each client may specify the maximum height ofthe pyramid used by the PBSR approach for computing itssafe region. In the worst case scenario, the client may needto determine its position relative to the safe region at eachlevel of the pyramid data structure. We refer readers to ourtechnical report [6] for a detailed description of safe regioncontainment detection algorithm which performs pyramidbitmap decoding to obtain a geometrical shape of the saferegion.For the PBSR approach, safe region for a client needsto be recomputed only when the client moves out of thebase grid cell. Note that a client may move out of its saferegion without triggering any relevant alarms even while itis inside the grid cell. No safe region recomputation needsto be performed in such situations for the PBSR approach.In case the client triggers an alarm on moving outside itssafe region but stays within the base cell corresponding tothe safe region, the safe region can be quickly updated byconsidering the triggered alarm to be a part of the saferegion. Additionally, PBSR approach can be optimized byprecomputing the bitmap at each level for public alarms.5. Experimental EvaluationIn this section, we evaluate the performance of our saferegion computation techniques using three different setsof experiments. The first set of experiments performs anevaluation of the maximum weighted perimeter rectangularsafe region approach. The second experiment evaluates thebitmap encoded safe region (BSR) approaches, namely gridbitmap encoded safe region (GBSR) and pyramid bitmapencoded safe region (PBSR). The final experiment providesan evaluation of the safe region techniques compared toperiodic processing (PRD), safe period-based (SP) computation [3] and the optimal (OPT) approach as describedin beginning of Section 4. The optimal approach doesnot consider any restrictions on resource availability andassumes all relevant alarms within the grid cell are pushedto the client, which implies the client is fully aware ofall relevant alarms in its vicinity. We measure the performance of all approaches on different evaluation metrics likenumber of client-to-server messages, downs
A spatial alarm is defined by three elements: a future location reference known as the alarm target, an owner who is the publisher of the alarm and the list of subscribers of the alarm. We categorize spatial alarms based on two criteria: the publish-subscribe scope of the alarms and the motion characteristics of alarm targets and alarm .