Transcription
Oracle Utilities Advanced Spatial andOperational AnalyticsUser’s GuideRelease 2.4.0E26814-01December 2011
Oracle Utilities Advanced Spatial and Operational Analytics User’s Guide, Release 2.4.0E26814-01Copyright 2000, 2011, Oracle and/or its affiliates. All rights reserved.This software and related documentation are provided under a license agreement containing restrictions onuse and disclosure and are protected by intellectual property laws. Except as expressly permitted in yourlicense agreement or allowed by law, you may not use, copy, reproduce, translate, broadcast, modify, license,transmit, distribute, exhibit, perform, publish, or display any part, in any form, or by any means. Reverseengineering, disassembly, or decompilation of this software, unless required by law for interoperability, isprohibited.The information contained herein is subject to change without notice and is not warranted to be error-free. Ifyou find any errors, please report them to us in writing.If this software or related documentation is delivered to the U.S. Government or anyone licensing it on behalfof the U.S. Government, the following notice is applicable:U.S. GOVERNMENT RIGHTSPrograms, software, databases, and related documentation and technical data delivered to U.S. Governmentcustomers are "commercial computer software" or "commercial technical data" pursuant to the applicableFederal Acquisition Regulation and agency-specific supplemental regulations. As such, the use, duplication,disclosure, modification, and adaptation shall be subject to the restrictions and license terms set forth in theapplicable Government contract, and, to the extent applicable by the terms of the Government contract, theadditional rights set forth in FAR 52.227-19, Commercial Computer Software License (December 2007).Oracle America, Inc., 500 Oracle Parkway, Redwood City, CA 94065.This software or hardware is developed for general use in a variety of information management applications.It is not developed or intended for use in any inherently dangerous applications, including applications whichmay create a risk of personal injury. If you use this software or hardware in dangerous applications, then youshall be responsible to take all appropriate fail-safe, backup, redundancy, and other measures to ensure its safeuse. Oracle Corporation and its affiliates disclaim any liability for any damages caused by use of this softwareor hardware in dangerous applications.Oracle and Java are registered trademarks of Oracle and/or its affiliates. Other names may be trademarks oftheir respective owners.This software or software and documentation may provide access to or information on content, products, andservices from third parties. Oracle Corporation and its affiliates are not responsible for and expressly disclaimall warranties of any kind with respect to third-party content, products, and services. Oracle Corporation andits affiliates will not be responsible for any loss, costs, or damages incurred due to your access to or use ofthird-party content, products, or services.
ContentsContentsPreface. -iiiAudience . -iiiRelated Documents. -iiiTypographical Conventions. -ivChapter 1Overview Of Oracle Utilities Advanced Spatial and Operational Analytics . 1-1Application Requirements. 1-1Oracle Utilities Advanced Spatial Analytics Fundamentals . 1-2General Data Warehousing Concepts . 1-2Capturing Changes In Source-Data . 1-5Chapter 2Getting Started .Accessing Oracle Utilities Advanced Spatial and Operational Analytics .Logging In.Logging Out.Using Oracle Utilities Advanced Spatial and Operational Analytics .About the Home Page.Using the Main Menu.Using the Dashboard Elements.2-12-12-12-22-22-22-22-3i
ii
PrefaceThis guide describes how to perform basic tasks using Oracle Utilities Advanced Spatial andOperational Analytics. The guide also identifies and describes the technical requirements to usethe product, the architecture, and the user interface.AudienceThis guide is intended for all users of Oracle Utilities Advanced Spatial and Operational Analytics.Related DocumentsFor more information, see the following documents: Oracle Utilities Advanced Spatial and Operational Analytics Installation Guide Oracle Utilities Advanced Spatial and Operational Analytics Quick Install Guide Oracle Utilities Advanced Spatial and Operational Analytics Administration Guide Oracle Utilities Advanced Spatial and Operational Analytics Release NotesOracle Utilities Business Intelligence Documentation Library: Oracle Utilities Business Intelligence Quick Install Guide Oracle Utilities Business Intelligence Installation Guide Oracle Utilities Business Intelligence DBA Guide Oracle Utilities Business Intelligence User's GuideSee Also: Oracle Utilities Business Intelligence V2.4.0 Server Administration Guide Oracle Utilities Application Framework V4.1 Business Process Guide Oracle Utilities Application Framework V4.1 Administration Guideiii
Typographical ConventionsThe following typographical conventions are used in this document:ivConventionMeaningboldfaceBoldface type indicates graphical user interface elements associatedwith an action, or terms defined in text or the glossary.italicItalic type indicates book titles, emphasis, or placeholder variables forwhich you supply particular values.monospaceMonospace type indicates commands within a paragraph, URLs, codein examples, text that appears on the screen, or text that you enter.
Chapter 1Overview Of Oracle Utilities Advanced Spatialand Operational AnalyticsOracle Utilities Advanced Spatial Analytics provides spatial and non-spatial analytics for OracleUtilities Customer Care and Billing, Oracle Utilities Network Management System, Oracle UtilitiesMeter Data Management, Oracle Utilities Work and Asset Management, and Oracle UtilitiesMobile Workforce Management data.Oracle Business Intelligence Enterprise Edition built-in metaphors are utilized to display nonspatial information in tables, bar graphs, pie charts, and gauges. For spatial analytics, Oracle MapViewer technology is integrated with Oracle Business Intelligence Enterprise Edition to displayevents, weather data, and other information that is geographically related.Application RequirementsThe following table lists the system requirements necessary to access Oracle Utilities AdvancedSpatial and Operational Analytics.System/SoftwareRequirementBrowserIE 7.xIE 8.xFirefox 3.6.x (OBIEE only)Operating System(Client)Windows XP SP3Windows 7Operating System(Server)AIX 6.1 (64-bit)Oracle Enterprise Linux 5.5 (64-bit)Red Hat Enterprise Linux 5.5 (64-bit)Sun Solaris 10 (64-bit)Windows 2008 Server SP2 (32-bit)Application ServerWebLogic 10.3.5DatabaseOracle 11.2.0.2StandardResolution1280 x 1024Overview Of Oracle Utilities Advanced Spatial and Operational Analytics 1-1
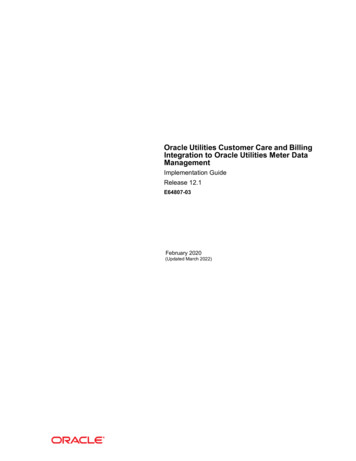
The following table lists down the supported source applications for Oracle Utilities AdvancedSpatial and Operational Analytics.Source ApplicationRequirementOracle Utilities Customer Care & Billing2.2.02.3.1Oracle Utilities Network ManagementSystem1.91.101.11Oracle Utilities Work & Asset Management1.9Oracle Utilities Meter Data Management2.0.1Oracle Utilities Mobile WorkforceManagement2.1.0Oracle Utilities Advanced Spatial Analytics FundamentalsThis section describes fundamental Oracle Utilities Advanced Spatial Analytics concepts. SeeOracle Utilities Advanced Spatial and Operational Analytics Administration Guide for a recommendedapproach to designing and setting up Oracle Utilities Advanced Spatial Analytics.General Data Warehousing ConceptsThere is a great deal of theory and jargon that is unique to the data-warehousing world.Sometimes, just coming to grips with this theory can be overwhelming. The topics in this sectionsummarize this theory and explain how it has been implemented in Oracle Utilities BusinessIntelligence.Data WarehouseThe Oracle Utilities Business Intelligence data warehouse is a separate database from youroperational database(s). This database is organized into a variety of star-schemas that contain dataextracted from applications.The following points describe the main uses of the Oracle Utilities Business Intelligence datawarehouse: Its data structures are designed to be easily accessible by end users for their reporting needs. Large volumes of data can be retrieved quickly. This allows for the fast rendering of thegraphics that show key performance indicators (KPIs).You can add additional star schemas. Oracle Utilities Business Intelligence is delivered withstar schemas and graphics which suit data from various Oracle applications. Using developmenttools you can add additional star schemas and graphics.Star SchemaAll data that is extracted from your production system and transferred to the Oracle UtilitiesBusiness Intelligence data warehouse is held in "star schemas". A star schema is nothing morethan the shape of the tables that hold a given type of factual data from your production system.Consider the following entity relationship diagrams (ERD).1-2 Oracle Utilities Advanced Spatial and Operational Analytics User’s Guide
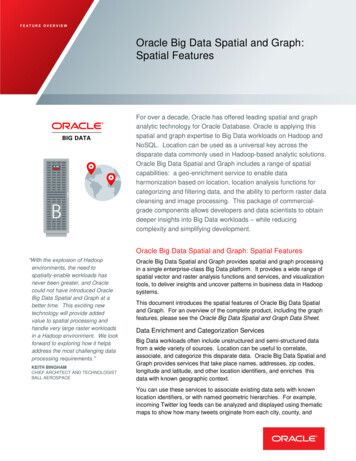
The first figure shows the relational tables holding financial information in an operationaldatabase. The second figure shows the star schema that holds the equivalent data in a datawarehouse.The tables in a star schema are divided into two categories: facts and dimensions. Every starschema has a single fact table (at the center of the star) and one or more dimensions.Fact tables contain individual rows for every occurrence of a fact in the production system. Facttables contain columns called measures. It is these columns that are aggregated to calculate keyperformance indicators (KPIs). Refer to User Defined Measure (UDMs) for more informationabout measures.Dimension tables are used to "slice" the facts in different ways. For example, the star schemaabove would allow users to "slice" the financial fact by the attributes on the 6 dimensions linked toit. Refer to User Defined Fields (UDFs) for more information about "slicing" facts usingdimensional attributes.Cube Star Schema. Some refer to star schemas as "data cubes" due to their multi-dimensionalnature (but cubes imply there are only 3 dimensions and most star schemas support more than 3dimensions). The Fact ERD shown above implies that the Financial fact has 6 dimensions; inreality, it has more.Contrast the operational database's ERD with that of the star-schema. Notice that the operationaldata structure has very "deep" relations (i.e., it has many levels of one-to-many's). Contrast this tothe depth of a star-schema. Notice that a star schema is only one-level deep. This is no accident.Star-schemas are meant to be simple in structure to allow simple access paths.A separate star-schema is maintained for every "fact" held in a data-warehouse. A fact is a recordof an event that occurs in your operational system. For example, one fact might exist to recordevery bill and payment; whereas a different fact might exist to record every purchase order.Extract-Transform-Load (ETL)The star schemas in a data warehouse are populated via a series of programs that do the following: Extract data from an operational system source system(s) Transform the data to suit the data warehouse Load the data into the warehouse's star schemasOverview Of Oracle Utilities Advanced Spatial and Operational Analytics 1-3
Collectively, these programs are referred to by the acronym ETL. ETL programs are supplied forevery fact and dimension in Oracle Utilities Business Intelligence. The following diagram providesan overview of these programs and how they are executed:Extract ProgramsThe extract programs execute in the operational database (as they are extracting operational data).A separate extract program is used for every distinct fact and dimension.All extract programs extract their data into flat files. The flat files serve as input to Oracle UtilitiesBusiness Intelligence.Transform ProgramsThere are no programs dedicated to the transformation effort. This is because extract programsperform some transformation activities, while the load programs perform others.Load ProgramsThe flat files produced by the extract programs serve as input to the load programs. The loadprograms use this data to populate the star schemas in the data warehouse.While any data warehouse product can be used to build the star schemas, Oracle Utilities BusinessIntelligence uses Oracle Warehouse Builder to perform this task. Oracle Utilities BusinessIntelligence is supplied with all of the metadata necessary to transform the extracted data and loadthe data warehouse.Materialized ViewsFact tables typically contain many rows. In order for the queries to perform adequately, the factsmust be summarized.While OLAP (online analytic processing) servers are designed to perform this task, werecommend a less costly approach - use "materialized views" to hold your summarized analyticdata.Materialized views are SQL statements whose results are saved on the database. Whenever thedatabase receives an SQL statement that is the same (or similar) to a materialized view, it retrievesthe data from the materialized view rather than performing the joins against the base tables. If youdo not create materialized views to summarize your analytic data, the database must summarizethe facts "on the fly" and this may have an adverse impact on performance. In other words,materialized views allow your end-users to have good response times.Standard Materialized Views are provided in the Oracle Warehouse Builder metadata, and refreshprocess flows are provided that can be used to update materialized views after data is loaded into afact table.1-4 Oracle Utilities Advanced Spatial and Operational Analytics User’s Guide
The amount of time it takes to create materialized views is dependent on the number of rows inyour facts and the variety of options in your zones. However, the payback can be large aswhenever users need to access this data, the summarization of large volumes of data is obviated(i.e., response times will be fast). Note, materialized views only have to be generated after the datain the warehouse has changed (i.e., after having ETL'ed new operational data), and the existingprocess flows refresh the materialized view in incremental mode, so only new data will be added tothe materialized views after a load.If the associated materialized views do not get rebuilt after loading the data warehouse with newfacts data, the associated materialized views will become "stale". The database will not use "stale"views and will have no choice but to summarize the facts "on the fly" if a query is received thatrequires this data (i.e., response times will be slower).Capturing Changes In Source-DataEvery production database table used to populate the data warehouse must be monitored forchanges so that these changes can be reflected in the data warehouse. Triggers insert a row intothe Change Log when the source tables change in Oracle Utilities Customer Care and Billing.Other edge apps, including Oracle Utilities Network Management System and Oracle UtilitiesWork and Asset Management have built in functionality that identifies changed data, which maynot make use of the Change Log table. For Oracle Utilities Meter Data Management and OracleUtilities Mobile Workforce Management, OUAF Business Objects are used to identify changedrecords, and this functionality may be used in future versions of the other edge apps.Assuming that no extract changes are made, the product triggers in the edge apps do not have tochange. However, if data is extracted from other tables, then triggers may need to be updated oradded to capture the required data customizations.Overview Of Oracle Utilities Advanced Spatial and Operational Analytics 1-5
1-6 Oracle Utilities Advanced Spatial and Operational Analytics User’s Guide
Chapter 2Getting StartedOracle Utilities Advanced Spatial and Operational Analytics comprises a set of answers anddashboards that are built on top of Oracle Business Intelligence Enterprise Edition and OracleUtilities Business Intelligence v2.4.0.This guide contains information that is specific to Oracle Utilities Advanced Spatial andOperational Analytics and does not cover common end user tasks for Oracle Business IntelligenceEnterprise Edition and Oracle Utilities Business Intelligence. See Related Documents for a listof all available documents and the product library to which each document belongsAccessing Oracle Utilities Advanced Spatial and OperationalAnalyticsThis chapter explains how to perform the basic login and logout tasks.Logging InTo access Oracle Utilities Advanced Spatial and Operational Analytics, you use a URL, a user ID,and a password provided through your implementation. To login into the application, follow thisprocedure:1.Type the URL into the address field on your browser (for example, http://hostname:port/analytics). The Oracle Utilities Advanced Spatial and Operational Analytics Sign In screenappears.2.Type your user ID and assigned password.3.Check the language displayed in the Select a Language drop-down box. By default, Englishis selected and the text displayed in the application appears in English. Choose a differentlanguage depending on your requirement.Note: The dashboard analyses display translated text only if a customer haspurchased and installed the language pack for Oracle Utilities BusinessIntelligence.4.Click Sign In. After your credentials have been verified, the dashboard to which you haveaccess rights will appear.Note: The login credentials are provided by the system administrator. You arenot privileged to change your login details. For any modifications, pleasecontact your system administrator.Getting Started 2-1
Logging OutTo logout of the Oracle Utilities Advanced Spatial and Operational Analytics application, clickSign Out. You are directed to the Sign In screen.Using Oracle Utilities Advanced Spatial and Operational AnalyticsAbout the Home PageHome page is the first page you see when you log in. This page displays all the items (dashboards,tasks, reports, and more) you have recently accessed and also the reports most important orpopular.Tip: Because you are likely to return to the Home page very often, theapplication makes the navigation easier. From anywhere within the application,you can return to this page in a single click. The upper right corner of everyscreen features a Home link. Click it to return to your home base.The administrator can set a dashboard as the default dashboard for different users. See OBIEEdocumentation for more details about customization.Using the Main MenuThe main menu appears at the top of the application window.The following table briefly describes the available menu options:2-2 Oracle Utilities Advanced Spatial and Operational Analytics User’s Guide
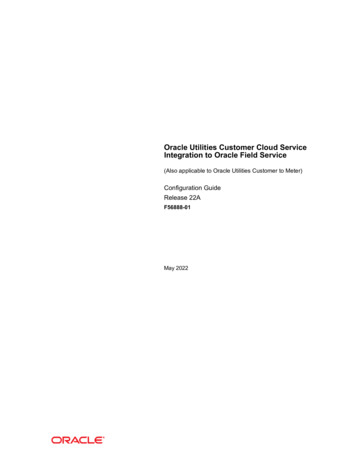
MenuDescriptionSearchAllows you to search for various entities inthe application. You can also use advancedsearch for specific search results.DashboardsDisplays the Recent and Most Populardashboards by default. From here, you canedit an existing dashboard depending onyour logon privileges.NewAllows you to create a new item, such asdashboard, filter, analysis, and more.AdministrationAllows you to display and edit applicationsettings. Note that only authorized userswill have access to this option.HelpOpens the online help for the application.Sign OutLogs you out of the current session.Using the Dashboard ElementsOracle Utilities Advanced Spatial and Operational Analytics comprises dashboards which aregrouped by analytics. Use the Dashboards menu option to open the required dashboard.Note: Not all answers and dashboards are accessible to all users. Based on yourassigned role, only certain analytics (or dashboards) are available for you toaccess.The following figure gives a snapshot of dashboards available in the Meter Data Analytics subjectarea.Getting Started 2-3
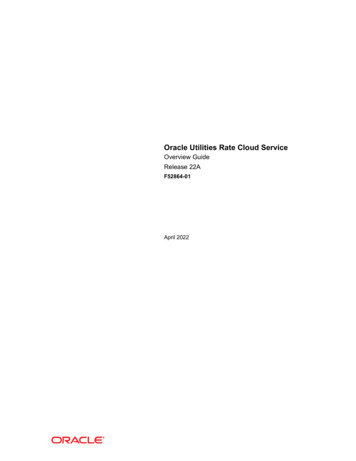
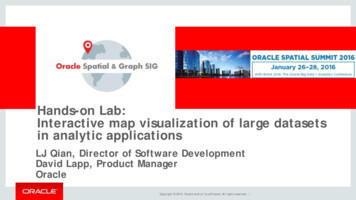
About the Dashboard PageThe Dashboard page is the first page you see when you open a dashboard. You can customize adashboard page by generating custom analyses and reports. When you are working in anapplication, you can return to its Dashboard page at any time. To do so, click the application nameon the upper left of the screen.The figure below explains the elements in each dashboard page.Dashboard TitleThe title bar contains the name of the dashboard you are viewing.Dashboard PageEach dashboard comprises a set of dashboard pages segregated by the analytics. Each page, inturn, consists of analyses grouped per category.Analysis Title and SubtitleEach analysis has a title and subtitle specifying what that analysis represents or denotes. Usually,the month (or over months) is displayed as a subtitle for an analysis, meaning the analysis displaysdata for that month.Selection CriteriaFor an analysis to compile data, you need to select the criteria for which want the data. The criteriadetails can include calendar year, calendar month, activity type, and more.Data DisplayBased on your selection criteria, the application generates data as maps, pie charts, bar graphs,gauges, and tables.Geographic MapsGeographic map zones are used to show geographic coordinate-oriented points of interest. Forexample, a map zone can show:2-4 Oracle Utilities Advanced Spatial and Operational Analytics User’s Guide
The count of AMI meters installed The count of AMR meters installed Percentage of devices changed over the month The following figure shows a geographic map zone that highlights device installation in ageographic area.Navigating the MapSpatial data is displayed in a map view. Below is a list of icons in the navigation tool bar whichappears on the top left corner of the map window.Use the Pan icon to move the map around. Click the icon on the tool bar. The mousepointer changes to the Pan tool and shows a hand when over the map. Click and drag the map inthe required directionUse to zoom in on the area currently displayed on the map.Use to zoom out on the area currently displayed on the map.Displays or removes the map legend. This button works like a toggle. Click once to hide thelegend; click again to display the legend.Panning and Zooming.Pans the map. For example, click the arrow to pan East.Getting Started 2-5
Slide the zoom bar to zoom in (slide towards the ) or out (slide towards the -). You can alsoclick a map level, such as Street or City, to zoom to that level.Filtering Map Data. Use checkboxes in the Legend panel to filter the contents of the page.When a legend object is checked, data corresponding to that level are included in the map; when alegend object is unchecked, the data for that level are not displayed.GraphsA graph shows the value of a measure for a given dimensional attribute in a specific time-period(the x-axis shows the quantity, the y-axis shows the distinct values of the dimensional attribute).For example, you can set up a report graph that shows the average duration for each activity type.The aaplication displays data in the form of bar graphs, stacked bar graphs, pie charts, and alsotables.2-6 Oracle Utilities Advanced Spatial and Operational Analytics User’s Guide
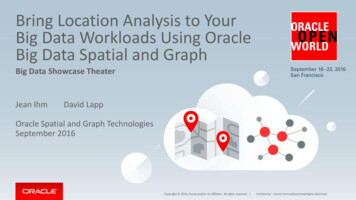
GaugesGauges highlight the state of a key performance indicator (KPI) in a given period. For example,you could use gauges to highlight: Revenue compared to budget revenue Outage duration compared to a target value Asset repair counts compared to the same time last year The following figure shows a gauge that highlights the percentage of normal intervals that havebeen received.Hover textHover text is a brief description of what an analysis means or stands for. You can configure theapplication to show hover text when you mouse over any element.Drill Down/ Drill BackUse the drill down option to navigate from one dashboard page to another dashboard page forgranular level details.You can drill back from a dashboard page in a dashboard to the respective edge application. Anexample to drill back would be navigating from Activity Analysis Detail dashboard page to OracleUtilities Meter Data Management 360 Degrees View for specific device details.Column SorterYou can sort the rows in a table depending on your requirement. Click the up or down arrow inthe header row of the table to arrange records in ascending or descending order. The relatedvalues are swapped accordingly.Hierarchy NodesOBIEE 11gR introduces the concept of a “hierarchical column” which allows for encapsulatingthe presentation of a dimension hierarchy in an analysis report within a single column. Theadvantage of the hierarchical column is that it offers a better user experience in navigating withina hierarchy.You can expand and collapse individual levels within the same report column using the plus ( )and minus (-) icons adjacent to display member values.PrintUse the Print option to print the contents of the current page. Select either PDF or HTML. Abrowser window opens, displaying the contents in the selected format. Use the Print optionavailable from the browser window to print the contents.Getting Started 2-7
ExportUse the Export option to export the results of an analysis or a view in various formats such asPDF, Excel, PowerPoint, etc. Once exported, the data can be customized per requirement.Using Page OptionsSome dashboard pages support additional options available from the Page Options menu in theupper-right corner of the page. Examples of Page Options include: Apply Saved Customization: Allows you to select and apply a Saved Selection. Save Current Customization: Allows you to create a new Saved Selection based on yourcurrent settings. Edit Saved Customization: Allows you to delete or rename a Saved Selection or designate aSaved Selection as the default for the current dashboard page. Clear My Customization: Clears any unsaved selections. Create Bookmark Link: Creates a bookmark for this dashboard page and adds it to yourbrowser's favorites or bookmarks list.Ad-hoc ReportingYou can create new analysis or customize existing analyses by using existing star schema orextending the schema. See Oracle Utilities Advanced Spatial and Operational Analytics AdministrationGuide for detailed information about OBIEE Customization.2-8 Oracle Utilities Advanced Spatial and Operational Analytics User’s Guide
Oracle Utilities Advanced Spatial Analytics Fundamentals This section describes fundamental Oracle Utilit ies Advanced Spatial Analytics concepts. See Oracle Utilities Advanced Spatial and Operational Analytics Administration Guide for a recommended approach to designing and setting up Oracle Utilities Advanced Spatial Analytics.