Transcription
2017 IEEE 6th International Congress on Big DataParallel Processing over Spatial-Temporal Datasets from Geo, Bio, Climate andSocial Science Communities: A Research RoadmapSushil K. Prasad, Danial Aghajarian, Michael McDermott and Dhara ShahDepartment of Computer ScienceGeorgia State Universitysprasad@gsu.eduSatish PuriMathematics, Statistics and Computer ScienceMarquette Universitysatish.puri@marquette.eduMohamed MokbelComputer Science and EngineeringUniversity of Minnesotamokbel@umn.eduSergio J. ReyCenter for Spatial SciencesUniversity of California Riversidesergio.rey@ucr.eduRanga Raju VatsavaiDepartment of Computer ScienceNorth Carolina State Universityrvatsavai@ncsu.eduShashi Shekhar and Yiqun XeDepartment of Computer ScienceUniversity of Minnesotashekhar@cs.umn.eduFusheng Wang, Yanhui Liang and Hoang VoBiomedical Informatics DepartmentStony Brook Universityfusheng.wang@stonybrook.eduShaowen WangGeography & Geographic Information ScienceUniversity of Illinois at s vision paper reviews the current state-ofart and lays out emerging research challenges in parallelprocessing of spatial-temporal large datasets relevant to avariety of scientific communities. The spatio-temporal data,whether captured through remote sensors (global earth observations), ground and ocean sensors (e.g., soil moisturesensors, buoys), social media and hand-held, traffic-relatedsensors and cameras, medical imaging (e.g., MRI), or largescale simulations (e.g., climate) have always been “big.” Acommon thread among all these big collections of datasets isthat they are spatial and temporal. Processing and analyzingthese datasets requires high-performance computing (HPC)infrastructures. Various agencies, scientific communities andincreasingly the society at large rely on spatial data management, analysis, and spatial data mining to gain insights andproduce actionable plans. Therefore, an ecosystem of integratedand reliable software infrastructure is required for spatialtemporal big data management and analysis that will serveas crucial tools for solving a wide set of research problemsfrom different scientific and engineering areas and to empowerusers with next-generation tools. This vision requires a multidisciplinary effort to significantly advance domain researchand have a broad impact on the society. The areas of researchdiscussed in this paper include (i) spatial data mining, (ii) dataanalytics over remote sensing data, (iii) processing medicalimages, (iv) spatial econometrics analyses, (v) Map-Reducebased systems for spatial computation and visualization, (vi)CyberGIS systems, and (vii) foundational parallel algorithmsand data structures for polygonal datasets, and why HPCinfrastructures, including harnessing graphics accelerators, areneeded for time-critical applications.978-1-5386-1996-4/17 31.00 2017 IEEEDOI 10.1109/BigDataCongress.2017.39Keywords-High performance computing, Spatial data mining,Remote sensing data, Medical images, Spatial econometrics,Map-reduce systems, CyberGIS, Parallel algorithms and datastructures.I. I NTRODUCTIONPublic and private sector agencies rely on spatial datamanagement, analysis, and spatial data mining to gain insights and produce actionable plan. Some of the applicationdomains include public health, climate and environment science, transportation, urban planning and engineering. Someof the agencies that use spatial analysis in decision makinginclude National Institute of Health (NIH), US Departmentof Transportation, US Department of Agriculture, NASA,and National Oceanic and Atmospheric Administration [79].Exemplar applications include forest fire or hurricanesimulation, where multiple layers of spatial data needs tobe joined and overlaid to predict the affected areas andrescue shelters. These disaster response scenarios call forleveraging high performance computing techniques to yieldreal-time results. In the biomedical domain, spatial queryand join algorithms are used to analyze digital pathologyimages containing millions of cells [100]. The derived datafrom these images measured are in terabytes and its efficientanalysis enables more effective diagnosis and prediction ofcancer and other important diseases. In the public healthdomain, spatial statistics is used to find significant hotspots232Authorized licensed use limited to: University of Minnesota. Downloaded on August 13,2021 at 21:42:47 UTC from IEEE Xplore. Restrictions apply.
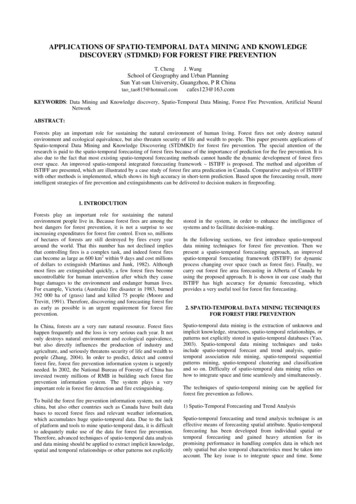
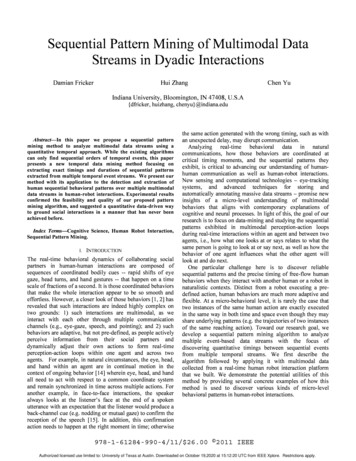
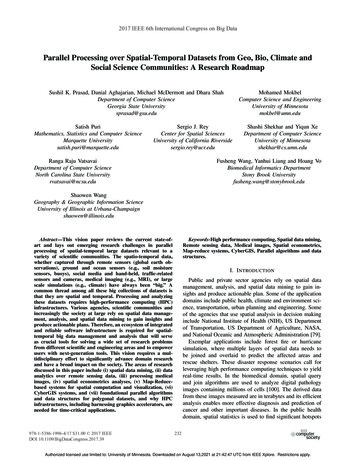
systems for spatial computation and visualization. SectionVI describes the ongoing CyberGIS system project for GIScommunity and its frontiers. Finally, in Section VIII, we endwith examining algorithms, data structures and system issuesand future roadmap, specially for polygonal ST datasets,and why HPC infrastructures, including harnessing graphicsaccelerators, are needed for time-critical applications.related to disease outbreak. Similarly, law enforcement usehotspot maps to find areas with high criminal activities. Intransportation, it is used to find sections of highway withhigher rates of accidents reported [79].State of Art and LimitationsThe computational context facing researchers and savvytool users in different scientific domains that deal withgeo, bio, social and other Spatio-Temporal (ST) data isone of rapidly growing sources of data and traditionalcomputational and analytical tools that were designed forthe desktop era. As a result, much of the software stack inspatial analysis is rather ill-suited to the emerging realities ofbig data. Simply put, research is currently tool-constrainedin two ways. First, the problem size that can be addressedis severely limited by the existing computational capacity inST analysis. Second, the new types of problems, research,and decisions that are afforded by big data are not thetype envisaged by the designers of desktop based scientificsoftware and are thus currently beyond reach.A highly-integrated and reliable software infrastructureecosystem is required for ST big data management and analysis that will serve as crucial tools for solving a wide set ofresearch problems from different scientific and engineeringareas and to empower users with next generation tools. Suchan infrastructure is valuable in two ways: first by speedingup desired data management, mining, and analysis projectson the scale and data granularity never available before, andsecond by enabling new discoveries by the researchers andnew ways of planning and decision making by society atlarge with the novel big-data-oriented tools not availablein the standard software on the market. With this visionin mind, a multidisciplinary effort is necessary to enable abroad community of scientists and users to employ highperformance, scalable and open-source software tools forspatial data analytics and computations over massive geo,bio, climate, social and other ST datasets to significantlyadvance domain research and have broad impact on thesociety.Like the paper’s vision, this paper itself is a result ofan multidisciplinary, multi-institutional collaboration. Ourattempt is to capture the current state of art in processinga variety of ST datasets from disparate problem domainsand the future research directions. Section II starts us offwith an introduction to the broader area of spatial computingand delves into ST data mining techniques. The next threesections are based on three different domains of remote sensing, medical imaging and econometrics. Section III presentswork and research challenges in ST data analytics over remote sensing data. Section IV describes a high performancecomputing (HPC) system over medical image ST datasets.Then, we consider spatial econometrics. Section V examinesan open source library for spatial econometrics analyses.Section VII presents the Map-Reduce-based algorithms andII. S PATIAL AND S PATIO - TEMPORAL DATA M ININGM ETHODS AND T HEIR PARALLEL F ORMULATIONSSpatial and spatio-temporal data mining [79, 80] is concerned with the quantification and discovery of interesting,useful and non-trivial patterns families from datasets suchas maps, trajectories, remote-sensing images, and the decennial census. Applications of spatial data mining includepublic health (e.g., cancer cluster detection, predict spreadof infectious diseases), public safety (e.g., crime hotspot detection, hurricane trajectory and landfall location prediction),location-based services (e.g., co-location of different servicetypes), precision agriculture, transportation (e.g., spatial outlier sensors whose traffic measurements are very differentfrom those of neighboring sensors), etc.Figure 1. 1854 London Cholera map of mortality (blue dots) and waterpumps (red dots). Hotspot analysis identifies the blue circle around theBroad Street water pump. Blue and red dots show locations of mortalitiesand water pumps respectively. Blue circle shows an hotspot of mortalitiesDifferences between classical and spatial data miningare similar to the difference between classical and spatialstatistics. First, spatial data is embedded in a continuousspace, whereas classical datasets are often discrete. Second,the cost of a false positive are often very high for many usecases of spatial data mining. Third, spatial patterns are oftenlocal, whereas classical data mining techniques often focuson global patterns. Finally, one of the common assumptionsin classical statistical analysis is that data samples are independently generated. When it comes to the analysis of spatialdata, however, the assumption about the independence ofsamples is generally false because spatial data tends to233Authorized licensed use limited to: University of Minnesota. Downloaded on August 13,2021 at 21:42:47 UTC from IEEE Xplore. Restrictions apply.
attern familySpatial utlierChange detectionGPU[63][66, 67]MPI[48, -Spark-Table IPATTERN FAMILY AND PARALLEL COMPUTING PLATFORMSfor hotspot detection. Incorrectly labelling a neighborhoodto be a hotspot of disease or crime may lead to stigmatizationand significant economic loss. On the other hand, missingtrue hotspots of disease may lead to preventable mortalitiesand disease burden. To reduce the number of false positives,hotspot detection techniques [2] use statistical significancetests and follow-up manual verifications. Parallel computingalgorithms based on GPU have been proposed in [63].Co-location pattern discovery process finds frequently colocated subsets of spatial event types given a map of theirlocations. For example, analysis of habitats of animals andplants may identify co-location of predator-prey species,symbiotic species, and fire events with fuel, ignition sources,etc. Readers may find it interesting to analyze the map inFigure 1 to find co-location patterns. The 1854 LondonCholera hotspot was collocated with the Broad Street waterpump. This generated a new hypothesis that Cholera wasspread via water challenging the then-prevalent Miasma(i.e., bad air) theory. Scientists started examining the waterfrom Broad Street water pump using micro-scopes, whichsubsequently led the Germ theory, a major turning pointin modern science. It influenced design of modern citiesby introduction of sewer systems and other public healthinnovations. A MapReduce-based parallel formulation forco-location pattern discovery is explored in [113].Spatial outliers [81] are significantly different from theirneighborhood even though they may not be significantlydifferent from the entire population. For example, a newhouse in an old neighborhood of a growing metropolitan areais a spatial outlier, even though it is not a global outlier in ametropolitan area. Another example is an Interstate highwaytraffic sensor, whose measurements were within normalrange, however are often very different than those from itsupstream and downstream neighbors. A case study [81] with4000 sensors on highway network in the Minneapolis St.Paul area found that spatial outlier identified malfunctioningsensors. A MPI-based parallel algorithm was proposed toscale up spatial outlier detection [13].Location prediction is concerned with discovering a modelto infer locations of a spatial phenomenon from the maps ofother spatial features. For example, climate scientists makeland-cover classification maps from remote sensing images.be highly self-correlated. For example, people with similarcharacteristics, occupation and background tend to clustertogether in the same neighborhoods. In spatial statistics, thistendency is called spatial autocorrelation. Ignoring spatialautocorrelation when analyzing data with spatial characteristics may produce hypotheses or models that are inaccurateor inconsistent with the data set. Consequently, classical datamining algorithms often perform poorly when applied tospatial data sets and more powerful methods such as spatialstatistics and spatial data mining are needed. Spatial statistics [20, 21] provide measures for spatial auto-correlation(e.g., spatial auto-regressive models), methods for spatialinterpolation (e.g., Kriging), theories (e.g., spatial pointprocess), etc. leveraging the neighbor relationship betweenlocation-aware data items. Parallel formulations have beenexplored for computing spatial auto-correlation (e.g., MoransI [11] Getis-Ord [106] and spatial interpolation methods(e.g.Kriging [64]) using MPI, OpenMP [36, 48, 64, 84] assummarized in Table I. In addition, parameter estimationprocedures for many spatial statistical models (e.g., spatialauto-regression) use matrix operations and may benefit fromparallel formulations of linear algebra algorithms. However,the matrices representing neighbor relationships among spatial data-items are sparse but not necessarily banded, whichmay require new parallel formulations for operations suchas determinant computation.Spatial data mining explores patterns families such ashotspots, co-locations, location prediction models, spatialoutliers, teleconnections, etc. Hotspots represent geographicareas of unusually high concentration of an event such astrees, retail stores, disease, crimes, etc. The 1854 Choleraepidemic in London is a well-known example of hotspot.Figure 1 shows the Cholera mortality locations using bluedots using the data collected by Dr. John Snow. It also showsa hotspot using a blue circle, within which the mortalitydensity is significantly higher than that outside. It passesthe statistical significance test with a p-value of 0.01 usinga popular hotspot detection software, namely SatScan [2]from the US National Cancer Institute. Hotspot analysis isused widely in public health and public safety to identifyhotspots of diseases and crimes respectively. It is importantto note the high cost of false positives and true negatives234Authorized licensed use limited to: University of Minnesota. Downloaded on August 13,2021 at 21:42:47 UTC from IEEE Xplore. Restrictions apply.
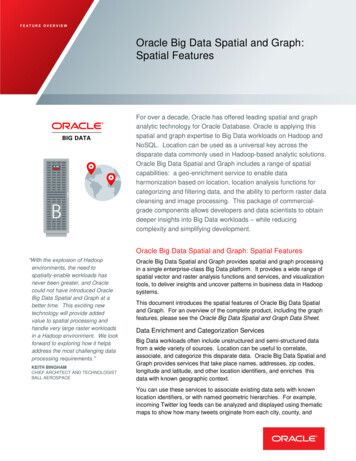
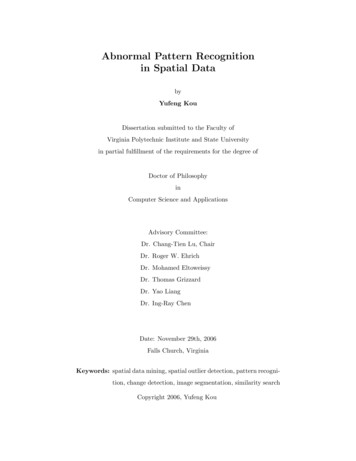
and GP-Learning [17, 18]).ecologist build models to predict habitats for endangeredspecies using maps of vegetation, water bodies, climate andother related species. Classical data mining techniques yieldweak prediction models as they do not capture the autocorrelation in spatial datasets. In addition, the land-coverclassification maps derived from high-resolution imageryusing classical methods (e.g., decision trees, random forest) often exhibit salt-and-pepper noise [46], i.e., locationswhose predicted land-cover class is very different from thepredicted land-cover classes of its neighboring locations.Such problems are reduced significantly by spatial autocorrelation aware location prediction methods such as thespatial auto-regression, Markov random field based BayesianClassifiers, and Spatial Decision Trees [46]. Both GPUbased and OpenMP-based parallel algorithms were exploredfor spatial prediction and classification [35, 75].There are many other interesting, useful and non-trivialpatterns of interest in spatial data mining. For example,change detection patterns identify geographic areas wherethe phenomena of interest have differed significantly overthe time-interval of interest. The efficiency of change detection can be accelerated via GPU-based methods [66, 67].Emerging hotspots aim at detecting disease outbreaks wellbefore it results in a large number of cases. Tele-connectionpatterns represent interaction across far- away locations. Forexample, the El Nino (warming of Pacific) affects weatherthousands of miles away in mid-western and eastern UnitedStates. Interested readers are referred to survey papers onspatial data mining [79, 80] and parallel computing algorithms for GIS [43, 82, 83, 120] for additional details.SpectralAVIRIS (20m, 224B): Ondemand,airborne, 700km/hr.ARIES (30m, 32B, 7 day)AVIRIS CubeLandsat-1 (MSS):80m, 4B, 18 day revisit1M (SPOT, IKONOS, ub-meter (Aerial, WV2 )AVHRR (1KM, 5B, 1 day)MODIS (250m-1KM, 36B, 1-2 days)TemporalFigure 2.5TB/day – Heterogeneous dataAdvances in remote sensing data products (1970 to present)A concrete example of one of the big data challengesare the MODIS instruments on NASA Terra satellite whichacquires two snapshots of the Earth every day. This datais organized in tiles of 10o 10o and each tile consistof 4800 4800 pixels. Biomass monitoring [17, 18] requires processing over 300 tiles (corresponding to the landcoverage). Given that this data is available for the last 16years on a daily basis, the length of the time series at eachlocation contains over 5700 observations. At a global scale,one would require to process a 7 billion time series. Onthe other hand, improved spatial resolution (e.g., 0.5 m)requires processing over 600 trillion pixels for global scalesettlement mapping application. The Gaussian Process basedmonitoring technique [17, 18] shows that these algorithmsrequire O(T 2 ) memory and O(T 3 ) time complexity for Tdata points per pixel (i.e., computation requires inverting7 billion covariance matrices, where each matrix is approximately 5700 5700). For settlement mapping, VHRimagery is being used with pixel resolution of 1 meter (m),therefore a MODIS pixel of 250 m2 is now representedby 250 250 62500m2 pixels. To process just 1 km2image (NY City is roughly 800 km2 ), Citation-KNN [90]algorithm requires approximately 27 hours on a standarddesktop. Therefore, efficient approaches without sacrificingaccuracy are important for these kind of applications.III. B IG DATA A NALYTICS OVER R EMOTE S ENSINGDATAUsage of remote sensing data for tactical and reconnaissance dates back to the 2nd World War. Since thenmulti-spectral remote sensing imagery has been widelyused in civilian applications, such as mapping settlements,forests, crops and other natural and man-made objects onthe Earth. Remote sensing instruments and sensors havemade significant progress over several decades in terms ofspatial, spectral and temporal resolutions (Figure 2). Asshown in the figure, spatial resolution has improved from 1KM to sub-meter, and spectral resolution has improved frommulti-spectral (4-bands) to hyperspectral (224 bands). Theseimprovements have led to the collection of global scale veryhigh resolution (VHR) data. For example, improvementsin temporal resolution allow monitoring biomass [17, 18]on a daily basis. Improvements in spatial resolution allowsfine-grained classification of urban settlements [37, 90, 91],damage assessments [65, 89], and critical infrastructuremonitoring [88, 92]. Although these improvements are leading to new applications, dealing with increased spatial andtemporal resolutions require high-end computing and parallel I/O infrastructures (e.g, GMIL and Citation-KNN [90],Global ApplicationsWith the recent launch of satellites by private companiessuch as Digital Globe (WorldView-2), Planet Labs (Flockof Doves), and SkyBox (recently acquired by Google),applications around very high-resolution (VHR) imagery(sub-meter) are emerging fast. Such imagery provides newopportunities to monitor and map both natural and manmade structure across the globe. For past several years,Vatsavai et al. are engaged in developing new approachesto efficiently process these imagery to support applications235Authorized licensed use limited to: University of Minnesota. Downloaded on August 13,2021 at 21:42:47 UTC from IEEE Xplore. Restrictions apply.
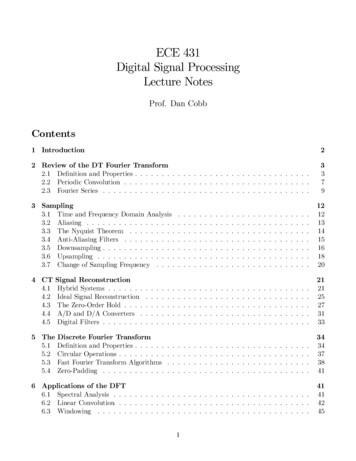
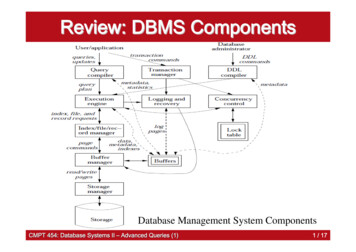
it infeasible for large-scale biomass monitoring studies.However, Vatsavai et al. developed efficient and paralleltechniques using shared and distributed memory modelswhich made it possible to apply this technique for continuous monitoring of biomass at continental scales. As anexample, GP-based change detection technique was ableto identify accurately different types of changes as shownin Figure 3. The first change indicates a corn (C) field isconverted into fallow (F) land, the second change indicatesa corn field converted into a soybean (S) field, the thirdchange indicates corn and soybean rotation is convertedinto continuous corn, and finally the fourth change indicatessome kind of damage to the corn fields [17, 18].Settlement Mapping Using Gaussian Multiple InstanceLearning: Mapping informal settlements is an importanttask both from national security and as well as humanitariangrounds. The high rate of urbanization, political conflicts andensuing internal displacement of population, and increasedpoverty in the 20th century has resulted in rapid increaseof informal settlements. These unplanned, unauthorized,and/or unstructured homes, known as informal settlements,shantytowns, barrios, or slums, pose several challenges tonations as these settlements are often located in the mosthazardous regions and lack basic services. Though severalWorld Bank and United Nations sponsored studies stressthe importance of poverty maps in designing better policiesand interventions, mapping the slums of the world is adaunting and challenging task. Vatsavai et al. developeda computationally efficient and automated framework thatis capable of detecting new settlements (especially slums)across the globe.Most machine learning approaches used for analyzingremote sensing imagery for thematic mapping are singleinstance learners (e.g., Bayesian classifiers, Support VectorMachines, Neural Networks, Random Forests). However,with increasing spatial resolution (sub-meter) current satellite images contain much more spatial heterogeneity (richspatial information). As a result, it is possible to extractmore complex classes, such as informal (slums, shantytowns, burrows) settlements from these very high-resolutionimages. Single instance learning (non-spatial or spatial) isineffective in such cases due to the fact that the size of thepixel (less than one m2 ) is much smaller than the size ofthe objects (for example, average building size in the US is250 m2 ).Multi-instance (or Multiple instance) learning (MIL)methods have been developed to overcome some of thelimitations of single instance learning schemes. Notable approaches include the seminal work of Dietterich et. al. [23],Diverse Density [60], and Citation-KNN [98]. Recently,MIL algorithms have also been applied to remote sensingimage classification as well. For example, in [87] MILapproach is explored for sub-surface land-mine detectionusing hyperspectral (HS) imagery. In [14], authors haveof national importance, such as biomass monitoring [17,18], nuclear proliferation monitoring [88, 92], and settlementmapping [37] at finer spatial and temporal scales. Here isbrief description of two applications that captures improvedtemporal and spatial resolutions.Biomass Monitoring Using Gaussian Process Learning: Monitoring biomass over large geographic regions foridentifying changes is an important task in many applications. With the recent emphasis on biofuel development forreducing dependency on fossil fuels and reducing carbonemissions from energy production and consumption, thelandscape of many countries is going to change dramatically in coming years. With the launch of NASA’s Terrasatellite in December of 1999, with the MODIS instrumentsaboard, a new opportunity for continuous monitoring ofbiomass over large geographic regions has emerged. Theavailability of multi-temporal MODIS imagery has made itpossible to study plant phenology, quantitatively describeNPP patterns in time and space, and monitor and map naturalresources at regional and global scales. MODIS allows usersto identify vegetation changes over time across a regionand estimate quantitative biophysical parameters which canbe incorporated into global climate models. Even thoughseveral cumulative vegetation indices can be found in theliterature, MODIS NDVI temporal profiles are widely usedin studying plant phenology.Figure 3.ImageryGP-Change Detection Results Using MODIS Time SeriesVatsavai et al. developed a novel Gaussian Process (GP)based change detection technique [17, 18] that uses MODISNDVI time series signals to identify changes. As comparedto widely used bi-temporal change detection techniques,their change detection technique continuously monitors thebiomass using biweekly MODIS NDVI data and updatesthe change map as soon as new NDVI image is inductedinto the system. Though their GP based change detectiontechnique showed improved accuracy over other well-knowntechniques, the computational complexity (time complexityis O(n3 ) and memory is O(n2 )) of this technique makes236Authorized licensed use limited to: University of Minnesota. Downloaded on August 13,2021 at 21:42:47 UTC from IEEE Xplore. Restrictions apply.
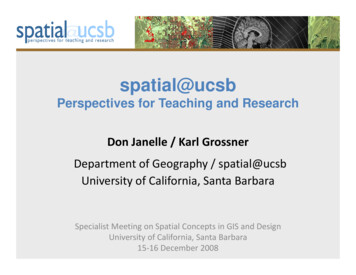
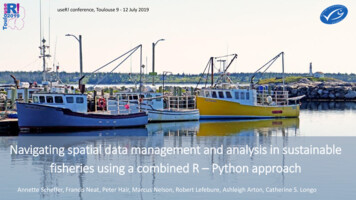
' (*& % (*& % , * (* , (*& % * "'"' # , ' (*& %*& % (*& % ' (*& % (*& % ' %" , ( & , ! ! , ! - " ' " & , ! /",! ,* "'"' ) , ! - "' ". * ' , ! % % " )* " , - "' Figure 6.Figure 4.GMIL Framework. (a) Image patch training examples, (b)Prediction of labels for each new patchFigure 5.2D projections of 3D tissue spacepathology imaging big data at cellular and subcellular levelswith unprecedented rich information. Digital pathology provides extreme scale quantitative data with high potential forbasic research in a wide scope [39, 49, 93], and becomes anemerging technology promising to support computer-aideddiagnosis. Importantly, this new field presents salient meritsthat can help researchers better understand the underlyingbiological mechanisms of pathological evolutions and disease progressions through quantitative pathology analysisand spatial analytics.However, almost all prevalent machine-based tissue investigations are bounded by Two-Dimensional phenotypicstructure analysis. As 2D projected appearances and spatialprofiles of 3D pathologic objects highly depend on thelocations and angles of the cutting planes randomly selectedduring tissue slide preparation process, 3D spatial relationships could be misrepresented and morphological featurescould be inaccurate after such projection to 2D focal planes.Recently, three-dimension (3D) digital pathology is madepossible through slicing tissues into serial thin sections [53].The information-lossless 3D tissue space represented bymicroscopy imaging volumes holds significant potential toenhance biomedical studies through high-performance 3Dimage analysis and spatial analytics.Quantitative analyses of 3D pathology images involveboth deriving 3D micro-anatomic objects and their featuresand exploring spatial relationships among a massive numberof pathology objects. However, this is challenged by theoverwhelming data scale and 3D pathology complexity.Specifically, problems of 3D data explosion (both voxel andstructural data), complex histology structures (such as bloodvessels), multiple levels of detail for representations, andhigh computational complexity for both image analysis andspatial queries/geometric computations need to be addressed.There is also a major gap to make the software tools readilyexecuting on large computing platforms such as commodityclusters or public clouds.Spatial Database Management Systems have been developed for managing and querying 3D spatial data in industrialapplications, such as OracleSpatial, MapInfo Discover 3D,GMIL Classified Image Overlaid on Raw Imagedeveloped MIL based binary classification scheme for identifying targets (landmines) in HS imagery. Gaussian MultipleInstance Learning has also been developed (GMIL) [90]wherein a larger spatial context (image patch) is modeledby a Gaussian distribution, and KL-Divergence is used asthe similarity measure for predicting a class label for eachpatch. This process is shown in Figure 4 and example resultsare shown in Figure 5.OutlookWith the advent of Unmanned Aircraft Systems (UAS)and lightweight imaging sensors, acquiring even higherresolution multispectral and hyperspectral imagery as andwhen required is becoming a reality. As a result, many novelapplications at the intersection of food, energy, and watersystems can be developed. However, the computational andI/O challenges need to be overcome in order to process theterabytes of remote sensing data generated per day.IV. H IGH P ERFORMANCE S PATIAL Q UERIES FOR 3DD IGITAL PATHOLOGY I MAGINGThe rapid and significant advancement in large-throughputtissue scanning technologies has enabled the production of237Authorized licensed use limited to: University of Minnesota. Downloaded on August 13,2021 at 21:42:47 UTC from IEEE Xplore. Restrictions apply.
only needed 3D objects at the specified level of detail andcreates necessary spatial indexes in-memory to acceleratequery processing, such as on-demand object-level indexingand structural indexing on complex structured objects. Thesalient features of the iSPEED system are summarized asfollows. The 3D data compression approach makes it possible tosignificantly reduce data size to have them in memory atvery low memory footprint with effective compressionand on-demand decompression, which leads to muchreduced I/O and communication cost for
Differences between classical and spatial data mining are similar to the difference between classical and spatial statistics. First, spatial data is embedded in a continuous space, whereas classical datasets are often discrete. Second, the cost of a false positive are often very high for many use cases of spatial data mining.