Transcription
Supplementary Material forIncrease in predator-prey size ratios throughout the Phanerozoichistory of marine ecosystemsAdiël A. Klompmaker,* Michał Kowalewski, John Warren Huntley, Seth Finnegan*Corresponding author. Email: adielklompmaker@gmail.comPublished 16 June 2017, Science 356, 1178 (2017)DOI: 10.1126/science.aam7468This PDF file includes:Materials and MethodsFigs. S1 to S22Tables S1 to S22References
Supplementary Materials forIncrease in predator-prey size ratios throughout the Phanerozoic history ofmarine ecosystemsAdiël A. Klompmaker1,2*, Michał Kowalewski2, John Warren Huntley3, Seth Finnegan1correspondence to: adielklompmaker@gmail.comThis PDF file includes:Materials and MethodsFigs. S1 to S22Tables S1 to S22Captions for Databases S1 to S2Other Supplementary Materials for this manuscript includes the following:Databases S1 to S2 as zipped archives: Database 1, Database 2Materials and MethodsWe collected linear mean, maximum, and minimum body size measurements ofindividuals and/or the summary statistics of individuals in a sample of prey items and themean, maximum, and minimum outer drill hole diameter for Phanerozoic single taxonoccurrences per type of inferred driller (parasite, predator sensu stricto, etc.) from theliterature published between 1861 and 2016. Although a variety of prey items are drilledin the fossil record (8, 38–42), current analyses are restricted to marine brachiopod andmolluscan prey (362 occurrences) because these benthic, shell-bearing clades aredominant taxa in the marine fossil record (9), comprise 80% of the Phanerozoic drill-holedata, are of comparable body size, contain the longest and most complete stratigraphicrecord, and mollusks and some brachiopods are important prey of predatory drillers today(38, 43–46). Height or thickness of articulated bivalves and brachiopods, respectively,were typically unavailable, so we were unable to calculate precise shell volumes. Rather,we used lengths and widths to approximate shell size (47, 48). Data were collected usingreported drill-hole and prey sizes (means typically), extracting data from diagrams, andmeasuring drilled specimens from monographs and articles for geological periods withlimited data. All taxa with at least one drilled specimen were used for analyses to ensure1
maximum possible sample sizes. We used specimens with lengths or widths 2.0 mmbecause small shells are preferentially destroyed in lithified sediments relative tounlithified sediments (49), which become more common in the Cenozoic (50).Furthermore, mollusks and brachiopods of 2.0 mm in size are inconsistently included instudies on drilling predation (51). Latitudes and longitudes per occurrence were obtainedusing Google Earth (accuracy within 1 for 95% of data). Where possible, lithology wasscored as unlithified or lithified using PBDB data and our own inferences. Numericalages for drilled shells were estimated as the midpoint of the time unit, mostly stages, towhich drill holes were ascribed following the ICS Timescale 04/2016.Evolutionary models from R package PaleoTS 0.5-1 (11, 52, 53) were run onlog10-transformed per-taxon occurrence period-level variables, which included meandrill-hole diameters, mean drilled shell areas ( π x 0.5length or height x 0.5width), andmean ratios of drill-hole area (π x 0.5 x drill-hole diameter2) / prey shell area. Thepreferred “joint” parameterization was used and variances were not pooled acrosssamples (11, 48). The length of the time series allowed usage of up to four models usingPaleoTS 0.5-1: directional trend, unbiased random walk, stasis, and strict stasis (11, 53),although we have used complex models as well (see below). Data was not weighted perprey sample size to reduce possible effects of uneven sampling per taxon.To test the robustness of the resulting temporal trend of the percentage of shellarea drilled, a variety of sensitivity analyses were carried out, using different metrics,taxonomic and ecological subsets of the data, and complex models. The followingvariants have been used: (1) Instead of the percentage of shell drilled, the percentage ofshell length drilled (Table S5) and shell width drilled (Table S6) were used; (2)Gastropods brachiopods (Table S7) and bivalves brachiopods (Table S8) were usedto test the influence of individual clades; (3) The analyses were restricted to NorthAmerica to test whether patterns were caused by fortuitous mixing of global data (TableS9). Other continents did not yield sufficient data per period and temporal coverage. Forexample, Eurasia yielded data from only the Devonian onward, but only the Triassic,Cretaceous, and Paleogene contained 10 data points for the percentage of shell drilled;(4) The median and standard error were used as inputs for the likelihood-models insteadof the mean and variance (Table S10); (5) The mid-point of periods instead of the age ofthe median data point were used (Table S11); (6) As lithification also preferentiallydestroys shell sizes of 2 – 5 mm relative to unlithified sediments, but much less so thanfor shells 2 mm in size (49), the analyses were also restricted to specimens 5 mm foreither length or width (Table S12). For comparison, we also analyzed the data withoutsize restrictions (Table S13); (7) We use ‘predator’ in a broad sense (14, 54) becausedifferentiating between drill holes produced by predators sensu stricto and parasites canbe difficult in the early Mesozoic and Paleozoic (55, 56) and both predators and parasiteshave a negative effect on the prey. The analyses were restricted to inferred predatory drillholes only (Table S14); (8) The minimum number of specimens per data point wasdoubled to two (Table S15). Increasing this number to three lowered the number of datapoints per bin to 6 for 5/11 bins including two bins without data, which was deemedinsufficient for meaningful analyses; (9) The Paleobiology Database was used to obtainthe inferred paleoecology (motility and life habit) per taxon after which analyses wererun for stationary and epifaunal taxa separately (Tables S16–S17). Data for nonstationary and infaunal prey were too sparse for meaningful analyses (Figs. S12–S13);2
(10) In addition to using an ellipse to approximate shell area, the area of the shell drilledwas calculated using two other methods. First, the area of a cone to approximate shellsurface area of gastropods and the area of a single valve for brachiopods and bivalveswas doubled to approximate exposed total shell area for each taxon (Table S18).Secondly, bivalve and brachiopod shell area was approximated as an ellipsoid with valveheight estimated by (width length) / 2, which is not a conservative estimate for height(Table S19); and (11) A minimum of 14 bins is required for complex evolutionarymodels (11) to run in PaleoTS. Because the Cenozoic has relatively many data points perbin, the periods were subdivided into epochs to expand the number of time bins so thatalso complex models could be run (Table S20).To test whether the temporal trend of the percentage of shell area drilled could bedue to taxonomic mixing of the prey clades (brachiopods, bivalves, and gastropods) orpreferential dissolution of aragonitic mollusks (13), two strategies were chosen. First, wecompared the drill-hole size / shell size between brachiopod and bivalves within Permian(29, 57) and modern assemblages (30). This method eliminates the time component in themost direct way. To our knowledge, these were the only assemblages suitable for thisanalysis. Secondly, a permutation test was designed to simulate the expected trajectory ofpredator-prey size ratios if the sizes of drill holes did not change through time within theclades (that is, if the trajectory was entirely an artifact of replacement among the preyclades). We carried out 1000 iterations of this permutation procedure, and used thepaleoTS::fit4models() function to evaluate relative support for different models for eachpermutation.Furthermore, the literature of modern, extant organisms was surveyed for directevidence of driller lengths, driller widths, and drill-hole diameters supplemented with asingle Mississippian platyceratid gastropod atop a drill hole in a crinoid (58) for whichonly the gastropod width could be estimated. The identity of the modern drillers waseither based on direct field or experimental observations of known predators. Data werecollected using reported drill-hole and prey sizes, extracting data from diagrams, andmeasuring the size of figured individual predator specimens and the drill-hole diametersthey produced. Most data are based on singly drilled specimens (98%); for the others, theavailable means were used if insufficient data was available for single specimens.Octopods were excluded because their size is typically expressed as a weight instead ofshell width and/or length (44, 59, 60). A reduced major axis regression line was fitthrough the logged data and 95% confidence intervals were estimated by a bias-correctedand accelerated (BCa) bootstrap method (1000 iterations). Bootstrap distributions ofslope and r-square values were derived by resampling with replacement bivariate sets ofobservations. The confidence interval estimates were based on the bias-corrected andaccelerated (BCa) bootstrap using jackknife approximation (61), an approach whichadjusts bootstrap distribution for both bias and skewness. This approach wasimplemented using a custom-made function in R. Shell length was used because mostdata were available for this measure of size. However, we also ran the analysis fordrillers’ shell width, shell lengths 1 mm, for marine taxa only, and for predatory drillholes only. Insufficient data was available for parasites for a separate analysis.We used drill-hole diameter as a proxy for predator size in deep time. Thisrelationship is suggested by results herein using drillers from a variety of phyla, but alsofor multiple extant gastropod drilling species over a range of shell sizes (62–65). The size3
of the driller is positively correlated with its boring organ, which, in turn, is positivelycorrelated with the drill-hole diameter (38, 66, 67). Furthermore, there is no significantrelationship between prey size and drill-hole size for individual specimens of drillers(68). Finally, multiple studies suggest that there is no relationship between taphonomiccondition and the presence of drill holes (69–71).The size of drilling predators is considered herein a correlative for power(strength and speed) or predators. This proxy is used here to test a key tenet of thehypothesis of escalation: predators became more powerful over time. Although drillingrates (mm/hr) are independent of predator size (62, 72), larger drilling predators are faster(73, 74) and thus more able to successfully pursue prey, should have an easier timesubduing prey once the prey is reached, and ingest prey faster through the larger hole (72)for the same prey size and species.Finally, using the primary literature, shell lengths (or heights) and widths werecollected from the holotypes or largest syntypes of Late Cretaceous – Cenozoic fossilspecies of the type genera of the two best-known and extant predatory drilling families,Natica of the Naticidae and Murex of the Muricidae, as listed in the PaleobiologyDatabase (11/01/2016). The largest syntype likely approaches what would have been theholotype size (75). We also collected such data from hypothesized Paleozoic – Triassicpredatory drilling species suggested in the literature minus those species found attachedto echinoderms because these species, typically platyceratids, can drill but are consideredparasitic (58, 76, 77). The Mann-Whitney test was used to compare the log10 shellvolumes (π (shell radius)2 shell height/3).4
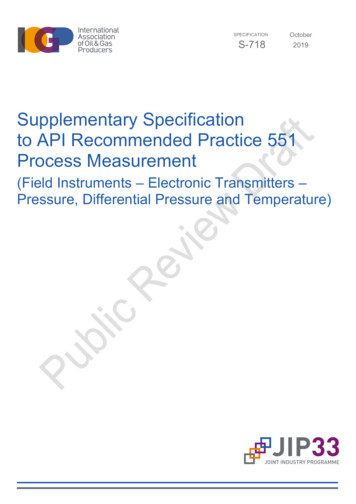
Fig. S1. Re-analysis of drill-hole size versus predator shell size relationship for datalimited to exclusively marine clades of drilling predators. Reduced major axisregression line supplemented by 95% bootstrapped confidence intervals and bootstrappedr-values in histogram (both 1000 iterations) (10). Log10 slope 0.96, intercept: -1.11.5
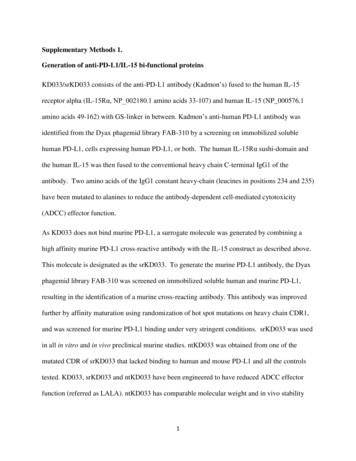
Fig. S2. Re-analysis of drill-hole size versus predator size relationship using shellwidth for modern drilling clades and a single fossil occurrence (58). The fossil is aplatyceratid gastropod and is indicated by black circle near green square. Reduced majoraxis regression line supplemented by 95% bootstrapped confidence intervals andbootstrapped r-values in histogram (both 1000 iterations). Log10 slope 0.98 intercept: 0.99.6
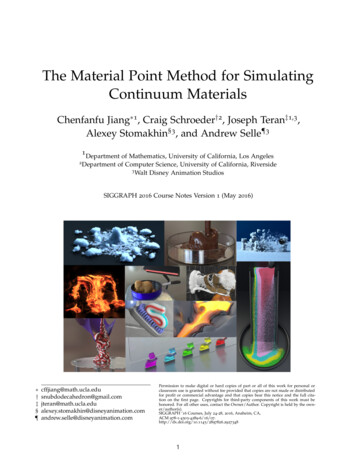
Fig. S3. Re-analysis of drill-hole size versus predator shell size relationship for datalimited to exclusively predatory drilling clades. Reduced major axis regression linesupplemented by 95% bootstrapped confidence intervals and bootstrapped r-values inhistogram (both 1000 iterations). Log10 slope 0.96 intercept: -1.12.7
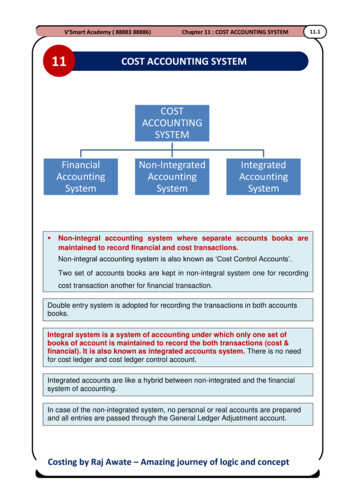
Fig. S4. Re-analysis of drill-hole size versus predator shell size relationship for datalimited to drill-hole diameters of 0.2–3.3 mm. This is the range over which drill-holesize medians changed across the Phanerozoic. Reduced major axis regression linesupplemented by 95% bootstrapped confidence intervals and bootstrapped r-values inhistogram (both 1000 iterations). Log10 slope 0.75 intercept: -0.87.8
Figure S5. Log10-scaled outer drill-hole diameter versus predator shell length formodern drilling clades using two methods of regression. (A) Reduced major axisregression line supplemented by 95% bootstrapped confidence intervals. Slope 0.94; intercept -1.09. Same as Figure 1. (B) Ordinary least squares axis regressionline supplemented by 95% bootstrapped confidence intervals. Slope 0.82; intercept -0.93.9
Figure S6. Minimum, median, and maximum drill-hole sizes through time. Themaxima and minima are based on the true minimum and maximum values reported, andare not based on the minima and maxima of the medians within each bin as in Figure 2B.Numbers represent the number of specimens per bin. Percentiles are used to removeoutliers (48).10
Figure S7. Differences between the 95th percentile of the maximum drill-hole sizes and the 5th percentile of the minimum drill-hole sizes through time. No significant trend is apparent despite increasing sample sizes in the Cenozoic (Pearson's product-momentcorrelation p 0.76, using numerical midpoints of periods).11
Figure S8. Minimum, median, and maximum prey shell sizes through time. Themaxima and minima are based on the true minimum and maximum values reported, andare not based on the minima and maxima of the medians within each bin as in Figure 2A.Numbers represent the number of specimens per bin. Percentiles are used to removeoutliers (48).12
Figure S9. Differences between the 95th percentile of the maximum prey shell sizes and the 5th percentile of the minimum prey shell sizes through time. No significant trend is apparent despite increasing sample sizes in the Cenozoic (Pearson's product-moment correlation p 0.53, using numerical midpoints of periods).13
Fig. S10. Comparison of shell volumes from fossil drillers with modernrepresentatives and older, hypothesized fossil drilling predators. Specifically,comparison is made between the volumes of the holotypes or largest syntypes of LateCretaceous – Cenozoic fossil species of Natica and Murex versus those fromhypothesized Paleozoic – Triassic predatory drillers. The latter taxa are statisticallysmaller (Mann-Whitney U 101.5; p 0.01). Data in Tables S20–S21.14
Figure S11. The relationship between prey shell area and drill-hole area color-codedby era. There is a shifting positive relationship between prey size and drill-hole size aspredator size increases through time. Larger circles represent median centroids per era.Prey size remains relatively stable through time and does not appear to widen or narrow(compare the Cenozoic and Paleozoic).15
Fig. S12. No significant differences exist between the percentage of Cenozoicmollusks drilled as a proxy for predator-prey size ratios for tropical andextratropical regions ( 30 ). (A) Gastropods; Wilcoxon W 141, p 0.88; samplesizes: 5 and 59, resp. (B) Bivalves; Wilcoxon W 245, p 0.29; sample sizes: 11 and 56,resp.16
Fig. S13. No significant differences exist between the percentage of Cenozoic bivalveshells drilled as a proxy for predator-prey size ratios for non-lithified and lithifiedsediments. Wilcoxon W 476, p 0.39; sample sizes: 35 and 24, resp. Boxplot widthsproportional to n. Sample sizes were too low for gastropods. Lithification data based onprimary literature search and data from the Paleobiology Database.17
Fig. S14. Stacked bar chart showing the proportion of drilled brachiopod versusmollusk prey taxa for each Phanerozoic period. Sample sizes: Ordovician (20),Silurian (17), Devonian (49), Carboniferous (17), Permian (36), Triassic (16), Jurassic(13), Cretaceous (41), Paleogene (51), Neogene (54), Quaternary (49).18
19
Fig. S15. Shell areas (left) and the percentage of shell that is drilled (right) acrossthe Phanerozoic. (A, B) Brachiopoda. (C, D) Bivalvia. (E, F) Gastropoda. Sample sizesindicated in lower part diagrams.20
Fig. S16. Comparing the drill-hole diameter / shell lengths between brachiopod andbivalves for two assemblages. (A) Permian silicified brachiopods and bivalves fromwest Texas (USA) (data: (29)); Wilcoxon W 1450, p 0.97; brachiopod specimens:111, bivalve specimens: 26. (B) A modern fauna from Brazil (data: (30)); Wilcoxon W 142, p 0.53; brachiopod specimens: 7, bivalve specimens: 35. The drill-hole diameter /shell lengths do not differ either between Permian bivalves and brachiopods mixedtogether from different geographic regions including Texas, Russia, Greece, and Brazil(Wilcoxon W 95, p 0.76; data: (57)). This result suggests that the lack of differencesis not only found in local to regional assemblages, but may represent a global signal.21
Fig. S17. Results of the permutation test simulating the expected trajectory ofpredator-prey size ratios if the sizes of drill holes did not change throughtime within clades (brachiopods, bivalves, and gastropods). Number of iterations 1000. Most iterations were best fit by a stasis model (median AIC weight 0.746), withsome best fit by an unbiased random walk model (median AIC weight 0.213). Themedian AIC weight for the directional trend model was 0.033, with a maximum of0.505. The probability of generating the observed directional trend model AIC weight of0.726 entirely through replacement among prey clades is thus 0.001. The arrowsindicate the support for each model using the true data (see Fig. 2C).22
Fig. S18. Driller length/prey length versus driller length for modern drillingpredators and parasites. Parasites tend to be smaller relative to their prey (drillerlength/prey length 1) than predators are.23
Fig. S19. Stacked bar chart showing the proportion of drill holes per category ofinferred origin through the Phanerozoic. Sample sizes: Ordovician (17), Silurian (16),Devonian (45), Carboniferous (13), Permian (36), Triassic (16), Jurassic (11), Cretaceous(41), Paleogene (50), Neogene (54), Quaternary (49).24
Fig. S20. Log10-scaled boxplots of the percentage of shell drilled (proportional topredator-prey size ratio) in Phanerozoic brachiopods and mollusks using predatorydrill holes only. Boxplot widths n; n per boxplot: 7–54. Table S14 shows support foreach evolutionary model.25
Fig. S21. Stacked bar chart showing the proportion of drill holes per category ofprey motility through the Phanerozoic. Sample sizes: Ordovician (20), Silurian (15),Devonian (47), Carboniferous (17), Permian (35), Triassic (15), Jurassic (13), Cretaceous(40), Paleogene (50), Neogene (54), Quaternary (48).26
Fig. S22. Stacked bar chart showing the proportion of drill holes per
Jun 14, 2017 · Natica of the Naticidae and Murex of the Muricidae, as listed in the Paleobiology Database (11/01/2016). The largest syntype likely approaches what would have been the holotype size (75). We also collected such data from hypothesized Paleozoic – Triassic predatory drilling species sugge