Transcription
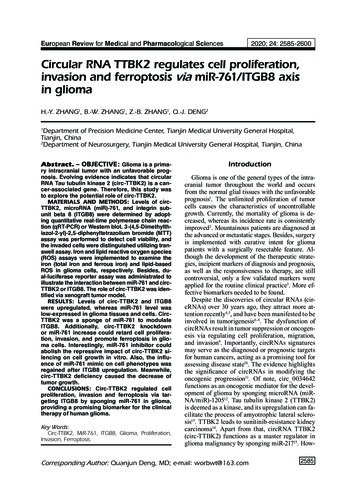
European Review for Medical and Pharmacological Sciences2020; 24: 2585-2600Circular RNA TTBK2 regulates cell proliferation,invasion and ferroptosis via miR-761/ITGB8 axisin gliomaH.-Y. ZHANG1, B.-W. ZHANG1, Z.-B. ZHANG1, Q.-J. DENG2Department of Precision Medicine Center, Tianjin Medical University General Hospital,Tianjin, China2Department of Neurosurgery, Tianjin Medical University General Hospital, Tianjin, China1Abstract. – OBJECTIVE: Glioma is a prima-ry intracranial tumor with an unfavorable prognosis. Evolving evidence indicates that circularRNA Tau tubulin kinase 2 (circ-TTBK2) is a cancer-associated gene. Therefore, this study wasto explore the potential role of circ-TTBK2.MATERIALS AND METHODS: Levels of circTTBK2, microRNA (miR)-761, and integrin subunit beta 8 (ITGB8) were determined by adopting quantitative real-time polymerase chain reaction (qRT-PCR) or Western blot. um bromide (MTT)assay was performed to detect cell viability, andthe invaded cells were distinguished utilizing transwell assay. Iron and lipid reactive oxygen species(ROS) assays were implemented to examine theiron (total iron and ferrous iron) and lipid-basedROS in glioma cells, respectively. Besides, dual-luciferase reporter assay was administrated toillustrate the interaction between miR-761 and circTTBK2 or ITGB8. The role of circ-TTBK2 was identified via xenograft tumor model.RESULTS: Levels of circ-TTBK2 and ITGB8were upregulated, whereas miR-761 level waslow-expressed in glioma tissues and cells. CircTTBK2 was a sponge of miR-761 to modulateITGB8. Additionally, circ-TTBK2 knockdownor miR-761 increase could retard cell proliferation, invasion, and promote ferroptosis in glioma cells. Interestingly, miR-761 inhibitor couldabolish the repressive impact of circ-TTBK2 silencing on cell growth in vitro. Also, the influence of miR-761 mimic on cell phenotypes wasregained after ITGB8 upregulation. Meanwhile,circ-TTBK2 deficiency caused the decrease oftumor growth.CONCLUSIONS: Circ-TTBK2 regulated cellproliferation, invasion and ferroptosis via targeting ITGB8 by sponging miR-761 in glioma,providing a promising biomarker for the clinicaltherapy of human glioma.Key Words:Circ-TTBK2, MiR-761, ITGB8, Glioma, Proliferation,Invasion, Ferroptosis.IntroductionGlioma is one of the general types of the intracranial tumor throughout the world and occursfrom the normal glial tissues with the unfavorableprognosis1. The unlimited proliferation of tumorcells causes the characteristics of uncontrollablegrowth. Currently, the mortality of glioma is decreased, whereas its incidence rate is consistentlyimproved2. Mountainous patients are diagnosed atthe advanced or metastatic stages. Besides, surgeryis implemented with curative intent for gliomapatients with a surgically resectable feature. Although the development of the therapeutic strategies, incipient markers of diagnosis and prognosis,as well as the responsiveness to therapy, are stillcontroversial, only a few validated markers wereapplied for the routine clinical practice3. More effective biomarkers needed to be found.Despite the discoveries of circular RNAs (circRNAs) over 30 years ago, they attract more attention recently4,5, and have been manifested to beinvolved in tumorigenesis6-8. The dysfunction ofcircRNAs result in tumor suppression or oncogenesis via regulating cell proliferation, migration,and invasion9. Importantly, circRNAs signaturesmay serve as the diagnosed or prognostic targetsfor human cancers, acting as a promising tool forassessing disease state10. The evidence highlightsthe significance of circRNAs in modifying theoncogenic progression11. Of note, circ 0034642functions as an oncogenic mediator for the development of glioma by sponging microRNA (miRNA/miR)-120512. Tau tubulin kinase 2 (TTBK2)is deemed as a kinase, and its upregulation can facilitate the process of amyotrophic lateral sclerosis13. TTBK2 leads to sunitinib-resistance kidneycarcinoma14. Apart from that, circRNA TTBK2(circ-TTBK2) functions as a master regulator inglioma malignancy by sponging miR-21715. How-Corresponding Author: Quanjun Deng, MD; e-mail: worbwt@163.com2585
H.-Y. Zhang, B.-W. Zhang, Z.-B. Zhang, Q.-J. Dengever, the underlying network of circ-TTBK2 inglioma needed to be further explored.Until now, circRNAs are identified as thesponges of miRNAs to participate in tumorigenesis16. In regard to miRNAs, the strict relationshipbetween miRNAs dysregulation and the biological or pathological process has been confirmed17.MiR-761 is an ordinary miRNA, located at chromosome 1p2. Earlier works suggest that miR-761was connected with the onset and developmentof diverse cancers, such as hepatocellular carcinoma18 and glioma19. Whether miR-761 could interact with circ-TTBK2 was the purpose of thispresent purpose. Furthermore, miR-761 goes infor the pathogenesis and progression of tumorsby targeting tumor-related proteins20,21. Integrinsubunit beta 8 (ITGB8) has been revealed to berelated to the regulation of metastasis in humancancer22. We further investigated whether ITGB8was a potential target of miR-761.In this study, we clarified the expression statuses of circ-TTBK2, miR-761, and ITGB8 in gliomatissues and cells (LN299 and U251). The networkof circ-TTBK2 was partially exposed by the functional assays.Materials and MethodsClinical Specimens and Cell CultureGlioma patients (n 30) and intracranial injurypatients (n 30) were recruited from Tianjin Medical University General Hospital for the glioma tissues and matched specimens. The experimentaltissues were donated by the enrolled participatorswho signed the written informed consent. Thisresearch was authorized by the Ethics Committeeof Tianjin Medical University General Hospital.Glioma cells (LN229 and U251) and normalcells (NHA) were purchased from Be Na CultureCollection (Beijing, China) and maintained inDulbecco’s Modified Eagle’s Medium (DMEM;HyClone, South-Logan, UT, USA) supplementedwith 10% fetal bovine serum (FBS; Gibco, GrandIsland, NY, USA), 100 U/mL penicillin (HyClone,South-Logan, UT, USA) and 100 μg/mL streptomycin (HyClone, South-Logan, UT, USA). Thecells continuously grew at 37 C in an incubatorcontaining 5% CO2.Cell TransfectionShort hairpin (shRNA) targeting the junction region of circ-TTBK2 (sh-circ-TTBK2)and its negative control (sh-NC) was obtained2586from Sangon Biotechnology (Shanghai, China). MiR-761 mimic (miR-761), miR-761 inhibitor (anti-miR-761), and their controls (miR-NCand anti-miR-NC) were purchased from Hanbio(Shanghai, China). The overexpression vectors ofcirc-TTBK2 (circ-TTBK2) and ITGB8 (ITGB8),as well as their blank control (pcDNA), were designed and constructed in Sangon Biotechnology(Shanghai, China). Consistent with the previouspaper, circ-TTBK2 contained two frames: a frontcircular frame and a back circular frame5,23. Celltransfection was conducted using Lipofectamine2000 reagent (Invitrogen, Carlsbad, CA, USA)according to the producer’s protocol. Expect that,sh-circ-TTBK2 and sh-NC were adopted to establish the stably transfected cells via lentivirus-mediation.Quantitative Real Time-Polymerase ChainReaction (qRT-PCR) AssayTotal RNA was purified and extracted fromthe tissues (glioma and its matched control) andcells (LN229, U251, and NHA) using TRIzol Reagent (Invitrogen, Carlsbad, CA, USA). For circTTBK2, RNase-R (Epicentre, Madison, WI, USA)was added to eliminate the liner RNAs and verifythe existent of circ-TTBK2. The measurement ofcirc-TTBK2 was performed using One Step PrimeScript RT-PCR Kits (TaKaRa, Dalian, China). In addition, total RNA acted as the template tosynthesize the complementary DNA (cDNA) withthe help of High Capacity cDNA Reverse Transcription Kits (Applied Biosystems, Foster City,CA, USA). Fast SYBR Green PCR kit (AppliedBiosystems, Foster City, CA, USA) was employedto mix the reacted solution as per the manufacturer’s directions. Glyceraldehyde-3-phosphate dehydrogenase (GAPDH; for circ-TTBK2 and ITGB8)or U6 (for miR-761) served as the endogenouscontrol. The levels of circ-TTBK2, miR-761, andITGB8 were normalized via the 2-ΔΔCt method. Theprimer sequences were shown: circ-TTBK2 (Forward:5’-AGTGCAACATTTTCCCTGGTG-3’,Reverse: 5’-GCTTGATTTTGGCTTGGCTC-3’);probe: FAM CCCCAATCTTTCTCAATGGTCTGACG BHQ1; miR-761 (Forward: 5’-ACAGCAGGCACAGAC-3’, Reverse: 5’-GAGCAGGCTGGAGAA-3’); ITGB8 (Forward: 5’-CTGAAGAAATACCCCGTGGA-3’, Reverse: 5’-ATGGGGAGGCATACAGTCT-3’); GAPDH (Forward: 5’-ACTCCTCCACCTTTGACGC-3’, Reverse: 5’-GCTGTAGCCAAATTCGTTGTC-3’);U6 (Forward: 5’-CTCGCTTCGGCAGCACA-3’,Reverse: 5’-AACGCTTCACGAATTTGCGT-3’).
Role of circ-TTBK2/miR-761/ITGB8 axis in the progression of razolium Bromide (MTT) AssayThe glioma cells (LN229 and U251) were platedinto the wells of a 96-well plate at 24 h post-transfection and cultured at 37 C. After incubation for indicated time, the cells were added with MTT solution(Sigma-Aldrich, St. Louis, MO, USA), and continuously cultured for 4 h. Subsequently, the reactionwas terminated following the addition of 200 µL dimethyl sulfoxide (DMSO; Sigma-Aldrich, St. Louis,MO, USA). The absorbance of the lysates was assessed via a microplate reader at 490 nm.Matrigel Invasion AssayCell invasion assay was performed usingtranswell plates (8 mm pores; Corning, Costar,NY, USA) with pre-coated Matrigel (Corning,Costar, NY, USA). The transfected cells withserum-free media were seeded onto the upperchamber, and relative medium containing 10%FBS as the chemoattractant of cells filled withthe low chamber. After culture for 48 h, the migrated cells that passed through the filter werestained by 0.5% crystal violet (Corning, Costar,NY, USA). Then, the average invasion rate wascalculated to represent the ability of the invasionof the tested cells.Iron AssayThe measurements of the total iron and ferrousiron were performed using the Iron Analysis Kit(Sigma-Aldrich, St. Louis, MO, USA). Firstly,2 106 cells were immediately homogenized with5 volumes of Iron Assay buffer. The insolublematerial was wiped off via the centrifugation at13,000 g under 4 C. For estimation of Fe2 iron,5 µl of Iron Reducer was supplemented per well.For the assay of total iron, sample wells were added Iron reducer to reduce the switch from Fe3 toFe2 . The mixture was gently mixed via pipetting,and then, reacted for 30 min in the dark. Subsequently, 100 µL Iron Probe was added into thestandard and test samples, and the thoroughlymixed sample was incubated for 1 h at room temperature darkly. In the end point, the absorbancewas determined with the help of microplate reader at 593 nm.Lipid Reactive Oxygen Species (ROS) AssayLipid ROS level was identified with the useof BODIPYC11 dye (Thermo Fisher Scientific,Waltham, MA, USA) in accordance with previous studies24,25. Briefly, the cells were inducedusing ferrostatin (2.0 μM; MedChemExpress,Monmouth Junction, NJ, USA) or Erastin (10.0μM; MedChemExpress, Monmouth Junction, NJ,USA). The cells treated accordingly were culturedin the well of a 6-well plate. After incubation for48 h, the supernatant was removed and then added with fresh medium with 5 µM of BODIPY-C11.Next, the cells were continuously cultured for 20min at 37 C. After that, the above cells were harvested and washed using phosphate buffered solution (PBS; HyClone, South Logan, UT, USA), andthen shifted into 15 ml tubes. Subsequently, thesedimentary cells were re-suspended with 500 µLPBS followed by the filtration with the cell strainer (0.4 µm nylon mesh; BD Biosciences, FranklinLakes, NJ, USA). The cell suspension was subjected to the analysis of flow cytometry to assessthe abundance of the ROS within cells.Western Blot AssayThe protocol was operated in accordance withthe descriptions in a previous study26. Briefly, thesegregated proteins were blotted on the polyvinylidene difluoride membranes (PVDF; Millipore, Billerica, MA, USA). Then, the membraneswere incubated with unique primary antibodiesovernight at 4 C after blocking for 1 h. On thenext day, the corresponding secondary antibodywas used for the combination with the primaryantibody, and the combined signals were appearedvia adding the reagents of an enhanced chemiluminescence (ECL) kit (Millipore, Billerica, MA,USA). The primary antibodies were purchasedfrom Abcam (Cambridge, MA, USA), and thespecial information was listed: ITGB8 (1:1000,ab80673) and GAPDH (1:20000, ab8245).Dual-Luciferase Reporter AssayThe fragments of circ-TTBK2 and ITGB8 containing miR-761 complementary sequences weresynthesized from Sangon Biotechnology (Shanghai, Cina). These sequences were inserted into psiCHECK-2 (Promega, Madison, WI, USA), whichwas the basic vector of the Luciferase, named asWT-circ-TTBK2 and ITGB8 3’UTR-WT. Simultaneously, the mutated binding sites were usedfor the mutant reporters (MUT-circ-TTBK2 andITGB8 3’UTR-MUT) in the same way. Next, theabove wildtype or mutant reporter was transfected into LN229 and U251 cells with the presenceof miR-761 mimic or its control. Luciferase activity was examined with the use of Dual-LuciferaseReporter Assay System (Promega, Madison, WI,USA) as per the manufacturer’s manuals.2587
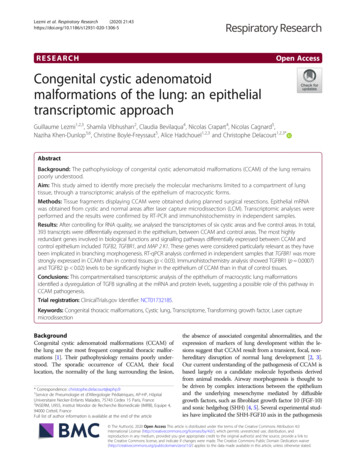
H.-Y. Zhang, B.-W. Zhang, Z.-B. Zhang, Q.-J. DengXenograft Tumor ModelThe stably transfected LN229 cells were set upvia the lentivirus-mediation of sh-circ-TTBK2 orsh-NC. Then, the stably transfected LN229 cells(2 106) were injected into the Balb/c nude mice(4 weeks old, n 6/group) subcutaneously, whichwere purchased from Vital River Laboratory Animal Technology (Beijing, China). The in vivo experiments were approved by the Institutional Animal Care and Use Committee of Tianjin MedicalUniversity General Hospital. The tumor length(L) and width (W) were measured every 3 daysfor a total of 6 times, and the volume was calculated: volume L W2/2. Twenty-four days afterinjection, mice were sacrificed, and the tumorsamples were collected, and these isolated tumorswere weighed and applied for the subsequent assays.Statistical AnalysisStatistical analyses were carried out utilizingSPSS 18.0 (SPSS Inc., Chicago, IL, USA), and thedata were expressed as mean Standard Deviation (SD). Comparison between two groups wasassayed using Student’s t-test, and one-way analysis of variance with Tukey test was implement-ed to compare the difference among the multiplegroups (three or more groups). For all analyses,p 0.05 was deemed as the indicator of statisticaldifference.ResultsCirc-TTBK2 with a High Level in GliomaTissues and Cells was Associated withMiR-761To investigate the biological function of circTTBK2 in glioma, we implemented qRT-PCR toevaluate the relative expression of circ-TTBK2 inglioma and selected cell lines. The results demonstrated that circ-TTBK2 was clearly upregulatedin glioma tissues and cells in comparison withrelative controls (Figure 1A and 1B). Besides,we also found that miR-761 was particularly decreased in glioma tissues and cells (Figure 1Cand 1D). Subsequently, statistical analysis exposed that miR-761 was inversely correlated withcirc-TTBK2 in glioma tissues (Figure 1E). Thesedata showed that the aberrant expression of circTTBK2 and miR-761 might go in for the progression of glioma.Figure 1. Circ-TTBK2 with a high level in glioma tissues and cells was associated with miR-761. A-D, The levels of (A andB) circ-TTBK2 and (C and D) miR-761 were assessed using qRT-PCR in glioma tissues and cells. E, The correlation betweenmiR-761 and circ-TTBK2 was verified by Pearson’s correlation analysis. *p 0.05.2588
Role of circ-TTBK2/miR-761/ITGB8 axis in the progression of gliomaKnockdown of circ-TTBK2 suppressedcell proliferation, invasion,and promoted ferroptosis in glioma cellsConsidering the ectopic expression of circTTBK2, we next attracted the characteristics ofcirc-TTBK2 in glioma. Firstly, sh-circ-TTBK2or sh-NC was introduced into LN229 and U251cells, and the level of circ-TTBK2 was evidently reduced by sh-circ-TTBK2 transfection (Figure 2A). Then, MTT analysis confirmed thatcirc-TTBK2 deficiency could strikingly hampercell proliferation in the two glioma cells (Figure2B and 2C). In addition, the capacity of cell invasion was determined by transwell assay, andthe results exhibited that the invasion of LN229and U251 cells was distinctly impeded after circTTBK2 detection (Figure 2D). In addition, thelevel of ferroptosis was measured. The ferroptotic mode of programmed necrosis was identifiedas an apoptosis-independent form of cell death27.We supplemented ferrostatin-1 (2 µM) or Erastin (10 µM) into circ-TTBK2-silenced gliomacells for 48 h. The results from MTT manifested that circ-TTBK2 deficiency could enhance theErastin-induced growth reduction in LN229 andU251 cells (Figure 2E and 2F). After treatmentwith Erastin (5 µM) for 48 h, the decrease of circTTBK2 caused the acceleration of the intracellular concentrations of the iron and ferrous iron(Figure 2G-2J). Similarly, circ-TTBK2 silencingalso triggered the concentrations of intracellularlipid ROS in vitro (Figure 2K and 2L). In brief,the knockdown of circ-TTBK2 hindered cell proliferation, invasion, and reinforced ferroptosis inLN229 and U251 cells.MiR-761 Inhibition Could Restore theImpact of Circ-TTBK2 Silencing on CellPhenotypes In VitroDue to the negative correlation between miR761 and circ-TTBK2, we predicted the commonfragments between them using starBase v2.0,and the results were shown in Figure 3A. Next,Dual-Luciferase reporter analysis elucidated thatmiR-761 sharply decreased the Luciferase activity in presence of WT-circ-TTBK2 (p 0.05), butthat with the mutant reporter was not remarkablyaffected (Figure 3B and 3C). The level of circTTBK2 was significantly upregulated after circTTBK2 transfection in LN229 and U251 cells(Figure 3D). Later, we found that circ-TTBK2silencing resulted in the forceful augment ofmiR-761 level in the two glioma cells, while circTTBK2 transfection inversely modified the lev-el of miR-761 (Figure 3E). Afterwards, sh-circTTBK2 or sh-circ-TTBK2 plus anti-miR-761 wasintroduced into LN229 and U251 cells, and thereintroduction of miR-761 inhibitor could relievethe acceleratory effect of circ-TTBK2 detectionon the level of miR-761 (Figure 3F). Simultaneously, MTT analysis presented that the inhibitoryimpact of circ-TTBK2 reduction on cell proliferation was partially restored via co-transfectionwith anti-miR-761 (Figure 3G and 3H). As depicted by the analysis of transwell, cell invasion wasspecially suppressed by circ-TTBK2 detection,whereas synchronous introduction with miR-761inhibitor could reverse this effect in the two glioma cells (Figure 3I). Apart from that, we alsomeasured the alteration of ferroptosis. As described in Figure 3J and 3K, circ-TTBK2 silencing strengthened the role of Erastin in cell growthrepression, but co-transfection with anti-miR-761could rescue this effect in vitro. In addition, theboost of the intracellular iron and ferrous ironconcentrations caused by circ-TTBK2 deficiency was diminished after transfection with miR761 inhibitor in LN229 and U251 cells (Figure3L-3O). Besides, the intracellular concentrationof ROS was induced as a result of circ-TTBK2silencing, and such facilitation effect could beabrogated after simultaneous introduction withmiR-761 inhibitor in the two glioma cells (Figure 3P and 3Q). In general, miR-761 was directlytargeted by circ-TTBK2 and miR-761 inhibitionoverturned the influence of circ-TTBK2 deficiency on cell proliferation, invasion and ferroptosisin glioma cells.ITGB8 Was a Target of MiR-761In view of the foregoing introductions, weattempted to seek the protein targets of miR761. As predicted by starBase v2.0, there werecomplementary sequences between miR-761 andITGB8 (Figure 4A). Dual-Luciferase reporteranalysis indicated that miR-761 mimic declinedthe Luciferase intensity nearly 60% in wildtypegroup, but the mutant of the seed region abrogated the reduction effect of miR-761 mimic inboth LN229 and U251 cells (Figure 4B and 4C).Next, efficient augments of the mRNA and protein levels of ITGB8 were observed in gliomatissues and cells (Figure 4D-4G). Subsequently, Pearson’s correlation analysis exhibited thatthe level of miR-761 was negatively related toITGB8 level in glioma tissues (Figure 4H). Furthermore, the opposite regulation between miR761 and ITGB8 was confirmed by qRT-PCR and2589
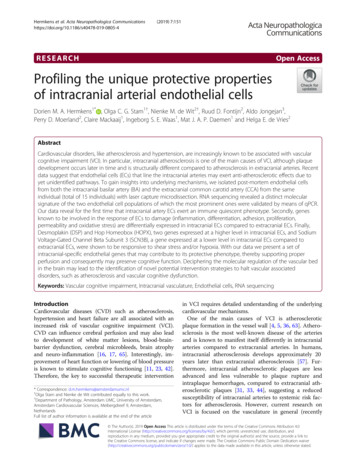
Figure 2. Knockdown of circ-TTBK2 suppressed cell proliferation, invasion and promoted ferroptosis in glioma cells. Sh-circ-TTBK2or sh-NC was introduced into LN229 and U251cells, respectively. A, QRT-PCR was implemented to examine the level of circ-TTBK2in vitro. B, and C, MTT assay was employedto identify the proliferation of the two gliomacells under circ-TTBK2 silencing. D, Cell invasion was measured utilizing transwell assay(100 ). E, and F, MTT assay was conductedto reckon the responses of LN229and U251 cells stably low-expressingcirc-TTBK2 to ferrostatin-1 (2 µM)or Erastin (10 µM).(G-L) Levels of (Gand H) total iron, (Iand J) ferrous iron,and (K and L) lipid ROS in the twoglioma cells stablylow-expressing circTTBK2 was evaluated. *p 0.05.2590
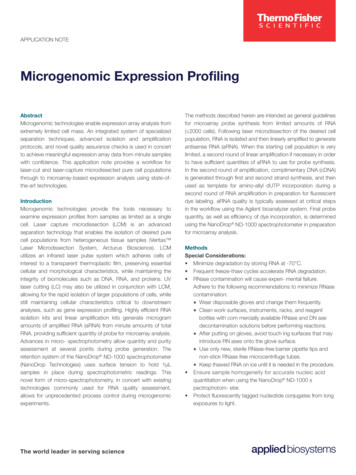
Figure 3. MiR-761 inhibition could restore the impact of circ-TTBK2 silencing on cell phenotypes and ferroptosis in vitro. A, StarBase v2.0 software was applied topredict the complementary sequence between circ-TTBK2 and miR-761. B, and C, The interrelation between miR-761 and circ-TTBK2 was confirmed using dual-luciferase reporter assay. D, The level of circ-TTBK2 was tested in LN229 and U251 cells with circ-TTBK2 transfection. E, The effect of circ-TTBK2 or sh-circ-TTBK2transfection on the level of miR-761 in glioma cells. F-Q, LN229 and U251 cells were transfected with sh-NC, sh-circ-TTBK2, sh-circ-TTBK2 anti-miR-NC, or sh-circTTBK2 anti-miR-761, respectively. F, QRT-PCR was performed to evaluate the level of miR-761 in vitro. G, and H, The effects of sh-circ-TTBK2 and anti-miR-761transfection on cell proliferation were detected by MTT in LN229 and U251 cells. I, Transwell assay was used to determine the ability of cell invasion in vitro. J, and K,MTT assay was administrated to assess the responses of glioma cells to ferrostatin (2.0 μM) and Erastin (10.0 μM).Figure continued2591
Figure 3. (Continued). L-Q, Levels of (L and M) total iron, (N and O) ferrous iron, and (P and Q) lipid ROS in LN229 and U251 cells were analyzed using iron andlipid ROS assays, respectively. *p 0.05.2592
Role of circ-TTBK2/miR-761/ITGB8 axis in the progression of gliomaWestern blot assays, and the results implied thatmiR-761 inhibitor caused the enhancement ofITGB8 level at the mRNA and protein expression, but the role of miR-761 mimic exerted thecontrary role in vitro (Figure 4I and 4J). All thedata demonstrated that miR-761 targeted ITGB8in glioma cells.Influence of MiR-761 Mimic on CellBehaviors was Relieved by ITGB8Upregulation in Glioma CellsNext, we systemically investigated the functional mechanism between miR-761 and ITGB8.Firstly, miR-761 alone or along with ITGB8 wasintroduced into LN229 and U251 cells, the level of ITGB8 was retarded by miR-761 mimic atmRNA and protein expression, but supplementwith ITGB8 regained this effect in vitro (Figure5A). Then, MTT analysis disclosed that the reintroduction of ITGB8 could recovered the inhibitory impact of miR-761 increase on cell proliferation in LN229 and U251 cells (Figure 5B and5C). Besides, cell invasion was impeded as a result of miR-761 upregulation, and such repressioninfluence could be recuperated after co-transfection with ITGB8 in the two glioma cells (Figure5D). Moreover, miR-761 mimic could expediteErastin-stimulated cell growth reduction in bothLN229 and U251 cells, while this role was reverted via reintroduction with ITGB8 (Figure 5E and5F). Meanwhile, the elevations of intracellularconcentrations of iron, Fe2 , and ROS caused bymiR-761 mimic were greatly eliminated via supplement with ITGB8 in both LN229 and U251cells (Figure 5G-5L). As a whole, the influenceof miR-761 upregulation on cell phenotypes wasabolished by ITGB8 overexpression in gliomacells.ITGB8 Was Co-Regulated by Circ-TTBK2and ITGB8Based on the above information, we attemptedto systemically clarify the regulatory mechanismbetween ITGB8 and circ-TTBK2 or miR-761. Atfirst, sh-circ-TTBK2 alone or plus anti-miR-761was introduced into LN229 and U251 cells. Themature ITGB8 level was evaluated via Westernblot assay, and the results suggested that circTTBK2 silencing led to a significant curb of thelevel of protein ITGB8, but co-transfection withmiR-761 inhibitor could partially regain this effect in the two glioma cells (Figure 6A and 6B).Namely, the level of ITGB8 was co-modulated bycirc-TTBK2 and miR-761 in glioma cells.Circ-TTBK2 Silencing Diminished TumorGrowth in Nude MiceAs mentioned above, the function of circTTBK2 was demonstrated by in vitro experiments. We further exposed how circ-TTBK2 regulated glioma growth utilizing xenograft tumormodel. As shown in Figure 7A and 7B, the knockdown of circ-TTBK2 resulted in the repressions oftumor volume and weight at the same time point.Then, effective decrease of circ-TTBK2 andITGB8, and a distinct augment of miR-761 wereobserved in sh-circ-TTBK2-mediated xenografttumors (Figure 7C). Meanwhile, Western blotanalysis implied that the protein level of ITGB8was indeed restrained in excised specimens withsh-circ-TTBK2-mediation (Figure 7D). The evidence meant that circ-TTBK2 might act as an oncogene in the progression of glioma via miR-761/ITGB8 axis.DiscussionGlioma is a leading cause of cancer-relateddeaths with refractory malignancy. Recurrenceand distal metastasis are the major barriers forovercoming this refractory malignant tumor3. Todate, molecular-associated treatment is extremely imperative in glioma cure. CircRNAs consistof non-coding RNAs, and emerging records imply that circRNAs play the critical functions incancerous progression via transcriptional or posttranscriptional regulation of targeted gene expression28,29. The ectopic expression of circRNAs istightly involved in the cell behaviors and drug-resistance of several cancer cells30,31. Hence, circRNAs may serve as the probable biomarkers forthe diagnosis, prognosis, and therapy of humancarcinomas.Zheng et al15 clarified that circ-TTBK2 wasoverexpressed in glioma tissues and cells. In thispaper, we further illustrated this elevation in glioma samples and cells compared with the corresponding controls (noncancerous tissues andNHA cells). Additionally, the reprogramming ofcellular balance is necessary for tumorigenesis,such as the modification of apoptotic and necroticcell death32,33. Notably, an oxidative iron-dependent form of regulated necrosis, ferroptosis, hasemerged as a new type of programmed death distinct from apoptosis and autophagy. Ferroptosisrefers to metabolic dysfunction that causes theglutaminolysis and the production of iron-dependent reactive oxygen species (ROS) in intracel2593
2594Figure 4. ITGB8 was a target of miR-761. A, The commonsequence between miR-761 and ITGB8 was shown. B, andC, Dual-Luciferase reporter assay was conducted to verifythe interaction between miR-761 and ITGB8 in glioma cells.D-G, The mRNA and protein levels of ITGB8 in glioma tissues and cells were analyzed. H, Pearson’s correlation analysiswas performed to analyze the correlation between miR-761 andITGB8 level in glioma tissues. I, and J, The mRNA and protein levels of ITGB8 in LN229 and U251 cells with miR-761 oranti-miR-761 transfection were examined using qRT-PCR andWestern blot assays. *p 0.05.
Figure 5. Influence of miR-761 mimic on cell behaviors and ferroptosis was relieved by ITGB8 upregulation in glioma cells. MiR-NC, miR-761, miR-761 pcDNA,or miR-761 ITGB8 was introduced into LN229 and U251 cells, respectively. A, QRT-PCR was administrated to assay the level of ITGB8 in vitro. B, and C, Cellproliferation was measured utilizing MTT assay. D, The capacity of cell invasion was evaluated by transwell assay in the two glioma cells. E, and F, MTT assay wascarried out to identify the responses of glioma cells with stably overexpression of miR-761 or ITGB8 to ferrostatin (2.0 μM) and Erastin (10.0 μM). G-L, Levels of(G and H) total iron, (I and J) ferrous iron, and (K and L) lipid ROS in the two glioma cells with miR-761 or ITGB8 transfection were reckoned via correspondingdetection kits. *p 0.05.Figure continued2595
Figure 5 (Continued). Influence of miR-761 mimic on cell behaviors and ferroptosis was relieved by ITGB8 upregulation in glioma cells. MiR-NC, miR-761,miR-761 pcDNA, or miR-761 ITGB8 was introduced into LN229 and U251 cells, respectively. A, QRT-PCR was administrated to assay the level of ITGB8 in vitro.B, and C, Cell proliferation was measured utilizing MTT assay. D, The capacity of cell invasion was evaluated by transwell assay in the two glioma cells. E, and F,MTT assay was carried out to identify the responses of glioma cells with stably overexpression of miR-761 or ITGB8 to ferrostatin (2.0 μM) and Erastin (10.0 μM).G-L, Levels of (G and H) total iron, (I and J) ferrous iron, and (K and L) lipid ROS in the two glioma cells with miR-761 or ITGB8 transfection were reckoned viacorresponding detection kits. *p 0.05.2596
Figure 6. ITGB8 was co-regulated by circ-TTBK2 and ITGB8. A, and B, The protein level of mature ITGB8 was tested byadopting Western blot in LN229 and U251 cells under sh-circ-TTBK2 or anti-miR-761 supplement. *p 0.05.lular metabolism24,25. Meanwhile, ferroptosis is amajor mediator of p53 activity when tumor suppression occurs34. Intriguingly, ferroptosis couldbe induced by drugs, such artemisinin, siramesine, and lapatinib in some cancer cells with strongresistance to apoptosis, thereby inhibiting thegrowth of these cancer cells35,36. In this project,the knockdown of circ-TTBK2 could diminishcell proliferation, metastasis, and promote ferroptosis in LN229 and U251 cells. The results documented that circ-TTBK2 acted as an oncogen
(Sigma-Aldrich, St. Louis, MO, USA). Firstly, 2 106 cells were immediately homogenized with 5 volumes of Iron Assay buffer. The insoluble material was wiped off the centrifugation at via 2 iron, 5 µl of Iron Reducer was supplemented per well. For the assay of total iron, sample wells were add - ed Iron reducer to reduce the switch from Fe3 .