Transcription
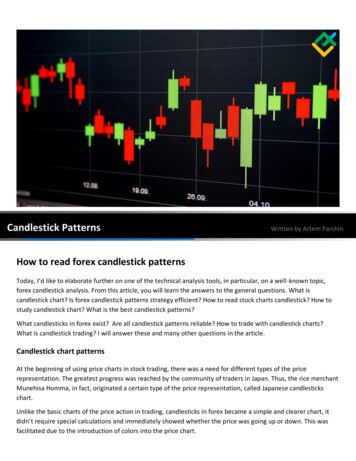
Candlestick PatternsWritten by Artem ParshinHow to read forex candlestick patternsToday, I’d like to elaborate further on one of the technical analysis tools, in particular, on a well-known topic,forex candlestick analysis. From this article, you will learn the answers to the general questions. What iscandlestick chart? Is forex candlestick patterns strategy efficient? How to read stock charts candlestick? How tostudy candlestick chart? What is the best candlestick patterns?What candlesticks in forex exist? Are all candlestick patterns reliable? How to trade with candlestick charts?What is candlestick trading? I will answer these and many other questions in the article.Candlestick chart patternsAt the beginning of using price charts in stock trading, there was a need for different types of the pricerepresentation. The greatest progress was reached by the community of traders in Japan. Thus, the rice merchantMunehisa Homma, in fact, originated a certain type of the price representation, called Japanese candlestickschart.Unlike the basic charts of the price action in trading, candlesticks in forex became a simple and clearer chart, itdidn’t require special calculations and immediately showed whether the price was going up or down. This wasfacilitated due to the introduction of colors into the price chart.
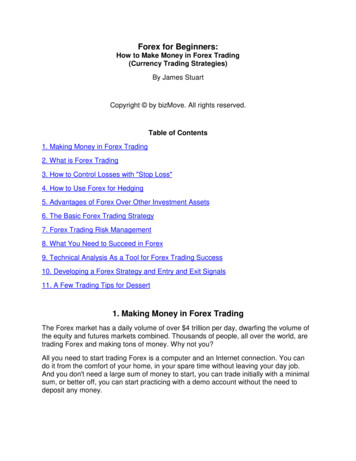
And the colors were not selected at random, rather, they resulted from associations. So, the price action,indicating the price growth, had a positive psychological impact on a person, and the bullish candle was markedwith a positive color, white. The price drop, on the contrary, had a negative influence, so it was marked withblack.The above figure shows the bar charts of the price, represented in the form of Japanese candlesticks. As you see,when the price is going up, the body of the candle is white, when it is falling down, the candlesticks are black.Aside from that, it is a common trading price chart.Japanese candles in modern technical analysis is a type of interval chart and a technical tool, mainly used todisplay changes in stock rates, commodity prices and other trading instruments. The Japanese Candlestick chart isalso called a combination of an interval and a line chart in the sense that each of its elements displays the rangeof price changes during a particular period of time.However, unlike common dots in the trading chart, the candlesticks provide much more information about theprice action in time, so it is easier to understand how to predict candlesticks charts. Candlesticks clearly relate tothe chart time periods. The time period in the trading chart is also called the Time Frame, you can learn moreabout it in one of my previous articles.
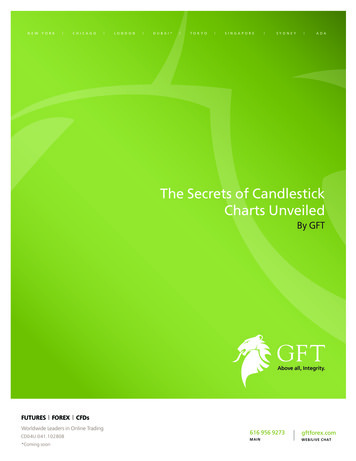
The above figure shows the elements of a candlestick. A candlestick consists of either white or black body and anupper/lower shadow (also referred to as a wick). The top of the upper shadow and the bottom of the lowershadow mark the high and the low in the corresponding time period. The top and the bottom of the candlestickbody mark the opening and the closing prices. If the price has risen in total (i.e. the closing price is higher thanthe open high), the candlestick body is white (hollow or just light-colored), the bottom of the body reflects theopening price, the top – the closing price. If the price has declined (the candlestick closes lower than its open),the body is black (filled or just dark colored). The top of the candle marks the open, the bottom- the close. Whenthe opening and the closing prices are equal, there can’t be a body. In this case, the candlestick will look like across. This candlestick type is one of the main in the candlestick analysis, but more about that is later.Modern candlestick charts can be of any colors, for example, a very popular color design employs red and green.However, the classic colors of Japanese candlesticks are black and white.Main types of candlestick patterns and candles in forexThere are quite often disputes about the names of Japanese candlesticks patterns in technical analysis. In orderto avoid participating in disputes, I’ll offer you my own interpretation of forex candle patterns names and thebasic patterns of candlestick analysis that the simplest and easier to memorize.
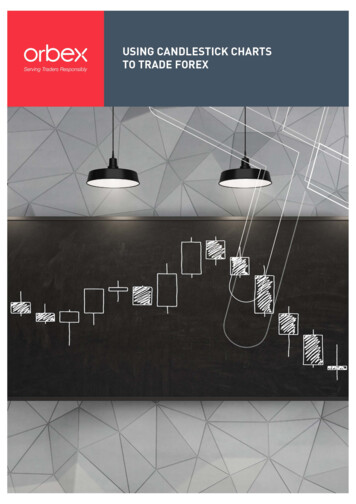
In the above figure, I pictured 12 most popular candlestick patterns that you can come across in the price chart.Let us study each of them in more detail. I’ll start with the most popular Hammer candlestick chart pattern.1. Inverted Hammer candlestick chart pattern. The formation mainly occurs at the bottom of downtrends and maysignal a potential reversal upward. However, it should be confirmed by the next candlestick that must always bewhite. The Hammer body can be black or white. An inverted hammer candlestick pattern in forex is the end of theprevious trend. This is indicated by its upper shadow. The price was rising first, but, at the end of the period,bears took the upper hand and dumped the price, thus painting the candlestick black. In fact, the candlestickindicates the last attempt of bears to dominate, and, if the next candlestick is white, it will signal that bears havelost and reg inverted hammer chart formation will be confirmed.2. The Hammer candlestick formation is viewed as a bullish reversal candlestick pattern that mainly occurs at thebottom of downtrends. It features a short body (black or white), located in the top part of the price range duringthe session, and a very long lower shadow. Like with the previous formation, the Hammer candlestick chartpattern should be confirmed by the next candlestick that must always be white. The price was sliding down atfirst, but, at the end of the period bulls prevailed and drew the price up, thus painting the candlestick white. Theformation basically indicates the last attempt of bulls to take the upper hand, and, if the next candle is white, itwill signal bulls to win and the hammer candlestick pattern will be valid.3. Hanging Man candlestick pattern. This is a candlestick formation that looks like a hammer but it occurs onlyduring an uptrend and warns that prices may start falling. In order for the pattern to be valid, the candle
following the hanging man must be black. The price was sliding down at first, but, at the end of the period bullsprevailed and drew the price up, thus painting the candlestick white. The hanging man formation is a bearishreversal pattern that basically indicates the last attempt of bulls to take the upper hand, and, if the next candle isblack, this will confirm that the bears took the control and the candle is valid.4. Shooting Star candlestick chart pattern. This candlestick formation looks like an Inverted Hammer but occurs onlyduring an uptrend and indicates the price may start falling. For a Shooting Star candlestick to be valid, the patternshould be confirmed by the next candlestick that must be black. The price was growing first, but, at the end of theperiod, bears started to take over and drew the price down. However, their pressure wasn’t enough to paint thecandlestick black, and it remained white with a long upper shadow. It is basically a bearish reversal pattern anddisplays the last attempt of bears to gain the control, which failed. However, if the following candlestick is black itwill signal the bears to overtake in the global trend, and the formation is valid.5. The Morning Star is a pattern seen in a candlestick chart, which is included into an extended group of candlestickchart patterns, referred to as “Stars”. A Morning Star, unlike a Shooting star pattern, doesn’t have a long body. Itis a common candlestick with a small body that occurs after a downtrend and indicates that an uptrend maybegin. The price was falling at first, but, at the end of the period, bears lost their power and they only could getthe price to draw a small candlestick. If the following candlestick is white, it will indicate that bulls have won inthe end and the pattern is valid.6. Evening Star. It is basically a bearish reversal pattern An evening star looks like a reversed morning star pattern. Itmostly occurs after an uptrend and indicates that the price could start falling. At first, the price is rising, but at theend of the period, bulls lose their power and there is only a small candlestick that, by the way, must always beblack. And, if the following candlestick is black, this will signal that bulls have lost in the end and bears have takenthe upper hand, and so, the Evening Star Pattern is valid.7. Abandoned Baby candlestick pattern. This candlestick formation is also included into the group of Stars. It lookslike a morning star but there is one important difference. The second bar is a doji candle. A doji candlestick has nobody, differently put, it represents the balance of buyers and sellers. The trend is downward, but at the end ofthe period, bulls and bears are fighting for the control over the market situation, but neither of the sides takesover in the end, so a doji candle emerges. If the doji is followed by a white bar, it will indicate that bulls have wonin the global trend, and the bullish abandoned baby is valid.8. Harami candlestick pattern. When the harami pattern appears, it depicts a condition in which the market is losingits steam in the prevailing direction and the trend is about to reverse. It a rather strong reversal signal, as itincludes such signal confirmation as a price gap. A harami candlestick pattern may be both bullish and bearish,the candlestick may also be either hollow or filled (white or black), and sometimes, it can even be a doji. Theharami candlestick consists of a small body and short shadows. Its main features are two signs. The Harami bodyand shadows must be within the prior candlestick’s bod. There must the price gap between the prior close andthe harami open. If all these conditions are satisfied, the candlestick formation is a harami.9. Bullish Engulfing is a two-candle reversal pattern. So, the formation is often referred to forex candlestickpatterns. The Engulfing formation is very simple. It can be either a bullish candlestick pattern or bearish. Thedifference is in the color of the second bar in the pattern. The bullish engulfing candlestick pattern is a bullishreversal pattern, usually occurring at the bottom of a downtrend. The second candle completely covers ‘engulfs’the body of the first one. This formation is widely applied in the classical stock trading in the U.S. The BullishEngulfing pattern appears in a downtrend and one of the strongest reversal signals.10. Bearish Engulfing pattern is the opposite to the previous forex candlestick formation that occurs at tops ofuptrends. It is basically a bearish reversal pattern. Accordingly, the second candle in the formation is black. All theengulfing conditions must satisfied, like in the previous example.
11. A Harami cross is a Japanese candlestick pattern, referred to stars, which consists of a large candlestick followedby a small doji candlestick. The formation is sometime called a Doji Star candlestick pattern. All the conditions tovalidate this pattern are the same as for a normal harami. A harami cross signal is thought to be a more reliablecandlestick pattern than a common harami.12. Gravestonedoji is a candlestick that looks like a shooting star but without a body. It indicates that the price couldreverse and start falling. A candlestick is a gravestone doji if it is followed by a black candlestick. It usually occursin an uptrend, but at the end of the period, bears took the upper hand and pressed the price down to the baropen level. Basically, a gravestone doji is a bearish reversal candlestick pattern that indicates the last attempt ofbulls to gain the control, that was completely covered by bears’ attack. And, if the following candlestick is black, itwill mean that bears have won in the end, and the formation is valid.Basic Candlestick Chart PatternsThis part will deal with the concept of a candlestick chart patterns. I quite extensively described this issue in oneof my previous articles, so I won’t explain such candlestick patterns as Volume Candlestick, Tower, Three Crowscandlestick pattern or Diamond candlestick chart pattern here. I would rather offer you to study a unique, originalpattern that isn’t mentioned anywhere else.Pin Bar PatternA pin bar pattern is a candlestick pattern that consists of a single candlestick. Everybody has seen thesecandlesticks in the price chart, but many just don’t understand their true meaning. I do not pretend that myunderstanding is the only correct one, but, as I said earlier, my articles are based on my personal practicalexperience of many years.Well, you won’t come across a pin pattern in classical candlestick analysis. A pin bar price action pattern is asingle candlestick with a very small or no body and a very long shadow. The pattern can be both in an uptrendand a downtrend. The candlestick principle is similar to that of the Volume Candlestick, I described earlier. Theconstruction principle of the pin is similar, it is the fight of bulls and bears inside one bar. First, there is a strongattack of one power, followed by the counter attack of the other one that eventually results in a balance. It wouldseem that is all for the fight, but the counter-attackers, as a rule, haven’t not spend all their forces, and in thefollowing periods of time, they attack again and win. Now, let us see it in practice.
You enter a sell trade when the candlestick, following the finished pin bar, is complete (Sell zone). A target profitis set at the distance, not longer than the total length of the pin and the following candlestick (Profit zone). Areasonable stop loss, in this case, is set a distance, equal or longer than half of the target profit size (Stop zone).What should be added? There is a number of rules that must be observed to employ the pattern efficiently andavoid common mistakes.1. In the normal form, the pattern is a candlestick with a very small or no body. In this case, the shadow must be atleast ten times longer than the body.
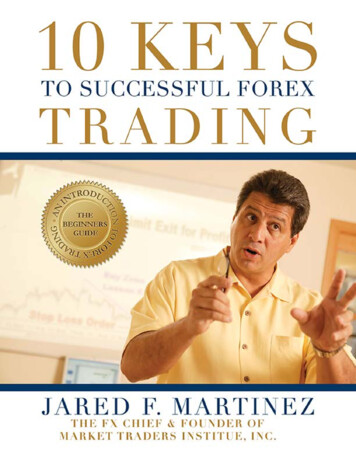
2. Sometimes, to avoid unreasonable risk, you’d better enter a trade only at the level of the pin bar close, after thesecond bar is complete.3. The pattern is most efficient in the D1 timeframe. In shorter timeframes, the pattern hasn’t been much tested,and the result was rather worse.Technical analysis of candlestick chartIn this part, I will deal with how to read forex candlestick charts and how to trade candlestick patterns thatemerge there.The above figure represents a part of the EURUSD price chart in the H4 timeframe. Most of newbies believe that,if the candlestick patterns work, they are difficult to identify in the chart, and they don’t often appear. Beginnertraders are afraid that it will take a long time to identify at least a single pattern or a candlestick formation. Fromthis part, you’ll learn what the real thing are. This is already can be referred to advanced technical analysis. In theabove figure, I presented my all candlestick patterns trading strategy.Well, following just a brief overview, I have found 13 clear candlestick patterns. Of course, there are much moreof them, but I spent just a minute. If you analyze the chart for 10 minutes, you can see up to 20 candlestickformations in the chart.I will describe each of the candlestick patterns identified in turn. To make the chart clearer, I divided it in twoparts
1. Volume Candlestick pattern (all conditions are satisfied and the pattern worked out);2. Volume Candlestick pattern (now in the uptrend, but it makes no difference for this pattern);
3. Bullish Engulfing pattern (in this case, there is also an Inverted Hammer, preceding the engulfing. A double signalthat worked out);4. Pin Bar pattern (the pin is directed upside, it worked out some time later);5. A Gravestone Doji (can be interpreted as a Shooting Star, it doesn’t make any difference here, in fact);6. A Bullish Engulfing pattern (A very strong engulfing that was immediately continued with an uptrend);7. A Bearish Engulfing pattern (it worked out on the next bar);8. A Volume Candlestick pattern (a classical example, and it again 100% worked out on the next bar already);9. A Gravestone Doji (It can be also interpreted as a Shooting Star. The signal worked out very quickly);
10. A Bullish Engulfing pattern (A very strong engulfing that expectedly resulted in a soon price rise)11. A Volume Candlestick pattern (In this case, it worked out in a longer time, but the result met all the expectations);
12. An Abandoned Baby candlestick pattern (It is a rare pattern, but also emerged in the chart. It 100% worked out,yielding a good result);As you see, there are plenty of candlestick patterns in any chart, you only need to interpret them correctly.In conclusion, I’d like to add that only the official list includes more than 150 recognized candlestick price chartpatterns, and there are much more of individual ones, both reversal and continuation patterns. If you havediscovered your own price chart pattern, you have every right to employ it. It is only important that you mustalways interpret it according to the rules without any exceptions. Any exception or acceptance may inevitablyresult in you losing money. In general, the indicators of candlestick analysis send quite accurate signals. That iswhy, the U.S. stock trades take their trading decisions based on mostly technical analysis of candlestick chartpatterns. And the fans of technical progress even write the guides about how to read candlestick charts crypto.But that's another story.Useful links:I recommend trying to trade with a reliable broker here. The system allows you to trade by yourself or copysuccessful traders from all across the globe.Telegram channel with high-quality analytics, Forex reviews, training articles, and other useful things for tradershttps://t.me/liteforexThe content of this article reflects the author’s opinion and does not necessarily reflect the official position ofLiteForex. The material published on this page is provided for informational purposes only and should not beconsidered as the provision of investment advice for the purposes of Directive --------------Follow us on
candlestick pattern. This is a candlestick formation that looks like a hammer but it occurs only during an uptrend and warns that prices may start falling. In order for the pattern to be valid, the candle . LiteForex: How to rea