Transcription
Free to NACE membersAPRIL 2016JOB OUTLOOK2016SPRING UPDATENATIONAL ASSOCIATION OF COLLEGES AND EMPLOYERS62 Highland Avenue Bethlehem, PA 18017-9085 610.868.1421 www.naceweb.org
TABLE OF CONTENTSAbout the Survey. 3College Hiring to Increase 5.2 Percent. 4Figure 1: Job Outlook hiring projections, 2011 – 2016Figure 2: Hiring plansFigure 3: Job postings and applications downDegrees and Majors in Demand. 6Figure 4: Hiring expectations by degree level for 2016Figure 5: Actual hiring by degree level for 2015Figure 6: Hiring expectations by majorCareer Readiness Competencies . 8Figure 7: Employers rate career readiness competencies in terms of essential need (2016 vs. 2015)Spring 2016 Recruiting Plans. 10Figure 8: Spring 2016 recruitingFall 2016 Recruiting for the Class of 2017. 11Figure 9: Expectations for fall 2016 compared with expectations for fall 2015 and 2014Appendix. 12Figure 10: Respondents by type of organizationFigure 11: Respondents by size of companyFigure 12: Respondents by industrySurvey Respondents 2016 National Association of Colleges and Employers. All rights reserved.2 Job Outlook 2016 Spring Update National Association of Colleges and Employers
ABOUT THE SURVEYABOUT THE SURVEYThe Job Outlook 2016 Spring Update survey was conducted from February 10 – March 22, 2016; the survey was sent to 944NACE employer members; 144, or 15.3 percent, responded. The survey updates hiring projections for the Class of 2016;those projections were collected from NACE employer members from August 5 – September 13, 2015, and reported in the JobOutlook 2016 report, published in November 2015.By region, 22.9 percent of respondents are from the Northeast, 27.8 percent are from the Southeast, 33.3 percent are from theMidwest, and 16.0 percent are from the West. For additional information about the respondents, see the Appendix.Data are calculated based on the number of respondents to each specific question. Totals may not equal 100 percent due torounding.RESEARCH TEAM:Director of Research, Public Policy, and Legislative Affairs: Edwin W. KocResearch Manager: Andrea J. KonczResearch Associate: Kenneth C. TsangResearch Associate: Louisa EismannResearch Assistant: Anna LongenbergerNational Association of Colleges and Employers Job Outlook 2016 Spring Update 3
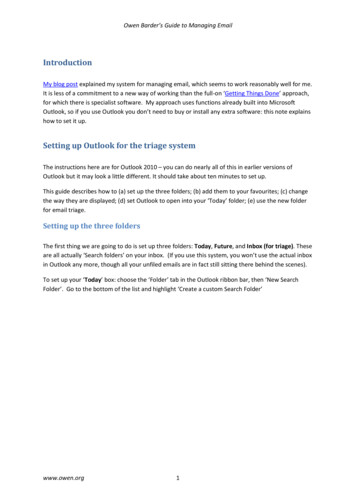
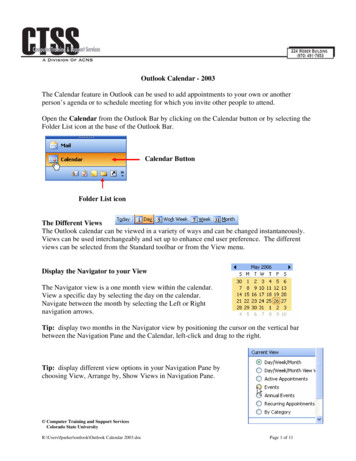
COLLEGE HIRINGCOLLEGE HIRING TO INCREASE 5.2 PERCENTEmployers expect to hire 5.2 percent more new graduates from the Class of 2016 than they hired from the Class of 2015.While hiring activity for the college Class of 2016 is positive, the current hiring projections are down from the 11 percentincrease employers originally reported through the Job Outlook 2016 survey, results of which were published in November2015. (See Figure 1.)Figure 1 JOB OUTLOOK HIRING PROJECTIONS, 2011 – 2016*2019.3%FALLSPRING 505.2%2.1%201120122013201420152016* Please note: Classes of 2014, 2015, and 2016 projections are for U.S. locations only. Prior years’ projectionsare shown for informational purposes only, and should not be compared to projections for 2014, 2015, and 2016.4 Job Outlook 2016 Spring Update National Association of Colleges and Employers
COLLEGE HIRINGMuch of the change can be attributed to a larger portion of employers reporting plans to trim hiring. Just 13.2 percent ofrespondents originally reported plans to hire fewer 2016 graduates than they did 2015 graduates; currently, more than onethird say that is the case. (See Figure 2.)Figure 2 HIRING PLANSPercentIncreasing HiresPercentMaintaining HiresPercentDecreasing HiresTotal Number ofRespondentsSpring Update 201640.9%22.0%37.1%132Job Outlook 2016 (Fall 2015)40.1%46.7%13.2%201Spring Update 201555.9%11.8%32.2%152Job OutlookAdditionally, the average number of job postings for the 2015-16 recruiting year is down compared to the 2014-15 year, whilethe average number of applications per posting remains fairly consistent between the years. (See Figure 3.)Figure 3 JOB POSTINGS AND APPLICATIONS DOWNAverage Number ofJob PostingsAverage Number ofApplications per 2-1310618.42011-1211632.62010-1110521.1Recruiting YearNational Association of Colleges and Employers Job Outlook 2016 Spring Update 5
DEGREES AND MAJORSDEGREES AND MAJORS IN DEMANDAmong those reporting plans to hire, all say they are seeking bachelor’s degrees graduates, three-fifths are looking for master’sdegree graduates, and nearly one-half have positions for M.B.A. graduates. That breakdown is fairly consistent with thedegrees these respondents hired from the Class of 2015. (See Figures 4 and 5.)Figure 4 HIRING EXPECTATIONS BY DEGREE LEVEL FOR 2016Degree LevelAverage Percent ofNew College HiresNumber ofRespondents HiringPercent of TotalRespondents .0%M.B.A.13.2%5349.1%Master’s (Other than M.B.A.)14.1%6560.2%Ph.D.13.1%1715.7%Figure 5 ACTUAL HIRING BY DEGREE LEVEL FOR 2015Degree LevelAverage Percent ofNew College HiresNumber ofRespondents HiringPercent of TotalRespondents %M.B.A.11.1%5152.6%Master’s (Other than M.B.A.)14.3%5556.7%6.5%2020.6%Ph.D.6 Job Outlook 2016 Spring Update National Association of Colleges and Employers
DEGREES AND MAJORSGiven the mix of employers holding NACE membership, it is not surprising that respondents expressed most interest in hiringengineering, business, computer science, and accounting majors. (See Figure 6.)Figure 6 HIRING EXPECTATIONS BY MAJORAcademic DisciplineNumber of RespondentsHiring DisciplinePercent of Total RespondentsHiring DisciplineAverage Percent of TotalNew Recruits 3.7%33.5%Computer s3427.4%9.3%Physical Sciences3024.2%9.8%Communications3024.2%7.4%Misc. Majors2318.5%16.8%Social 86.5%72.9%Agriculture75.6%8.9%Health Sciences64.8%16.7%* Of the eight respondents who are hiring education degrees, six recruit education majors exclusively, and education majorswill comprise 100 percent of their total new recruits.National Association of Colleges and Employers Job Outlook 2016 Spring Update 7
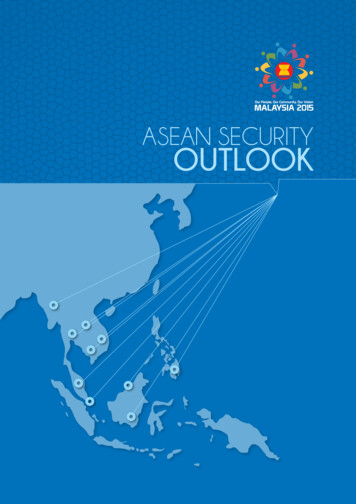
CAREER READINESSCAREER READINESS COMPETENCIESNACE’s seven careerreadiness competenciesIn October 2015, NACE released itsrepresent those skills,definition of and competencies associated with career readiness.experiences, and attributesthat broadly prepare students(See ncies.aspx.)for a successful transition intoThe competencies are based, in large part, on information employersthe work force. (See page 9provided through the annual Job Outlook survey over more than a decade.for the competencies and theirdefinitions.) Employers of newcollege graduates seek suchcompetencies in their new hires as these enable new hires to use the knowledge they have acquired through their course ofstudy effectively in the workplace. To gauge the relative importance of each of the seven competencies to hiring organizations,NACE asked employers to rate them in terms of “essential need.”As Figure 7 illustrates, four of the competencies—critical thinking/problem solving, professionalism/work ethic, teamwork,and communications skills—rise to the top. These results are consistent with those posted a year ago, indicating that thesecompetencies are virtual “must haves.”Figure 7 EMPLOYERS RATE CAREER READINESS COMPETENCIESIN TERMS OF ESSENTIAL NEED (2016 VS. 2015)Essential Need RatingCompetency20162015Critical Thinking/Problem Solving4.74.7Professionalism/Work Ethic4.74.5Teamwork4.64.6Oral/Written Communications4.44.4Information Technology Application3.93.9Leadership3.93.9Career Management3.63.6*Weighted average. Based on a 5-point scale where1 Not essential, 2 Not very essential; 3 Somewhat essential; 4 Essential; 5 Absolutely essential8 Job Outlook 2016 Spring Update National Association of Colleges and Employers
CAREER READINESSNACE Career Readiness Competency*DefinitionCritical Thinking/Problem SolvingExercise sound reasoning and analytical thinking; obtain, interpret, and useknowledge, facts, and data to analyze situations, make decisions, and solveworkplace problems; and demonstrate originality and inventiveness in work.Oral/Written CommunicationsArticulate thoughts, ideas clearly and effectively with persons inside andoutside of organization; demonstrate public speaking skills; and communicatenew ideas to others; write/edit memos, letters, and complex technical reportsclearly and effectively.Teamwork/CollaborationBuild collaborative relationships with colleagues and customers representingdiverse cultures, races, ages, genders, religions, lifestyles, and viewpoints;be able to work within team structure; and be able to negotiate and manageconflicts.Information Technology ApplicationSelect and use appropriate technology to accomplish a given task and applycomputing skills to problem solving.LeadershipLeverage the strengths of others to achieve common goals; use interpersonalskills to coach and develop others; demonstrate ability to assess and manageone’s own emotions and those of others, using empathetic skills to guide andmotivate; and prioritize and delegate work.Professionalism/Work EthicDemonstrate personal accountability, effective work habits, e.g. punctuality,working productively with others, and workload management, and understandimpact of non-verbal communication on professional work image; demonstrateintegrity and ethical behavior; act responsibly with the interests of the largercommunity in mind; and be able to learn from one’s mistakes.Career ManagementIdentify and articulate one’s skills, strengths, knowledge, and experiencerelevant to position desired and career goals; identify areas necessary forprofessional growth; be able to navigate and explore job options and how totake the steps necessary for pursuing opportunities; and understand how toself-advocate for opportunities in the workplace.*See ncies.aspx.National Association of Colleges and Employers Job Outlook 2016 Spring Update 9
SPRING RECRUITINGSPRING 2016 RECRUITING PLANSAlthough the overall increase in college hiring is smaller than was originally predicted, most respondents expect to recruitthis spring.Almost 86 percent of respondents have plans to be on campus to hire interns/co-ops and/or full-time hires. (See Figure 8.) Asthis and other results shown in Figure 8 suggest, current respondents seem to have been more cautious about their overallhiring than were their counterparts last year, as they were somewhat more likely to leave a portion of their hiring to thespring (86 percent in 2016 versus 80 percent in 2015).Figure 8 SPRING 2016 RECRUITINGNumber of 2016RespondentsPercent of 2016RespondentsNumber of 2015RespondentsPercent of 2015RespondentsFull-time, Only129.6%127.5%Intern, Only1411.2%2515.6%Both Intern & 8%10.6%125100.0%160100.0%On-campus Presence – Not HiringNo Presence – Hired During FallNot Hiring This YearTotal10 Job Outlook 2016 Spring Update National Association of Colleges and Employers
FALL RECRUITINGFALL 2016 RECRUITING FOR THE CLASS OF 2017What is ahead for the Class of 2017 ?Many employers “front load” their recruiting, concentrating much of their recruiting in the fall to secure hires who will graduatelater in the year (typically December and May). Asked to project their fall 2016 recruiting plans, responding employers appearto be proceeding with caution.Nearly half expect to hire the same number of Class of 2017 graduates in fall 2016 as they did in fall 2015, while less thanone-third think they will hire more. In contrast, employers reporting their plans for fall 2015 and in fall 2014 reported moreaggressive hiring plans. (See Figure 9.)Figure 9 EXPECTATIONS FOR FALL 2016 COMPARED WITH EXPECTATIONS FOR FALL 2015 AND 2014Number of 2016RespondentsPercent of 2016RespondentsHire More3729.6%35.8%42.9%Hire Fewer97.2%8.6%3.2%Hire .0%100.0%100.0%TotalNumber of 2015RespondentsPercent of 2015RespondentsLater this summer, NACE will collect data from employers on their initial hiring plans for the upcoming Class of 2017. Thosehiring projections will be reported in late fall 2016.National Association of Colleges and Employers Job Outlook 2016 Spring Update 11
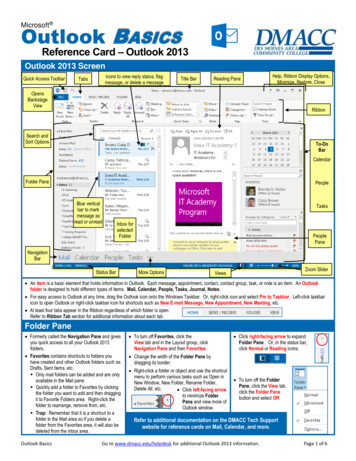
APPENDIXAPPENDIXFigure 10 RESPONDENTS BY TYPE OF ORGANIZATIONPercent ofRespondentsOrganization TypeFor Profit, Publicly Held50.8%For Profit, Private44.4%Nonprofit4.0%Government Agency0.8%Figure 11 RESPONDENTS BY SIZE OF COMPANY2.3%0.8%3.8%4.6%5.4%Number .6%501–1,0001,001–5,0005,001–10,00015.4%More than 10,00012 Job Outlook 2016 Spring Update National Association of Colleges and Employers
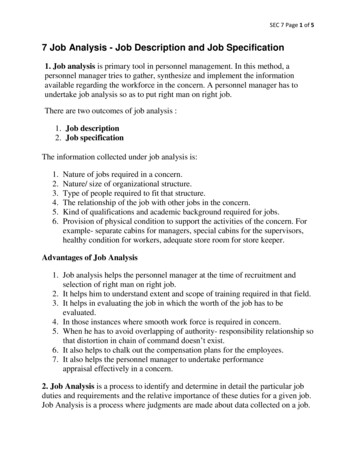
APPENDIXFigure 12 RESPONDENTS BY INDUSTRYNumber ofRespondentsIndustryPercent ofRespondentsOil & Gas Extraction42.8%Utilities64.2%Construction74.9%Food & Beverage Manufacturing42.8%117.6%Computer & Electronics Manufacturing74.9%Motor Vehicle Manufacturing74.9%1913.2%Wholesale Trade32.1%Retail 9%Accounting Services42.8%Engineering Services64.2%Management Consulting53.5%117.6%Social Services96.3%Recreation & Hospitality10.7%Misc. Support Services32.1%Government10.7%144100.0%Chemical (Pharmaceutical) ManufacturingMisc. ManufacturingFinance, Insurance, & Real EstateMisc. Prof. ServicesTotalNational Association of Colleges and Employers Job Outlook 2016 Spring Update 13
SURVEY RESPONDENTSSURVEY RESPONDENTSThe following organizations took part in the NACE Job Outlook 2016 Spring Update survey.(Note: Although 144 organizations responded, the list below includes 98, as 46 organizations preferred not to be listed.)ABB Inc.ENERCON Services, Inc.Pacific Gas and Electric CompanyAeroVironmentEntergy Services, Inc.Parsons CorporationAir Products & Chemicals Inc.EquinixPerformance Assessment Network (PAN)Alcatel-LucentExcella ConsultingPolaris Industries, Inc.ALCOA Inc.ExxonMobil CorporationPrincipal Financial GroupAmerican Axle &Manufacturing Holdings, Inc.FirstBank Holding Co.Protiviti Inc.Fluor Corporation - Global RecruitingPVHARAMARKGovig & Associates, INC - GovigUQuestar CorporationAscend Performance MaterialsGreat Lakes Dredge & Dock CompanyRockwell CollinsAsurion CorporationGROWMARK, Inc.RosettaBaker Tilly Virchow KrauseHNTB CompaniesRoux Associates, Inc.Brady Corp.Imagine Leadership AcademyRural Sourcing Inc.Briggs & Stratton CorporationInfineum USA L.P.SapientNitroBurlington StoresInternational SOS Assistance Inc.Seagate TechnologyBurns & McDonnell Engineering Co. Inc.Intuit Inc.Sears Holdings CorporationCalifornia State AuditorJohnson & JohnsonSelden Fox LTDCambridge Associates LLCkCuraShaw Industries, Inc.Cardinal HealthKearney & CompanySouth Jersey IndustriesCarrollton-Farmers Branch ISDKiewit Energy GroupSouthern California EdisonCaterpillar Inc.KPMG LLPSpectra Energy Corp.CGI FederalLake Shore Cryotronics, Inc.SRC, Inc.ConAgra Foods, Inc.LB White Co.SUN Automation Inc.ConocoPhillips CompanyLiberty Mutual Insurance CompanyTeradata CorporationDick’s Sporting GoodsMacy’s, Inc.The Lane Construction CorporationDiscover Financial ServicesMars, IncorporatedThe Nielsen CompanyDoeren MayhewMAVERICK TechnologiesThe Northern Trust CompanyDuff & Phelps LLCMedical Mutual of OhioThe Vanguard GroupDuke Energy CorporationMeijer, Inc.TIBCO Software Inc.E. & J. Gallo WineryMetroStar SystemsToys “R” Us, Inc.Ecolab Inc.Modern Woodmen of AmericaTurner Construction CompanyEdward JonesOlin Chlor Alkali ProductsUnion Pacific Railroad CompanyElizabeth City Pasquotank Public SchoolsOrange County SchoolsUnitedHealth GroupEmerson Climate TechnologiesOwens CorningWalgreens14 Job Outlook 2016 Spring Update National Association of Colleges and Employers
62 HIGHLAND AVENUEBETHLEHEM, PA 18017-9085610.868.1421 www.naceweb.org
Spring Update 2016 40.9% 22.0% 37.1% 132 Job Outlook 2016 (Fall 2015) 40.1% 46.7% 13.2% 201 Spring Update 2015 55.9% 11.8% 32.2% 152 Figure 3 JOB POSTINGS AND APPLICATIONS DOWN Recruiting Year Average Number of Job Postings Average Number of Applications per Posting 2015-16 67 22.7 2014-15 148 23.4 2013-14 99 28.4 2012-13 106 18.4 2011-12 116 32.6