Transcription
EDUCATION POLICY PRO GRAMRE S E AR CH RE P O R TUnderwater on Student DebtUnderstanding Consumer Credit and Student Loan DefaultKristin BlaggAugust 2018
AB O U T T HE U R BA N I NS T I T U TEThe nonprofit Urban Institute is a leading research organization dedicated to developing evidence-based insightsthat improve people’s lives and strengthen communities. For 50 years, Urban has been the trusted source forrigorous analysis of complex social and economic issues; strategic advice to policymakers, philanthropists, andpractitioners; and new, promising ideas that expand opportunities for all. Our work inspires effective decisions thatadvance fairness and enhance the well-being of people and places.Copyright August 2018. Urban Institute. Permission is granted for reproduction of this file, with attribution to theUrban Institute. Cover image by Thanakorn.P/Shutterstock.
ContentsContentsiiiAcknowledgmentsivExecutive SummaryvUnderwater on Student Debt1Data and Methods2Patterns of Student Loan Default6Characteristics of Defaulters9Predicting the Likelihood of Default15Credit Effects of Default and Recovery17Policy Recommendations23Conclusion26Appendix A. Additional Figures27Notes34References35About the Authors37Statement of Independence38
AcknowledgmentsThis report was funded by Smith Richardson Foundation. We are grateful to them and to all our funders,who make it possible for Urban to advance its mission.The views expressed are those of the author and should not be attributed to the Urban Institute, itstrustees, or its funders. Funders do not determine research findings or the insights andrecommendations of Urban experts. Further information on the Urban Institute’s funding principles isavailable at urban.org/fundingprinciples.I thank Matthew Chingos, Sandy Baum, Erica Blom, Jason Delisle, Preston Cooper, CodyChristensen, and Judith Scott-Clayton for helpful comments on earlier drafts of this report.IVACKNOWLEDGMENTS
Executive SummaryEven with a multitude of repayment and debt deferment options, about 250,000 federal direct loanborrowers see their loans go into default every quarter, and an additional 20,000 to 30,000 borrowersdefault on their rehabilitated federal student loans. In this report, I describe the relationship between aborrower’s credit profile and student loan default in a nationally representative sample of student loanborrowers, over the first four years of repayment.My results indicate that the likelihood of student loan default is positively correlated with holdingother collections debt (e.g., medical, utilities, retail, or bank debt). About 59 percent of borrowers whodefaulted on their student loans within four years had collections debt in the year before enteringstudent loan repayment (compared with 24 percent among nondefaulters). Those who will default ontheir student loans are more likely to reside in neighborhoods that have more residents of color andfewer adults with a bachelor’s degree or higher, but a borrower’s personal credit profile is a strongerpredictor of default than the neighborhood where she resides.Borrowers experiencing a student loan default see an average credit score drop of about 50 to 90points in the year or two before the default. But those who default typically have poor to fair creditscores, even in the year before entering student loan repayment. Borrowers who default make lessprogress than nondefaulters in paying down their student loans (as a share of the initial balance),though those with smaller balances (less than 5,000) make more progress than those with higherbalances ( 20,000 or higher), a trend that also holds true among nondefaulters.These findings point to several policy recommendations: Investigate the effect of debt and collections obligations on student loan repayment.Borrowers who default are more financially distressed by other collections debt thannondefaulting borrowers in their cohort. In these circumstances, borrowers might rationallyaddress or pay down other debt obligations before addressing their student loans.Policymakers and researchers should gather more information on borrowers’ financialcircumstances at the point of default. Use credit scores to better target student loan repayment assistance. Federal student loansgenerally do not require underwriting, and a low credit score should not keep a student fromgetting a loan—indeed, these borrowers might benefit most from access to credit to enroll inhigher education. Instead, credit scores could be used as an impartial way to provide additionalassistance for borrowers at a higher risk of default as they enter repayment.EXECUTIVE SUMMARYV
Consider reshaping the way deferred, delinquent, and defaulted loans increase a borrower’stotal student loan balance. Interest on a student loan is designed as an incentive for borrowersto begin paying down their loan. But many borrowers put their loans into deferment orforbearance, or do not make payments, thus rather than paying down their debt, they quicklybuild up additional debt. Policymakers should reexamine the ways interest and fees accrue onstudent loan debt and consider adjustments that encourage, rather than discourage,repayment. Focus on discharge remedies that reach the highest-need borrowers. Few student loanborrowers file for bankruptcy. Making it easier to discharge student loans in bankruptcy willlikely not provide relief for borrowers who do not have the time or funds to go through thebankruptcy process. Policymakers who want to provide relief for the most distressedborrowers should consider other measures of a borrower’s inability to make payments. Forexample, policymakers could consider a full or partial discharge of loans for borrowers with arecord of spending several years in a social safety net program, such as the SupplementalNutrition Assistance Program or Temporary Assistance for Needy Families, after leavingschool. Develop better measures of student loan acquisition and repayment. The cohort model oftracking student loan repayment is valuable and is employed in this paper. But the diversity ofpaths a borrower can take in managing her student debt means that following only one cohortof borrowers fails to tell the whole story. For example, many borrowers avoid default butprolong repayment through multiple deferment and repayment options. Researchers andpolicymakers should consider new ways to segment and analyze student loan borrowers, suchas by default behavior or by the use of deferment and forbearance.VIEXECUTIVE SUMMARY
Underwater on Student DebtRoughly a quarter million federal direct loan borrowers see their loans go into default for the first timeevery quarter, and an additional 20,000 to 30,000 borrowers default on their rehabilitated studentloans.1 These defaults occur even though borrowers can put their loans into deferment or forbearance,and nearly all federal loan borrowers can take advantage of income-driven repayment plans that allowborrowers with incomes below 150 percent of the federal poverty level to make payments of 0.Previous research shows that the probability of a student loan default is higher for certainborrowers. Borrowers who go to for-profit schools and those who leave school without obtaining adegree are most likely to default (Hillman 2014; Looney and Yannelis 2015). Students from low-incomefamilies are also more likely than others to default (Herr and Burt 2005; Steiner and Teszler 2005).Students of color, particularly black students, have a higher probability of default than their whitepeers, and black borrowers tend to hold more debt than white borrowers, even after holding theborrower’s family resources and other factors constant (Addo, Houle, and Simon 2016; Grinstein-Weisset al. 2016; Jackson and Reynolds 2013; Scott-Clayton 2018).Compared with the amount of research conducted on the socioeconomic, demographic, andinstitution-level factors affecting student loan defaults, researchers have conducted less research onthe noneducation debts that student loan borrowers hold or the approach that student loan borrowersmay take toward managing their debt. Undergraduate students who are financially at risk because ofhigh credit card debt or credit card delinquency tend to have higher student loan balances whileenrolled in school, and these students tend to predict that they will pay off credit cards before studentloans (Pinto and Mansfield 2006). Borrowers who are delinquent on student loans are also more likelyto be delinquent on credit card, auto, and mortgage debt relative to nondelinquent borrowers (Brown etal. 2015).In this analysis, I describe the correlates and consequences of student loan default in a nationallyrepresentative sample of student loan borrowers over the first four years of repayment. I provide dataon the different types of debt borrowers hold in the first year of student loan repayment to understandthe credit profiles of borrowers who let their loans go into default relative to those who stay current ormake late payments (i.e., delinquency). I show which credit-based factors are the most predictive ofdefault in the four years after entering repayment. Finally, I show the credit consequences of studentloan default and illustrate the changes in overall debt composition among borrowers who do and do notdefault.
Data and MethodsI use deidentified longitudinal data from one of the nation’s three national credit bureaus. These dataare a random 2 percent sample of US consumers with a credit record and are available for seven years(captured each August from 2010 to 2016). Each borrower’s student loans are collapsed into a singleset of data points, indicating the value of student loans that are in deferment, in repayment, and incollections (I do not have access to individual “tradelines,” or loan-level data on amount owed anddelinquency of each separate loan). These student loans include debt incurred for any educationalprogram, which could include both undergraduate- and graduate-level debt and debt acquired forchildren or grandchildren (e.g., Parent PLUS Loans). About 10 to 15 percent of federal loan borrowerswere the recipients of Grad PLUS or Parent PLUS loans in the past five years (Baum et al. 2017). Thesestudent loan records also include both private and federal student loan debts. Although I cannotdistinguish the source of the loan, less than 10 percent of student loan volume in the past five years wasnonfederal loans (Baum et al. 2017).For most borrowers in most years, these data also include the zip code of the borrower’s currentcontact address. I connect this zip code to demographic information from the American CommunitySurvey averaged across five years (2011–16), including share of residents by race and ethnicity,education level, and household income level. I also connect zip codes to information on annual averagehome prices for all homes in the zip code, using data from the Zillow Home Value Index.I follow a set of borrowers from the first year they enter repayment, rather than looking at a crosssection of student loan borrowers in each year. This method allows me to better describe credit eventsthat happen before and during student loan repayment and after a borrower’s first default. To identifythose who enter repayment for the first time, I look at borrowers who have no history of student loanrepayment in the prior two years on their credit record (students may have student loans in defermentor forbearance in the previous years but should not be actively making payments in these years). Iexclude borrowers who meet these criteria but also have a marker on their credit record of a previousstudent loan default within the past two years, as this indicates the student loan might have enteredrepayment after a period in student loan collections.2UNDERWATER ON STUDEN T DEBT
BOX 1A Primer on Student Loan Terms and the Credit Bureau DatasetThe following are terms that have a specific meaning in relation to a borrower’s credit profile and to thecredit dataset I use:Credit score. This is a score indicating a consumer’s credit risk. I use VantageScore 3.0 credit scores,which range from 300 to 850 and are used by the three credit agencies (Experian, Equifax, andTransUnion). A score of 700 or above is generally considered to be a good score (i.e., the borrower willlikely receive competitive rates for credit), and consumers with scores below 550 are unlikely to beapproved for credit.aDefault. This term refers to unpaid debt that will be transferred to a third-party collector. Federalstudent loans are classified as in default (“400” status) after 270 or 360 days of nonpayment and aretypically sent to a collection agency after 420 days.bDeferment. In my credit bureau dataset, student loans in deferment are any student loans that are heldby the borrower but are not in active repayment or in collections. In practice, these loans may be eitherin deferment (e.g., while the borrower is in school, experiencing financial hardship, or in the military) orin forbearance (e.g., in a residency program, in teaching service for loan forgiveness, experiencing highstudent loan debt burden or financial difficulties, or serving in the National Guard). cDelinquency. Student loans are delinquent once the borrower misses a monthly payment. Delinquency,as reported in credit bureau data, is categorized in terms of days past a payment due date (e.g., 30, 60,or 90 days late). Student loan servicers vary in when they report late payments to credit bureaus. Someoffer a grace period, but all federal loan servicers report delinquencies of more than 90 days.dExit default. Federal student loan borrowers can exit default by paying off their defaulted debt (eitherin lump sum or installments), rehabilitating their loans (making nine monthly payments toward the loan),or consolidating their loans (paying off the defaulted loans by making three on-time monthly paymentsand then taking out a new direct consolidation loan).Expected monthly payment. This is the monthly amount due on student loans for each borrower in mydataset. In a standard plan, the minimum monthly payment is 50, though borrowers may have lowermonthly payments through such plans as income-driven repayment.Tradeline. This is a line of credit for a given debt or loan. Each student loan is given its own tradeline,though borrowers typically pay down the balance on federal student loan tradelines together. In mydata, all tradeline balances are bundled together into debt balances that are in deferment, repayment,or collections.Worst-ever status. In my credit bureau dataset, the worst-ever status refers to the most delinquentstatus that a borrower’s student debt has reached over the previous 24 months. A borrower can have astatus of current (indicated with a “1”), delinquent (by 30, 60, 90, or more days), or default (indicatedwith a “400”).a“What Is a Good Credit Score?” Experian, accessed July 30, 2018, /#s2.bUS Treasury, “Report on Initial Observations from the Fiscal-Federal Student Aid Pilot for Servicing Defaulted Student LoanDebt” (Washington, DC: US Treasury, n.d.).c“Deferment and Forbearance,” US Department of Education, Office of Federal Student Aid, accessed July 30, rment-forbearance.d“Default Rates,” US Department of Education, Office of Federal Student Aid, accessed July 30, r/student/default.UNDERWATER ON STUDEN T DEBT3
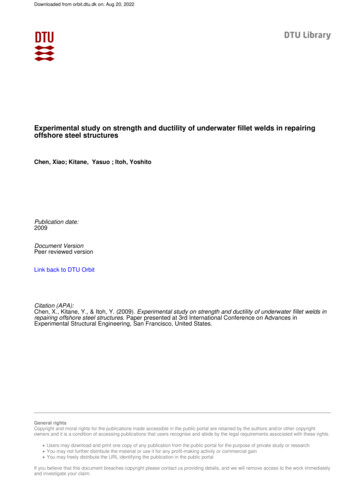
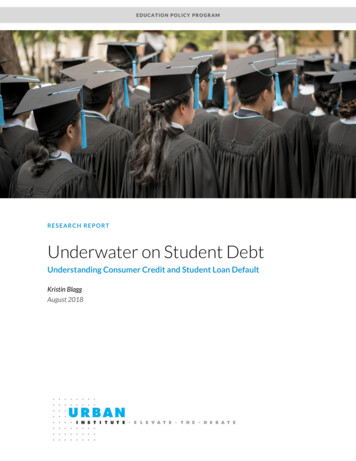
Using this method, I identify roughly 80,000 borrowers in each year of my sample (from 2012 to2016, as the 2010 and 2011 years are used for identification) who appear to be entering student loanrepayment for the first time. My analysis focuses on borrowers who entered student loan repayment inthe 2012 measurement year (i.e., first started repayment between August 2011 and August 2012). Iselect this year for my analysis because it provides the greatest window in which to track ensuingstudent loan delinquency and default. But later cohorts of borrowers appear to have similarcharacteristics and exhibit similar trends as the 2012 cohort (albeit over a shorter time frame).I define student loan default as having a worst-ever student loan status of “default” and having atleast a dollar of student loans recorded in collections in the same year. Although it is uncommon in mydataset, borrowers can default on a student loan and have other student loans not defaulted (i.e., indeferred status or in repayment status). I count any borrower with at least one defaulted loan as astudent loan defaulter.Borrowers in the 2012 cohort have an average loan balance upon entering repayment of about 20,860, though balances vary substantially (figure 1). A quarter of these borrowers have less than 5,500 in student loan debt, and the median debt is about 11,700. In line with previous evidence, Iobserve a low prevalence of high student debt; 9.0 percent of borrowers enter student loan repaymentwith more than 50,000 in debt, and just 2.3 percent of borrowers in my sample enter repayment withloans larger than 100,000.The distribution of expected monthly payment—the amount that the borrower has agreed to payunder her payment plan—for my cohort of borrowers is more “lumpy” than the distribution of studentloan balances (figure 2). The minimum monthly payment for a standard 10-year federal student loanrepayment plan is 50, and I observe a cluster of borrowers who are recorded as owing this amounteach month. About 10 percent of borrowers in my sample owe less than 50 a month (possibly becauseof opting into income-driven or graduated repayment plans), and 11 percent of borrowers in my sampleowe exactly 50. Just 7 percent of borrowers in my sample have a monthly payment of more than 500.4UNDERWATER ON STUDEN T DEBT
FIGURE 1Student Loan Balance Measured in First Repayment YearDistribution of borrowers from 2012 cohort by student loan balanceShare of borrowers6%5%4%3%2%1% 96–97K 99-100K 93–94K 90–91K 87–88K 84–85K 81–82K 78–79K 75–76K 72–73K 69–70K 66–67K 63–64K 60–61K 57–58K 54–55K 51–52K 48–49K 45–46K 42–43K 39–40K 36–37K 33–34K 30–31K 27–28K 24–25K 21–22K 18–19K 15–16K 12–13K 6–7K 9–10K 3–4K 0–1K0%Starting student loan balance in 2012URBAN INSTITUTESource: Urban Institute analysis of credit bureau data.Notes: Includes private and federal student loans. The 2012 cohort are borrowers who first entered repayment between August2011 and August 2012. The “ 0–1K” category includes loans up to 999, the “ 1–2K” category includes loans from 1,000 to 1,999, and so on.FIGURE 2Expected Monthly Payment Measured in First Repayment YearDistribution of borrowers from 2012 cohort by expected monthly paymentShare of borrowers18%16%14%12%10%8%6%4%2% 500 480–489 460–469 440–449 420–429 400–409 380–389 360–369 340–349 320–329 300–309 280–289 260–269 240–249 220–229 200–209 180–189 160–169 140–149 120–129 100–109 80–89 60–69 40–49 20–29 0–90%Expecetd monthly paymentURBAN INSTITUTESource: Urban Institute analysis of credit bureau data.Notes: Includes private and federal student loans. The 2012 cohort are borrowers who first entered repayment between August2011 and August 2012.UNDERWATER ON STUDEN T DEBT5
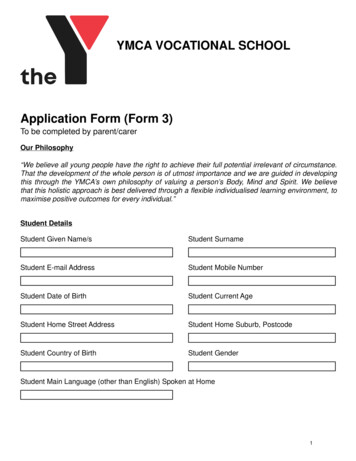
Patterns of Student Loan DefaultBy following the 2012 cohort, we can better understand how borrowers progress in their student loanrepayment over the next four years. Because my dataset records loan data at a single point during theyear, some borrowers are recorded as delinquent (30 or more days late on payments) in the first year ofrepayments. These borrowers entered repayment at some point in the prior year and already missedpayments on at least one student loan by August. I observe this delinquency at the same time I observethey have entered repayment.Less than 1 percent of borrowers in my sample cohort are in default in their first year of repayment(i.e., in 2012). Defaults on a federal student loan typically take at least a year to be recorded in creditbureau data, but defaults on private student loans can take less time. Borrowers who default in less thana year are less likely to have an indicator of having federal debts, which suggests that many of thesefirst-year defaults are likely on private student loans.Figure 3 shows the flow of worst-ever student loan status in my data over the first four years ofrepayment (upon entering repayment, after two years, and after four years). “Worst-ever” statusindicates the most delinquent status on a consumer’s student loan over the previous two years. For thisanalysis, borrowers who default on their student loans during the period are marked as staying indefault for the remainder of the 2012–16 period (i.e., I consider defaulters to have exited their firstrepayment attempt, even if they recovered from default). Borrowers who enter repayment and puttheir loans into deferment or forbearance continue to be counted, as are students who pay off theirloans within this four-year period.6UNDERWATER ON STUDEN T DEBT
FIGURE 3Status of Student Loans over TimeWorst-ever status on student loans, 2012 cohortURBAN INSTITUTESource: Urban Institute analysis of credit bureau data.Notes: Includes private and federal student loans. The 2012 cohort are borrowers who first entered repayment between August2011 and August 2012. “Worst-ever” status is the most delinquent status of a student loan in the previous 24 months. Earlydelinquency is 30, 60, or 90 days late, and late delinquency is 120 or more days late. Borrowers who default continue to bereported as “ever default,” even if they resolve the default. Includes borrowers who enter repayment and subsequently pay offtheir debts or put their loans into deferment.After two years of repayment, in 2014, about 58 percent of student loan borrowers are recorded ascurrent on their credit record (no delinquency or default in the previous two years), and 15 percent ofborrowers have at least one defaulted student loan. By 2016, 62 percent of borrowers in our cohort arecurrent and 22 percent have had a default in the previous four years.Borrowers who enter only early delinquency—that is, who missed a maximum of three monthlypayments—are rare. In 2014, 6 percent of borrowers have had at least one loan in early delinquency(marked as 30, 60, or 90 days delinquent), while 21 percent of borrowers have had at least one loanenter late delinquency (120 or more days delinquent). Among borrowers in late delinquency in 2014,about 30 percent default by 2016 and about 33 percent return to current status by 2016.A substantial portion of borrowers entered deferment or forbearance on their student loans afterstarting repayment in 2012. This status could indicate that the borrower has returned for anotherenrollment in school (e.g., a dropout returns to college or a college graduate enrolls in graduate school)or is engaged in active-duty military service but could also indicate that the borrower is unemployed orUNDERWATER ON STUDEN T DEBT7
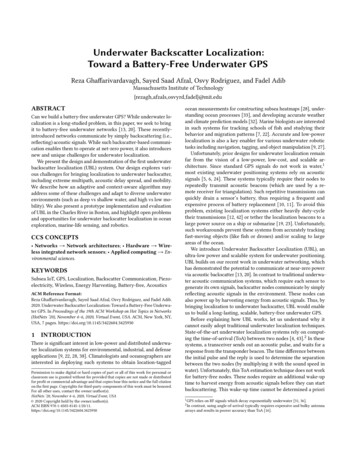
cannot make payments because of low income or financial difficulties. Within the 2012 cohort, about 18percent of current borrowers in 2014 and 13 percent of current borrowers in 2016 had put their loansinto deferment (or forbearance) during that year (figure 4). Deferment is slightly more common amongborrowers who have a record of delinquency; about 22 percent of borrowers with previouslydelinquent loans had put those loans into deferment in 2014, and 16 percent of previously delinquentborrowers had deferred their loans in 2016.FIGURE 4Share of Borrowers with Debt in DefermentBy worst-ever status, 2012 cohortShare of borrowers who have at least 1 of debt in deferment22%23%18%16%16%Early delinquencyLate delinquency13%CurrentEarly delinquency2014Late delinquencyCurrent2016URBAN INSTITUTESource: Urban Institute analysis of credit bureau data.Notes: Includes private and federal student loans. The 2012 cohort are borrowers who first entered repayment between August2011 and August 2012. Early delinquency is 30, 60, or 90 days late, and late delinquency is 120 or more days late. Borrowers areassumed to be in deferment if they have no student loans in active repayment and at least a dollar of open deferred student loandebt.In figure 3, I show the progress of borrowers who appear to have entered their first repayment in2012. Borrowers who have had their loans enter default are presumed to stay in default. But someborrowers in my sample do exit default during this period. Borrowers can exit default by paying the loanoff in full, rehabilitating the loan, or consolidating the loan. In the 2012 repayment cohort, 22 percent ofborrowers defaulted on a student loan at least once during the first four years. Of these defaulters,about 29 percent appeared to have exited from default status (i.e., have no student debt in collections)by 2016, the last year of my panel. Roughly 20 percent of student loan defaulters recovered fromdefault within one year, and an additional 10 to 14 percent recovered within two years. A small portionof borrowers (2 to 4 percent of previous defaulters each year) redefault (figure 5).8UNDERWATER ON STUDEN T DEBT
FIGURE 5Defaults and Default Exits over TimeStatus of defaults and default exits, 2012 cohortURBAN INSTITUTESource: Urban Institute analysis of credit bureau data.Notes: Includes private and federal student loans. The 2012 cohort are borrowers who first entered repayment between August2011 and August 2012. “Not default” status indicates a borrower who has no student loans in collections after a prior record ofdefault.In the next sections, I describe the characteristics of student loan borrowers who default, looking attheir characteristics before starting repayment and then following them through default and exit fromdefault.Characteristics of DefaultersBorrowers who eventually default have substantially different debt profiles and appear to come fromless wealthy neighborhoods than borrowers who do not default. Knowing which borrowers defaultwithin four years, I can look back at the credit context of these borrowers before they enteredrepayment.UNDERWATER ON STUDEN T DEBT9
I use credit data from 2011, before the cohort entered repayment on their student loan debt. Thisallows me to capture the credit health of borrowers while they are still in deferment or, in a smallnumber of cases, before they have taken out the student loan. About 93 percent of my 2012 cohorthave a credit record for the previous year.2 For information on contextual neighborhood variables, I usedata from the first year of repayment (2012) to better account for the students who may move fromcampus to a new neighborhood for a career.Most Defaults Are Concentrated among Low-Balance Borrowers, but High-BalanceBorrowers Are Not Immune to DefaultBorrowers who owe less than 5,000 at the start of repayment are the most likely to default within fouryears; 32 percent of these borrowers defaulted at least once. But high-balance borrowers sometimesdefault. About 15 percent of borrowers who owed more than 35,000 at the start of repaymentdefaulted on at least one loan over the next four years. But the proportion of borrowers with a largedebt load is small (figure 6).FIGURE 6Status of Student Loans by BalanceBy worst-ever status on student loans over four years, 2012 cohortStayed currentEarly delinquencyLate delinquencyAt least one defaultShare of borrowers25%20%15%10%5%0%Initial student loan balanceURBAN INSTITUTESource: Urban Institute analysis of credit bureau data.Notes: Includes private and federal student loans. The 2012 cohort are borrowers who first entered repayment between August2011 and August 2012. Early delinquency is 30, 60, or 90 days late, and late delinquency is 120 or more days late. Includesborrowers who enter repayment and subsequently pay off their debts or put their loans into deferment.10UNDERWATER ON STUDEN T DEBT
Figure 6 also shows the worst delinquency status (e.g., the latest that borrowers have been on theirloan payments) that nondefaulted borrowers reached over the ensuing four years. About 6 percent ofborrowers who owed less than 5,000 were 30, 60, or 90 days delinquent at some point during the fouryear period; 21 percent of the same group of borrowers entered late delinquency (more than 90 daysdelinquent but did not default). Unlike default, the share of borrowers who reach early or latedelinquency over four years are similar across levels of student debt. Eight percent of borrowers whoowed more than 35,000 reached early delinquency, and 20 percent of these borrowers reached latedelinquency.Student Loan Defaulters Are More Likely to Hold Certain Types of Debt beforeEntering RepaymentIn the year before entering repayment, student borrowers who default are less likely to hold anyhousehold debt (e.g., a mortgage, auto loan, or credit card balance) and are more likely to be incollections on some other type of financial obligation (figure 7). Student loan defaulters are more likelyto have utilities collections debt and medical debt. In addition, a small portion of student loan defaultersare in collections on retail debt or bank debt. Borrowers who do not default in four years are more likelythan defaulters to have credit card debt, auto debt, and mortgage debt in the year before repayment.There is essentially no difference between defaulters and nondefaulters in the likelihood of havingdeclared bankruptcy in the previous year.Of those who carry debt, the median levels of debt are similar between the two groups, but thereare some noticeable differences, particularly for medical debt and household debt (appendix figure A.1).The median medical collections debt for a defaulter is nearly twice the median for a nondefaulter ( 926versus 560). Before repayment, the median credit card balance of nondefaulters with credit card debtwas 7,400, while the median
student loan records also include both private and federal student loan debts. Although I cannot distinguish the source of the loan, less than 10 percent of student loan volume in the past five years was nonfederal loans (Baum et al. 2017). For most borrowers in most years, these data also include the zip code of the borrower's current