Transcription
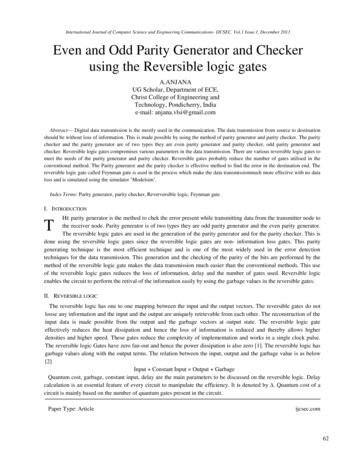
Pure &App/. Chem., Vol. 69, No. 6, pp. 1227-1235, 1997.Printed in Grsat Britain.Ca 1997 IUPACParity-broken and -unbroken self-trapped excitonsin alkali halidesKen-ichi Kan’no,’ Tamao Matsumoto’ and Yosuke Kayanumab“Department of Physics, Kyoto University, Sakyo, Kyoto 606, Japan“Collage of Engineering, University of Osaka Prefecture, Sakai 593, JapanAbslrmt: We review updated understandings of the electronic and atomic structures, relaxationdynamics and spin-multiplicity of self-trapped excitons (STEs) in alkali halide crystals, on thebases of recent experimental results of the STE luminescence. It is pointed out that seeminglycomplicated diversity in the features of STE luminescence and F-H pair formation can be explained from an unified viewpoint. That is, depending upon the kinds of crystals there can arisethe “adiabatic instabilify”, which results in multiple local minima on the adiabatic potential ene g ysurfaces (APES’s) for the singlet and triplet STE states of the lowest orbital energy. A simple phenomenological model is proposed, which indicates that the electron-hole spin interactionplays an essential role in correlation with the electron-lattice and hole-lattice interactions. Theshape of the APES’s, the configuration dependence of the electron-hole exchange energy, relaxation dynamics and the structure of STEs are discussed in relation to the bi-stability of paritybroken and -unbroken STEs.INTRODUCTIONIn these several years, relaxation dynamics of excitons in wide-gap ionic crystals has been a subject of extensive studieswith respective to so-called “adiabatic instability”, which results in the symmetry breaking of the self-trapped exciton(STE) state. As reviewed in the recent monograph by Song and Williams (ref. l), alkali halides are the most attractivematerials for which various kinds of studies on the exciton self-trapping and photo-induced phenomena have been carried out experimentally and theoretically over three decades. Nowadays, it has been generally accepted that the adiabatic instability brings great influence on radiative and non-radiative decay processes, and plays an essential role in theformation mechanism of Frenkel defect pairs. A simple explanation for the instability is a pseudo Jahn-Teller s-p mixing by odd parity distortion modes. The idea of this kind of instability was firstly proposed by Toyozawa (ref.2), inrelation to the formation mechanism of F-H defect pairs, and has been extensively developed to the idea of so-called“off-center STE’ by Song and his coworkers (refs.3-5). In 1990, a key to open a new stage of investigations was discovered in the STE luminescence by Kyoto group (refs.6-8) collaborating with Kayanuma (ref. 9).In the present article, we review updated understandings ofwhat happens in alkali halide crystals and how it proceedsimmediately after the excitons or electron-hole pairs optically created come to attain energetically more stable situation. One can find a key parameter to understand seeminglycomplicated diversity in the features of STE luminescenceand F-H pair formation in correct way. A general picture toreasonably be imagined is that depending upon the kinds ofcrystals there can appear multiple local minima on the adiabatic potential energy surfaces (APES’s) for the singlet andtriplet STE states of the lowest orbital energy. As schematically shown in Fig.1, the STE configuration in which anelectron and a hole are both localized on the same center ofsymmetry (on-center type) is, in many cases of alkali halides, rather unstable against odd-parity lattice distortionmodes, resulting in spontaneous transformation into theasymmetric configuration of a spatially dissociated electron-hole pair (offenter type), or hrther into the nearestneighbor (nn) F-H pair. A simple phenomenological modelis also proposed: The shape of the APES’S, the configuration dependence of the electron-hole exchange energy andrelaxation dynamics are discussed in relation to the bi1227F-H defect pair‘CT LATTICEF-H DEFECT PAIRFig. 1 Schematic drawing of exciton self-trappingprocesses in alkali halide crystals.
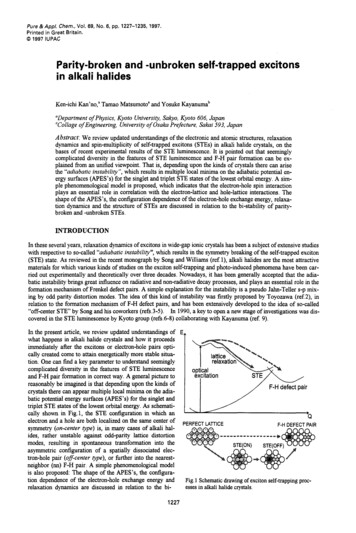
1228K. KAN’NO e t a / .stability of parity-broken and -unbroken STEs. It will be stressed that the electron-lattice interaction, hole-lattice interaction and electron-hole spin interaction cooperatively or competitively play essential roles during exciton selftrapping.MATERIAL DEPENDENCE OF THE STE LUMINESCENCE SPECTRAIn 1964 Kabler (ref. 10) proved that the host-dependent broad luminescence bands found in alkali halides at low temperature are the result of electrons recombining radiatively with self-trapped holes ( V K centers). The luminescencebands were found to be polarized either parallel (a) or perpendicular (R)to the principal molecular axis of the alignedVKcenters. Kabler and Patterson (1967, ref.11) showed that the o-polarized short-lived bands arise from radiative decay of singlet states and the n-polarized, long-lived bands arise from triplet states. One might reasonably expect to findthat optical spectra of alkali halide families would be replicated almost unchanged, or be shifted gradually from onecrystal to the other in some orderly way. This is really the case, for example, in the fundamental absorption spectra ofthe evaporated thin films, indicating that elementary excitation itself is in regular order with respect to a different combination of the anion and cation of host crystals (ref. 12). The reality of the situation of the STE luminescence is not sosimple, however: The first is concerned with the variety in the number of STE bands appearing in particular crystals.As seen in Fig.2 where emission and excitation spectra of the STE luminescence in nine crystals, (Na, K, Rb) x (Cl, Br,I) are summarized, the n-band (hatched) appears in all the crystals while the o-band is observed only in five crystals.That is, the a-band is apparently missing in KCl, RbCI, NaBr and NaI. Moreover, RbI looks like a peculiar crystal,where one can see three intrinsic emission bands. Why does only one band or else more appear in a particular crystal ?Another point not to be overlooked is concerned with the spectral range where the emission bands appear. Usually, theR: emission band is located in the visible part. The Stokes shift relative to the free exciton is dramatic, being at least halfthe band gap in most cases, and reaching more than 5 eV in KCl and RbCI, for example. But in both NaBr and NaI then band is located in the ultraviolet part with a rather small Stokes-shift. How can the variety in the magnitude of theStokes-shift be adequately understood ? In fact, reasons or rules for many of the variations were not obvious in about20 yr. of inspection. One suspects, therefore, that the bands among which one should look for orderly trends are notgrouped along the obvious lines of a and R, or singlet and triplet.CIIErN. 1NaKRbPHOTON ENERGY ( e V )PHOTON ENERGY (eV)PHOTON ENERGY (eV)Fig. 2 STE luminescence spectra in nine alkali halides, (Na, K, Rb) x (Cl, Br, I), with predominantly tripletbands shaded and predominantly singlet bands not shaded. Excitation spectra are shown in the right hand sidewith arrows indicating the lowest exciton absorption peak. (after K.Kan’no et al., ref. 6 ) ,Studies on mixed crystals of alkali halides identified both the key parameter and the proper groupings of bands to render the variation in band positions quite logical. Kan’no and coworkers (ref.6) reasoned that if one wants to know howluminescence bands change from one alkali halide to the next, then it should be illuminating to gradually change onepure crystal to the next through progressive alloying, and watch how the luminescence bands evolve. One has thechoice of changing the alkali while keeping constant halide, or of changing the halide whtle keeping constant alkali,with different aspects probed in each case. The experiments suggested three categories of STE emission bands in thenine alkali halides (Na, K, Rb) x (Cl, Br, I), designated mainly according to spectral position and the way peaks evolvethrough the mixed crystal series. These categories are called types I, 11, and 111, in order of increasing Stokes shift energy. For typical example of the experiments, we mention the results of NaBr-KBr mixtures in the following.In the system NaI,K,Br with x taken from 0 to 1.0, one observes STEs always involving the Bry molecular ion, as itssurroundings and the average lattice constant of the crystal are gradually changed. The STE spectra and decay curvesare shown in Fig. 3. For x 0, the crystal is NaBr, and the band at 4.6 eV is the familiar triplet R luminescence with alifetime of 490 ns, shown as the shaded part of the decay curve. Actually, these data show something new even for pureNaBr. That is the weak 1.5 ns decay component, which has the Same spectral distribution as the n band (ref.8). Thesurprise in Fig. 3 is that as the potassium fraction x increases, the triplet R band of NaBr turns smoothly and continuously into the singlet o band of KBr ! This is seen both in the spectra and the decay curves. The triplet R band of KBr0 1997 IUPAC, Pure andApplied Chemistry69,1227-1235
1229Self-trapped excitons in alkali halidesat 2.28 eV appears at x 0.6, without any significant precedent in the NaBr spectrum. The 2.8 eVband at intermediate compositions is associated withthe sodium impurity-perturbed STE in KBr. UsingNal,KxI mixtures, the bands in NaI and KI wereconfirmed to be related in a very similar way(ref. 13). Experiments changing the halogen alongthe KBrl,Ix system further clarified that the triplet xband in KI has no counterpart in KBr, even in thiscase where the singlet o band of KI simply corresponds to the singlet of KBr (ref.14). That is, thetriplet x bands in both crystals must be classifiedinto different categories from each otherIt is not surprising, then, that one has been unable toperceive clear trends of the n band from one crystalto the next, or of the o band from one crystal to thenext. These are evidently not the primary distinguishing-categories, since one polarization or spinstate can turn into the other at corresponding energies across alloy diagrams such as Fig. 3. It appearsthat there must be something more fundamental distinguishing the ultraviolet bands in NaBr and KBrfrom the green band in KBr, for example. Since“singlet vs. triplet” and “o vs. x“ do not seem to besuitable category names when discussing suchtrends versus crystal, the ultraviolet bands withsmall Stokes shift, whether singlet or triplet, weresimply assigned to “type I”. Only KCl and RbCl donot exhibit type I bands. Band correspondenceswithin the mixed crystal series showed that the x polarized band called Ex in RbI certainly and the Aband in NaCl probably, as well as the x band in KIbelong to type 11, whereas the A bands in all. othercrystals except NaBr and NaI are type 111. Hence,the 4.6 eV n-band in NaBr and the 2.28 eV n-bandin KBr turns out to be types I and 111under new nomenclature, respectively.x o23dvhdx4.4Ldv 5:2EEX O 8BEd2LLd345E6PHOTON ENERGY (eV)Fig.3 (A) Luminescence spectra of Nal,K@ mixed crystals at 10 K,excited by 7.7 eV photons. (B) Decay profiles of the uv band underpulsed excitation with 7.7 eV synchrotron radiation (after Kan’no etal., ref. 6 ) .PHOTON ENERGY (eV)PHOTON ENERGY (ev)Essentially the same situation has been also confirmed in the luminescence spectra of impurity- Fig.4. Luminescence spectra of STE’s in NaI, KI and RbI (left),associated excitons; bromine or iodine monomer andand those of iodine associated monomer excitons in NaBr:I, KBr:Iand RbBr:I (right). (after Kan’no et al., ref. 16)dimer impurity emission bands in alkali chloride andbromide crystals. Actually the first indication ofhfferent families in triplet luminescence bands was found in KBr:I (ref.15) and KC1:Br (refs.7) by Tanaka et al. Atypical example is seen in the spectra due to iodine monomers in alkali bromides, i.e., NaBr:I, KBr:I and RbBr:I(ref. 16). This is the analogue of the STE luminescence in NaI, KI and RbI. As shown in Fig.4, one, two and three emission bands, all arising from relaxed excitons with hetero-nuclear halogen core (BrI)-, are located at corresponding energies to the STE bands in the three iodides. Emission bands in 17 different systems except the iodine monomer system inNaC1:I were classified into the same categories, types I, I1 and 111, based on the spectral evolution and band correspondences within the mixed crystal series. (NaC1:I is exceptional because the single band in this system belongs to anothercategory called “NE emission”, which originates from the relaxed exciton state of one-center type (ref. 17)).Since all STE luminescent states, including the cases of impurity-associated excitons, have been shown to involve halogen pair relaxation of the “ V i ’ type, there must be some additional degree of relaxation to differentiate the variouscategories of bands and account for the substantial energy differences between them. Before finding the three categories,Song and Chen (ref. 18) had pointed out the correlation that exists between n band energy and the degree of off-centerrelaxation. Song et al. (ref. 19), Kan’no et al. (ref.6) and Kayanuma (ref.9) proposed that the degree of off-center relaxation provides the basis for the observed trends and resulting categories. Since the type I emission is observed forcrystals with larger halide ions, in which off-center motion of the halogen molecular ion core is more constrained, it wasattributed to on-center STEs with the VK e configuration as in Kabler’s original model (refs.6,9), or to the STEs situ0 1997 IUPAC, Pure andApplied Chemistry69, 1227-1235
1230K. KAN’NO e t a / .ating “nearly on center”(ref.20). Because of the extreme Stokes shift of the type I11 bands, there must be substantialadditional lattice relaxation in addition to the VKdistortion. Thus type I11 was attributed to off-center STEs with configuration close to the nn F-H pair. Type I1 is then an intermediate degree of off-center relaxation.ORDERLINESS OF THREE TYPES AGAINST RABIN-KLICK PARAMETERStokes shift energiesAs shown by Song et al.(ref. 19) and Kan’no et al.(ref.6), the degree of off-center relaxation in the STE correlates withthe Rabin-Klick parameter S/D (ref.2 1). The parameter S is defined as the separation of two adjacent halide ions alonga -410 row minus twice the halide-ion radius, i.e. the ”excess space” measured between hard spheres placed at the ionpositions. D is the diameter of the halogen atom. The ratio S/D was originally proposed as a geometric measure ofspace available for the insertion of an interstitial halogen atom to form an H center, or in the present context, space forthe STE to relax off-center. The S/D is a suitable parameter convenient for neat pigeonholing of not only the intrinsicSTE bands but also impurity associated exciton luminescence, as described below. We present a new diagram in Fig, 5,as an extension of plotting the ratio of Stokes shift to the 1s exciton energy against S/D for the 15 STE bands in the 9alkali halides (ref.6). It includes 24 additional data points from impurity associated bands due to monomer and dlmerh*0.00.20.4Rabi n - KIick parameter0.6AMonomer0Dimer0.8S/DFig. 5 Plot of Stokes shift of STE luminescencebands in nine alkali halides, and of monomer (designated by m)and dimer (designated by d) luminescence due to halogen impurity associated excitons, normalized by the energy of the lowest exciton absorption peak. (see text)excitons. The S/D, which was originally defined as the measure against the crystal structure, is redefined to scale everyindividual geometry to be situated by intrinsic and impurity-associated STEs as follows: For the intrinsic STEs of X;core in alkali (M )halide (X-) crystal, S and D are given by S (a/d2) - 2rx and D Dx, according to the original definition. Here a is the lattice constant of the host crystal A’X, rx the halide-ion radius and DX the diameter of halogenatom. As for the A’X-:Y- crystal containing foreign halogen ions Y-, we define effective values of S and D by S (a/.\/2)- (rx ry) and D Dx for the impurity monomer exciton of ( X Y ) -core, whereas by S (dd2) - 2ryand D D y for theimpurity dimer exciton of Y; core. In Fig.5 the abscissa is effective S/D thus defined. The ordinate is the Stokes-shiftenergy normalized by the energy of the lowest absorption peak, so that it may be the direct measure for the lattice relaxation energy. Predominantly n bands of STEs, monomers and dimers are shown by filled circles, triangles andsquares respectively, and predominantly bands of the corresponding excitons are shown by open symbols. The orderthat emerges on this plot is astonishing. The R emission starts as type I (on-center, or nearly so), and then around0 1997 IUPAC, Pure and Applied Chemistry69, 1227-1235
1231Self-trapped excitons in alkali halidesS/D 0.3 makes the transition progressively through type I1 (moderately off-center), finally to type I11 (nn F-H configuration) in crystals with large S/D. The main portion of the singlet STE population never gets to the type I1 or type111 off-center configurations, suggesting that the singlet spin state is stabilized in the type I configuration, even thoughthe singlet-triplet splitting is known to be small. It is also noteworthy that the three types do coexist in the systems of0.38 S/D 0.45; i.e. the STE in RbI and the iodine monomers in KC1:I and RbBr:I.Two step transitions in the ordinate against increasing S/D are exactly correlated with the evolution from type I to typeI1 and further type 111. This clearly indicates that in addition to the VK-type lattice relaxation, at least two distinctivedistortion modes are concerned with stabilizing off-center configurations, in agreement with theoretical anticipation ofQ2 and Q2' distortions (ref. 19). In the present model, the singlet STE luminescence arises from the same orbital state asthe triplet luminescence, but subtle spin interactions may make one of the lattice configurations I, 11, or 111 more favored than another. It is perhaps not the stability of the singlet at the type I configuration that is remarkable and thatcauses the type I STEs to be predominantly singlets, but rather the instability of the triplet STE at the type I configuration, which goes downhill into the more off-center potential minima. This is just the adiabatic instability discussed byToyozawa (ref.Z), Song and coworker (refs.3,4), Williams et al.(ref.5) and by Kayanuma (ref.9). Overlaid with theconventional Rabin-Klick diagram for F center production at 4.2 K (ref.2 l), one can see that when the lattice becomesfavorable for F-center production at low temperature, the type 111 configuration is favored by the STE. One may conclude from the trends that if the lattice is open enough to allow large off-center relaxation of the STE, then any barriersto further separation of the F-H pair are also likely to be small.Trialet lifetimesIn addition to the above-mentioned diversity of the luminescence bands, their lifetimes also vary in ways that are notobvious upon inspection. The lifetime zn of the lowest triplet 3Z: tate is given by C E: bZl('I-Iul r I 'Zl)12,Here,C is a numerical constant, Enthe x: emission band energy and b the mixing parameter of a higher singlet 'nustate intoZ' state by the halogen spin-orbit interaction. In the perturbation limit, b is approximated by AIAsTE,where /z andthe :as are the spin-orbit coupling constant of the halogen atom and the energy separation between Illu and 3C,,', respectively. The lifetime of the x emission had been known to be shorter in heavier halides (ref. 11). This was satisfactorilyaccounted for in terms of the larger spin-orbit interaction in heavier halides. However, the lifetime exhibits anomalousvariation even within a given halide family. For example, the lifetime of the type I n: band in NaBr is 490 ns, which istwo order of magnitude shorter than 130 ps of the type 111 x band in KBr. Obviously, such difference in lifetimes comespartly from the appreciable difference in emission band energies between types I and 111bands. The difference betweenEn'sin NaBr (4.6 eV) and KBr (2.3 eV), however, only accounts for the difference by one order of magnitude. A largeDI0.0I0.20I0.4Rabin-Klick parameterI0.6I0.8S/DFig.6. Plot of inverse of dipole strength of STJ3 luminescence and monomer (m) and dimer (d) impurity exciton luminescence vs. Rabin-Klick parameter S/D. (see text)0 1997 IUPAC, Pure 8ndApplied Chemistry69, 1227-1235
1232K. KAN’NO eta/.difference over one order of magnitude still remains unexplainable, and it must come from either variation in the energyseparation ASTEandor the transition dipole strength d K’IL I r I ’ z ) I’.Kawata et al. (ref.22) suggested the possibility that ASTEis appreciably smaller in the type I STE than in the type 111STE, by assuming ATE AvK for type I on-center STEs while ATE & for type I11 off-center STEs. Here, AvK and &are the energy splitting between ’nuand ’2, in the VKand H centers, respectively. A trend of AvK c AH was reasonablyexpected from the observed difference in g-shifts between VKand H center EPR spectra, leading to the conjecture thatAs is larger in off-center STEs than in on-center STEs. On the one hand, Song and Chen (ref. 18) derived the relationin which d reasonably correlates with the off-center relaxation coordinate Q2, under the simplification that the variationE negligible. In Fig. 6, we also present an interesting trend found in the experimentally determined d valuesin A T isagainst S/D: The ordinate d’ stands for the inverse of the transition dipole strength implicitly including a correctionfactor E (AvK / AS )’. That is, d ( E d )-’ Z, C E:(;V Av,)’. The data points (closed symbols) were obtained,therefore, independent of uncertainty in evaluating ATE.For comparison, data points for the dipole strength, d, 2 I(’& Ir I ’Zl)l ’, directly evaluated from the singlet 0 luminescence lifetime are also plotted by open symbols. The order thatemerges on this figure is impressive, too. There is an astonishing resemblance between Figs. 5 and 6, except differencein scaling the ordinates (linear scale in Fig. 5 versus log-scale in Fig. 6). This result offers strong indication that themanner of electron-hole overlap vary in essentials from one type to the other of luminescent states. It is also noteworthythat the magnitude of the closed symbols of type I bands coincide with that of the open ones.’-’PARITY-BROKEN AND -UNBROKEN STESoriented STEs in NaBr, which was time-resolved by using a novel combination of detecting emission decays andapplying pulsed X-band microwave (ref.32). For com-X-band ODMR of triplet STEs H//[l lo]KBrNaBr0 1997 IUPAC, Pure and Applied Chemistry 69, 1227-1 235
Self-trapped excitons in alkali halides1233RELAXATION PATHWAY ON APESOne of the recent topics extensively studied is to see how the shapes of the APES's are, how the population is fed intoeach minimum, and how it decays from there. As already mentioned, the on- or off-center STE is solely realized forS/D 0.3 or S/D 0.6, respectively. This must be the simple case that a doubly-degenerated minimum is located at theon- or off-center position on the APES's of the singlet-triplet STE pair. However, in crystals with an intermediate S/Dvalue, such as NaCl, KI, RbI, KBr, RbBr, the on- and off-center STEs must coexist, because their STE luminescencespectra exhibit multiple bands of types I and I1 (andor) 111. Interestingly, the type I STEs in these crystals preferentially decay from the singlet state to emit the predominantly 0-polarized luminescence, whereas the type I1 or I11 STEsdecay exclusively from the triplet state to emits the sc-luminescence. This suggests that the adiabatic instability and thespin multiplicity of excitons are closely correlated to each other, via the relaxation dynamics.Kayanuma (ref.9) had already discussed how the different excitation spectra for 0- and sc-luminescence can come aboutthrough population dynamics within the off-center model. An interesting point is the fact that the type I band is hardlystimulated in the spectral range of the n l free exciton (FE) where the triplet a-band of type I1 or I11 is stimulated moreefficiently. Matsumoto et al. (ref. 26) have measured the excitation spectra of types I, I1 and I11 STE luminescence in 7alkali halides using time resolution to distinguish singlet and triplet components of the type4 luminescence, andcorrecting for both reflectivity and surface dead-layer effects. It was concluded that excitons created in the n 2 andhigher states can readily relax to on-center type-I (singlet and triplet) STEs, as well as type I1 or 111. Between the n 1and n 2 exciton peaks, the yield of type4 luminescence is small irrespective to its triplet component or singlet component, suggesting that the smallest Bohr radios of the n 1 exciton is essential to trigger very unstable situation toward off-center relaxation. They discussed an overall model of relaxation dynamics, which explains their experimentsin a consistent way, by taking the following two points into account: 1) The remarkable contrast in features of excitation spectra between above and below the n 2 FE means that relaxation pathways from the n l FEs must be differentfrom those from the n 2 FEs and from free electron-hole pairs. 2 ) Recent works (refs.34,35) have shown that the n 1free exciton scatters quickly to the triplet state within intraband relaxation. Essence of their relaxation model is summarized as follows (refs.26,36):Relaxation proceeds in two dimensional coordinate space of Ql and Qz, here Ql stands for the VK-type on-center relaxation and Qz for the off-center relaxation toward the nn FH pair configuration. Figure 8 shows schematic plots of thed Qan.c .As shown in (d),sections of APES along three characteristic axes in the Q l - QZspace, (a):Qon,(b): Q o a n (c):the Qon axis is the Ql-axis, while the Qo andQon.offaxes are represented by linear combinations of the Ql and Qz, As for the excitationEgEgn 2n 2above Eg, relaxation will proceed toward the Qondirection because of the steepest gradient, asn 1n l[eH e.']indicated by the solid arrow in Fig. 8(a). Aftercascade relaxation within the on-center configuration, a dominant part of the triplet componentfurther relaxes into the off-center minimumalong the path shown in (c). The singlet compoE(0FF)nent, however, may stay in the on-center minimum unable to overcome the barrier becausethe barrier to off-center relaxation in the singletstate must be larger than in the triplet state asmentioned in the next section, giving rise to thefast component of the type I band. When then 2 FEs are initially created, some part, x, is:1)scattered into the n l FE state (indicated by asmall wavy arrow) but the rest may relax alonga path similar to that for the band-to-band excitation. As for the excitation into the n l FE,singlet FEs are efficiently scattered into the triplet FE state. Finally, major part will be selftrapped preferentially mto the off-center conFig.8. Schematic plots of three sections of APES'S on which relaxationfiguration, owing to the steepest gradient along proceeds after photo-excitation, from FEs or free electron-hole pairs toQosaxis, as shown by broken arrows in (b).the on-center and off-center STE states (after T.Matsumotoet al., ref.25).0 1997 IUPAC, Pure and Applied Chemistry69,1227-1235
K. KAN'NO eta/.1234CORRELATION BETWEEN SPIN STATES AND STE STRUCTURESIn this section, we discuss the physical basis of the parity-broken and -unbroken STEs, especially concerning theproblem why and how both STEs can coexist in many alkali halides. The key is most probably the electron-hole spincorrelation depending upon the off-center lattice relaxation modes (refs.6,9). Recently Matsumoto et al. (ref.36) demonstrated a remarkable variation of exchange splitting energy along the relaxation path Qz from the on-center configuration to the off-center configuration, by simulating the singlet APES and the triplet APES. It naturally explains thebasic features of how the 0-luminescence from the singlet appears exclusively at the on-center configuration while theduminescence from the triplet arises dominantly at the off-center configuration (shown in Fig. 8(c)).In the following, we treat the same problem, but with a different way. We describe a pseudo-potential for the electronphenomenologicallyby a linear combination of one long range Coulombic potential and two short range Gaussian wellpotentials. In the on-center configuration, although the hole is represented by the halogen molecule ion X,; the electronis in reality attracted by a pair of half-anion vacancies, each of which contains e/2 of charge. At the center of this regionof attractive potential there is a fairly large space occupied by XZ,whose pseudo-potential is repulsive. For the oncenter configuration, therefore, we describe the pseudo-potential for the electron by superposition of two Gaussian wellpotentials, which are positioned at half-anion vacancies and a Coulombic potential placed at the center of them to represent a long-range part of the potential. The width of one Gaussianwell was assumed to increase and that of the other well to decrease-03,both linearly with the increase of the off-center shift, while depths ofboth wells were set constant independent of the off-center shift. The9 -0.4:long range part of the potential (Coulomb potential) moves in the0'vopposite direction to that of the halogen molecule ion. At the nn F-H -0.5configuration, where the halogen molecule ion is positioned at oneE.halogen ion site and a halogen vacancy is left, superposition of theu-0.6Coulomb potential and the expanded Gaussian well represent a potential similar to that for an F-center like electron. Following parameters estimated from experimental results were used in the calcu
broken and -unbroken STEs. INTRODUCTION In these several years, relaxation dynamics of excitons in wide-gap ionic crystals has been a subject of extensive studies . The reality of the situation of the STE luminescence is not so simple, however: The first is concerned with the variety in the number of STE bands appearing in particular crystals.