Transcription
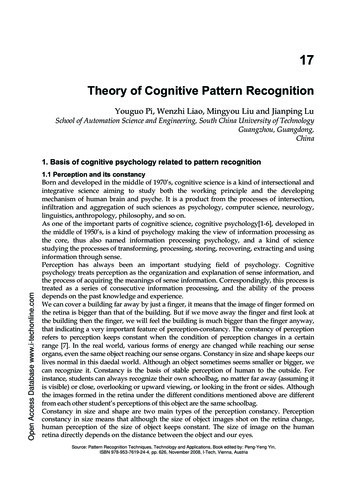
Pattern Recognition and Prediction in Equity MarketLang Lang, Kai Wang1. IntroductionIn finance, technical analysis is a security analysis discipline used for forecasting the direction of prices through thestudy of past market data. The technical analysis of the past market data would usually be focused in the movingaverage of price, support line, resistance line and charting patterns. This type of technique has been widely amongthe traders and investors of the market. However, technical analysis has not received the same level of academicscrutiny and acceptance as more traditional approaches such as fundamental analysis. One of the main obstacles isthe highly subjective nature of technical analysis—the presence of geometric shapes in historical price charts isoften in the eyes of the beholder. So in this project, we propose to build appropriate quantitative models to recognizesome tradable signals from technical perspective from past data and test the signals in the equity market. We willdiscuss generating technical signals from supply and demand perspective, from charting patterns perspective andfrom softmax classification perspective. We back-tested these signals on thousands of stocks and got fairly goodresults.2. Signal Type One: Support Line and Resistance LineSupport and resistance lines appear as thresholds to price patterns. They are the respective lines where prices stopmoving down or up. A support line is the level that a stock's price generally will not fall below. It marks the pricelevel where there is adequate demand to stop, and possibly to turn a downtrend higher. A resistance line is the levelabove which a stock's price typically will not rise. It indicates a price level where an adequate supply of stock isavailable to stop and fend off an uptrend in prices.Support and resistance levels can be identified by trend lines. Some traders believe in using pivot point calculations.The more often a support/resistance level is "tested" (touched and bounced off by price), the more significance givento that specific level. If a price breaks past a support level, that support level often becomes a new resistance level.The opposite is true as well, if price breaks a resistance level, it will often find support at that level in the future.Figure 1: Support Line and Resistance Line1
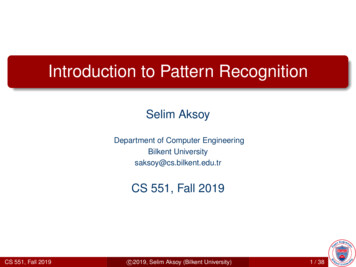
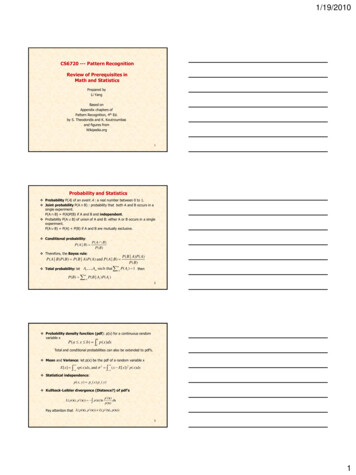
Support and resistance levels are useful in evaluating the stock supply and demand, but the choosing of support lineand resistance line is highly subjective. To test the signals, a quantitative way to detect support line and resistanceline is proposed as follows. First, for any specific stock on a specific day, smooth the past data first to eliminate‘wrong’ local minimums and maximums brought by market noise and find out ten most recent ‘true’ minimum andmaximum points. Second, regress over the past ten local minimums and maximums to get slopes of the two lines. Inour hypothesis, these two lines represents the support and resistance levels and give us signals for trading.We use following principles to trade this signal:1. When price rises to around resistance line, short the stock2. When price goes above resistance line, buy the stock and consider the resistance line as the new supportline3. When price drops to around support line, buy the stock4. When price drops below support line, short the stock and consider the support line as the new resistancelineFollowing are sample plots of support/resistance line and the plot of its trading performanceFigure 2: Recognizing Support Line and Resistance Line in MatlabFigure 3: Performance of Support/Resistance Line SignalsWe can see that the return seem to be quite good, with the risk-adjusted return (ir) being 0.036.2. Signal Type Two: Charting PatternsCandlesticks are usually composed of the body (black or white), and an upper and a lower shadow (wick): the areabetween the open and the close is called the real body, price excursions above and below the real body arecalled shadows. The wick illustrates the highest and lowest traded prices of a security during the time intervalrepresented. The body illustrates the opening and closing trades. If the security closed higher than it opened, thebody is white or unfilled, with the opening price at the bottom of the body and the closing price at the top. If thesecurity closed lower than it opened, the body is black, with the opening price at the top and the closing price at thebottom. A candlestick need not have either a body or a wick.2
Figure 4: Candlesticks ChartThe second type of trading signals that we want to test comes directly from analyzing the candlesticks chart, whichrepresents a stock’s open price, close price, highest price and lowest price of a day. Different shapes of candlestickstypically indicate different distributions of price movement. We can build up programs to keep track of any stock’shigh, low, open and close and recognize different candlesticks chart patterns and test them. For example, ‘hammer’candlesticks are usually a signal of reversal, indicating that the current price trends may not last long any more. The‘hammer’ type is characterized as having a very long shadow, typically twice larger than the real body. Usingmatlab, we are actually able to test many chart patterns to see if they are informative in predicting the future.Following are figures of ‘hammer’ pattern and its trading performance.Figure 5: ‘Hammer’ Type CandlesticksFigure 6: Performance of Charting Pattern Signals4. Signal Type Three: Softmax Regression and Classification of Future ReturnsThe first two types of signals that we talked before are traditional technical analysis methods. In general, thesemethods work fine in the sense that they usually reflect some probability rules. So while we have a very large assetclass that we can trade on, we can get positive return. A third type of technical signals we can think of is from theidea of machine learning class. We all know that equity market is not a complete market, which means that past datacan contain information about future. Therefore, information like past prices, return, trading volume, volatility, etc,may be useful if we can ‘learn’ some patterns from them. Here, we choose to use softmax regression to model therelationship between future return and past market data.The input variables come from a stock’s one day return, 5 days return, ratio of intraday high and low, changes indaily high, low, open and close prices in two consecutive days, difference between morning volume and afternoonvolume and its daily changes, changes in one-day return, daily morning return, daily afternoon return, change indaily volume, ratio of afternoon return standard deviation and morning return standard deviation, changes inmorning return and afternoon return in two days, changes in 5days return in 5 days, and SP&500 return, VIX index,daily top 500 stock return, etc. With above information, we are able to select and construct 24 variables that weconsider to be most informative technical input variables.3
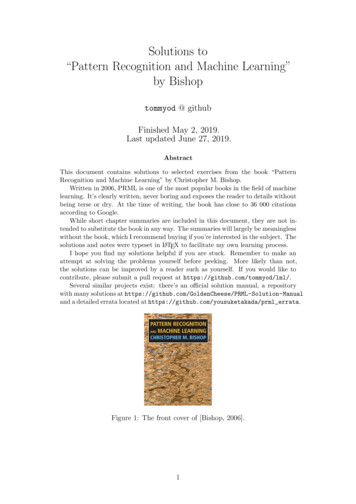
We want to use these input variables to predict tomorrow’s daily return. Future returns are classified into threebuckets:PositiveNeutralNegativereturn 1.5%return -1.5%-1.5% return 1.5%Our goal is to predict which bucket tomorrow’s return will fall into and design a trading strategy using the predictedvalues. Therefore, we implemented softmax regression for this problem (Part of the program comes from “Exercise:Softmax Regression, Stanford UFLDL Tutorial”).Softmax regression is a method to solve classification problems in which the response variable y can take on anyone of k values, i.e.For softmax regression model, we assumeBy linearity, we only need to considerOur hypothesis will out putis linear with, thus:as parameters of the model.In other words, our hypothesis will output the estimated probability thatFor parameter fitting, if we have m training samplesfor every value i 1, ,k., the log-likelihood can be written as:Thus we can obtain the maximum likelihood estimate of the parameters by maximizingin terms of usingstochastic gradient ascent.We trained the model on a data set of size 1000, and applied out-of-sample test on 4706 stocks for 1600 days. Theaccuracy is 46%, which is slightly higher than random guess. Considering the equity market is extremely hard topredict and highly random, 46% accuracy in choosing one from the three buckets is actually a decent number,indicating a positive R-Square between the input variables and dependent variable.To test whether this prediction model is useful in trading or not, we first assign a signal value to the three buckets,indicating how much to buy or sell a stock:PositiveNeutralNegative10-1The performance of this trading strategy is plotted below:4
Figure 6: Performance of Softmax Regression SignalWe can see that trading signals from softmax regression perform ok, but the return line is a little less smooth, whichmeans that this method is still not very steady and consistent and can be further improved.5. Conclusion:Quantitative methods to model three types of technical signals have been discussed and back-tested in this paper.The performance metric of these three types of signals are summarized as follows:Information RatioTurnoverDrawdown(Risk-Adjusted Return)Support/Resistance Line0.0380.51248.6Charting Patterns0.0300.27280.7Softmax Regression0.0231.8459.1We can find that quantitative signals generated from traditional technical analysis give fairly good risk-adjustedreturn and low turnover, but has high drawdown, while the more modern technical signal generated by running asoftmax regression model over many technical variables, gives slightly lower but still positive risk-adjusted returnwith high turnover. The application of machine learning techniques in trading signal construction seems not to beable to beat traditional techniques, but from the performance we can see that this signal has value. Considering thatmodern methods use totally different principles from traditional ones, they generate signals with very lowcorrelations, and thus add value to one another. We can improve the model by selecting better and more inputvariables for the model as well as researching to assign better signal values in the trading process.Reference[1] Andrew Ng. Cs229 lecture notes on Softmax Regression. 2012.[2] Wikipedia. “Support and resistance”, http://en.wikipedia.org/wiki/Support and resistance[3] Wikipedia. “Candlestick chart”, http://en.wikipedia.org/wiki/Candlestick chart5
Figure 4: Candlesticks Chart The second type of trading signals that we want to test comes directly from analyzing the candlesticks chart, which represents a stock’s open price, close price, highest price and lowest price of a day. Different shapes of candlesticks typi