Transcription
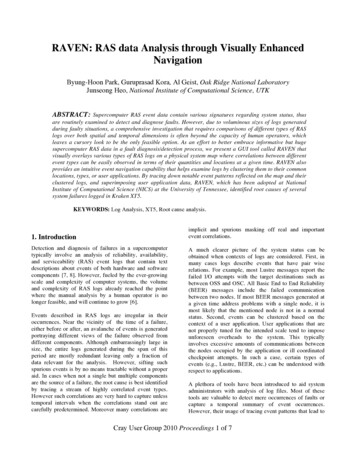
RAVEN: RAS data Analysis through Visually EnhancedNavigationByung-Hoon Park, Guruprasad Kora, Al Geist, Oak Ridge National LaboratoryJunseong Heo, National Institute of Computational Science, UTKABSTRACT: Supercomputer RAS event data contain various signatures regarding system status, thusare routinely examined to detect and diagnose faults. However, due to voluminous sizes of logs generatedduring faulty situations, a comprehensive investigation that requires comparisons of different types of RASlogs over both spatial and temporal dimensions is often beyond the capacity of human operators, whichleaves a cursory look to be the only feasible option. As an effort to better embrace informative but hugesupercomputer RAS data in a fault diagnosis/detection process, we present a GUI tool called RAVEN thatvisually overlays various types of RAS logs on a physical system map where correlations between differentevent types can be easily observed in terms of their quantities and locations at a given time. RAVEN alsoprovides an intuitive event navigation capability that helps examine logs by clustering them to their commonlocations, types, or user applications. By tracing down notable event patterns reflected on the map and theirclustered logs, and superimposing user application data, RAVEN, which has been adopted at NationalInstitute of Computational Science (NICS) at the University of Tennessee, identified root causes of severalsystem failures logged in Kraken XT5.KEYWORDS: Log Analysis, XT5, Root cause analysis.implicit and spurious masking off real and importantevent correlations.1. IntroductionDetection and diagnosis of failures in a supercomputertypically involve an analysis of reliability, availability,and serviceability (RAS) event logs that contain textdescriptions about events of both hardware and softwarecomponents [7, 8]. However, fueled by the ever-growingscale and complexity of computer systems, the volumeand complexity of RAS logs already reached the pointwhere the manual analysis by a human operator is nolonger feasible, and will continue to grow [6].Events described in RAS logs are irregular in theiroccurrences. Near the vicinity of the time of a failure,either before or after, an avalanche of events is generatedportraying different views of the failure observed fromdifferent components. Although embarrassingly large insize, the entire logs generated during the span of thisperiod are mostly redundant leaving only a fraction ofdata relevant for the analysis. However, sifting suchspurious events is by no means tractable without a properaid. In cases when not a single but multiple componentsare the source of a failure, the root cause is best identifiedby tracing a stream of highly correlated event types.However such correlations are very hard to capture unlesstemporal intervals when the correlations stand out arecarefully predetermined. Moreover many correlations areA much clearer picture of the system status can beobtained when contexts of logs are considered. First, inmany cases logs describe events that have pair wiserelations. For example, most Lustre messages report thefailed I/O attempts with the target destinations such asbetween OSS and OSC. All Basic End to End Reliability(BEER) messages include the failed communicationbetween two nodes. If most BEER messages generated ata given time address problems with a single node, it ismost likely that the mentioned node is not in a normalstatus. Second, events can be clustered based on thecontext of a user application. User applications that arenot properly tuned for the intended scale tend to imposeunforeseen overheads to the system. This typicallyinvolves excessive amounts of communications betweenthe nodes occupied by the application or ill coordinatedcheckpoint attempts. In such a case, certain types ofevents (e.g., Lustre, BEER, etc.) can be understood withrespect to applications.A plethora of tools have been introduced to aid systemadministrators with analysis of log files. Most of thesetools are valuable to detect mere occurrences of faults orcapture a temporal summary of event occurrences.However, their usage of tracing event patterns that lead toCray User Group 2010 Proceedings 1 of 7
the root cause of some system failures is highly limited.In this paper, we introduce RAS data Analysis throughVisually Enhanced Navigation (RAVEN) that assistsusers with tracing event patterns through a context-drivennavigation of RAS logs. By displaying the amount ofoccurrences of an event type observed during a selectedtime interval on the system map (physical layout of thesystem), RAVEN provides a compact and intuitiverepresentation of event snapshots. By displaying pair wisecontexts events or superimposing different eventsnapshots, users can trace coherent event correlationpatterns. Also by superimposing the displacement of userapplications on top of event snapshots, events or eventpatterns specific to a certain user application can becaptured.RAVEN has been employed at the National Institute ofComputational Science (NICS) of the University ofTennessee for more than 6 months. During the period, itidentified root causes of several software driven failureslogged in Kraken XT5. RAVEN has also been adopted bythe National Center for Computational Science at OakRidge National Laboratory, and used to monitor andanalyze RAS logs of Jaguar and Spider.The rest of the paper is organized as follows. First wegives background materials of RAVEN. Then thearchitecture of RAVEN is introduced.A detaileddescription of the event types used for Cray XT5 willfollow. Three cases we examined with RAVEN from theKraken and Jaguar logs will then be introduced. Withdiscussion about the future direction of RAVEN, we willconclude the paper.2. BackgroundRAS logs, especially those generated through printk() arein free text forms. Many attempts have been made tocapture semantics from these logs by defining regularexpressions [2, 5, 9] for the desired events. Often theseregular expressions are the results of laborious efforts byhuman experts, and thus most reliable to detect mereoccurrences of critical events. Systems such as Nagios [1]are real-time monitoring of the system based on such harddescriptions of faulty events. These tools are practicallyuseful for immediate discovery of faults. However, theyby no means be used to understand the system status orthe cause of the events in a broader sense.To provide a wider view of the system status, a number ofvisualization tools for monitoring log data have beenintroduced. OVIS [3] gives 3D visual display about statevariables (temperature, fan speed, CPU utilization) andtheir simple statistics. By providing a close-to-realrendering of the system, it has been found to be a usefulFigure 1. A screenshot of RAVEN Frontend UserInterface displaying RAS logs of Kraken. The upperplane (System Layout Map) shows BEER messagesbetween the nodes in two cabinets and Lustre OSSes.The bottom left shows the Control Panel where variousevent occurrence curves are displayed. The bottomright lists all the original log entries generated from anode in c13-2.tool not only for monitoring state variables, but alsotuning system set-up. Splunk aims to assist theidentification of event occurrence pattern. For this, itparses logs, state variables, and other data and indexesthem for an efficient searching.To extract informative clues for the cause of a systemfailure, a tool that provides not only abstract views of thesystem but also the detailed information is desired. Mostexisting tools are practically useful in detecting faults,capturing system snapshots, or retrieving logs that matchuser defined regular expressions. However, their usages tonavigate logs by tracing both temporal and spatial eventpatterns and retrieve detailed information of the system atthe chosen location and time is highly limited.RAVEN ArchitectureTo provide a fast,intuitive, and context assistednavigation capability is the main design goal of RAVEN.RAVEN consists of two parts: the backend databaseserver and the frontend user interface. Both the frontendand the backend were designed for fast retrieval/displayof event synopsis and contexts of RAS logs.The backend database server is a collection of MySQLtables that stores the records of events such as location ofoccurrences, their pair wise context, user applications,original text messages, etc. Besides these dynamic data,static information like system meta data, machine layout,Cray User Group 2010 Proceedings 2 of 7
and identifiers for nodes and resources are created onceduring the initial installation.From a technical point of view, the RAVEN frontend is atool with which a user composes a query and displays theresult on the physical map. A query comprises of 1) atime stamp (or an interval), 2) particular node(s), 3)specific event type, and 4) user application. Usersconstructs a query simply by clicking regions in thephysical map, time line of interest, or choosing aparticular job shown as a block of colours on the physicalmap.The structure of the RAVEN frontend comprises of threeparts.1. System Layout Map2. Control Panel3. Information PanelThe system layout map shows the physical placement ofcabinets with individual nodes depicted as squarestherein. The system layout map is where events aredisplayed with colors representing their amounts ofoccurrences. The displacements of jobs are also shown inthis layout map with the nodes allocated for the jobhaving the same color.The control navigation panel allows users to select timestamps and events of interest. To aid users to selectappropriate time intervals, the panel displays a synopsiscurve for each event type. It also provides multiresolution views the curves so that users can navigate andselect the most desired time stamp. When an event typeand a time stamp is selected, the amounts of occurrencesof the event type are shown in the system layout map.The information panel is where information about a job oran event are detailed. When a node in the system layoutmap is clicked, the original log entries generated from thenode or information about a job running in the node aredisplayed depending on user’s intention.RAVEN on Cray XT5RAVEN runs on CRMS log files. More specifically thebackend server is built on four log files: console,consumer, netwatch, and apsched. From the first threelogs, RAVEN currently extracts the following events. console: Lustre, Basic End to End Reliability(BEER), Segfault, Out of memory, Kernel panic,Machine Check Exception (MCE) consumer: node heartbeat failure, node voltagefault netwatch: Link Inactive, deadlock timeoutIn addition to these events, as with the Simple EventCorrelator (SEC), users can define and add a new eventsimply by providing a regular expression that describespatterns of the event in logs. Apsched logs are used toupload user application information such as duration ofthe run, application name, the list of nodes occupied, etc.3. Case Study with RAVENIn this section we introduce three cases when RAVENwas used to decipher the causes of abnormal behavioursof the system. In particular, we highlight how RAVENcan be used to keep track of and get an immediate viewon system status. The first two cases are from logs ofKraken and the third is from that of Jaguar.Case I: A Flood of Basic End to End Reliability(BEER) Messages in KrakenProblem Description: The NICS system administratorsdetected a number of periods during which abnormallyhuge floods of BEER messages logged. Cray engineersspent days to identify the cause of these Portal errors,tracing hardware related causes.We examined one of the periods when such a flood ofBEER messages was observed. We first displayed thedistribution of BEER messages on the system layout map.Figure 2-(a) shows the nodes that are generating BEERmessages, and Figure 3-(b) illustrates the nodes that areaddressed to have problem with the reporting nodes. Fromthis pair wise context (source and destination), it becameclear that the problem is confined to a single application(both reporting and the reported nodes are the same).Then we checked the application displacement at the timeas shown in Figure 2-(c). From this, we could identify theyellow coloured application corresponds to the nodesgenerating the BEER messages. We then checked Lustremessages generated during the same interval (Figure 2(d)), and found that they were all generated by the nodesallocated for the same application (yellow coloured). Thisconfirms that the yellow coloured application was indeedthe single source of the problem.The identified application ran for only about two minutes,and Lustre and BEER messages quieted down thereafter.However, after examining all the periods during whichthe same application was running by the same user, weidentified that it triggered the burst of Lustre and BEERlog messages during the previous week. In summary, wecan identify the strange new pattern of error messagesusing RAVEN and guide ourselves to the cause of it. Themassive errors on BEER were caused by a single job thatran in short intervals and we can trace them for everyincident.Cray User Group 2010 Proceedings 3 of 7
Case II: HSN Blackout and Recovery in Kraken4. ConclusionProblem Description: Lustre error codes -107(ENOTCONN) and -110 (ETIMEOUT), which suggestHigh Speed Network (HSN) issues, were observed. Weconfirmed that the HSN was not responding. A hugesurge of Lustre messages followed and quieted down. Theblackout was lifted in about 15 minitues.RAS logs are often only the existing resource from whichclues for a system failure or abnormal behaviours can bededuced. Due to the ever increasing scale and thecomplexity of supercomputers, and redundant andimplicit properties of logs, analyzing RAS logs requiresspecial attentions. This paper introduced RAVEN thataims to assist the system administrators with tracingspatial and temporal patterns. We particularlydemonstrated how RAVEN can be used to identify theroot cause of system problems through context-drivennavigation of logs.By setting the clock of RAVEN to three minutes earlierthan the time of the surge of Lustre messages, we found aheavy congestion on HSN by mapping “Deadlock timeouterrors” on the system layout map as depicted by Figure 3(a). On the map we found C17 column drew our attention.The congestion was more denser in the column. We thenmap the application displacement at the time (Figure 3(b)). RAVEN suggested four applications for furtherinvestigation.aprunID 1345188 yellow in upper-left corner of c17-0aprunID 1356576 dark pink in c17-0,1,2aprunID 1356566 grey in lower c17-3aprunID 1350563 orange in upper c17-3We then examined “Deadlock timeout” patterns observedwhen each of these application was run during the pastseveral days, and identified that the same Deadlocktimeout pattern occurred in the previous day when thesame application for aprunID 1345188 was run. Morespecifically, during the IO cycles of the AprunID1345188, the HSN encountered Deadlock timeouts and itquickly propagated to the column of four cabinets andover the entire system. This suggested that this particularapplication might have caused the blackout of the HSN.Case III: A Router Node Panic in JaguarProblem Description: An avalanche of Lustre and BEERmessage was logged from most nodes in Jaguar for morethan 30 minutes. No HSN congestion was observedduring the period.By setting the time of RAVEN 6 minutes prior to theavalanche of the logs, we noticed that several OSSes ofthe ORNL Lustre Spider System started reportingcommunication problems with one particular router inJaguar. After examining the pair wise context of allsubsequent Lustre and BEER messages, we confirmedthat the communication problem with the same router wasreported in most of the messages; all the compute nodesare pointing to the same router. Six minutes after theOSSes reported the communication problem first, a“kernel panic” was generated at the router node. RAVENcould identify the cause of the avalanche of messages 6minute earlier using message contexts.RAVEN has to be refined in several directions. First,currently it does not serve as a real-timemonitoring/analysis tool. More specifically, the backenddatabase server is manually updated. The real-time updateof database is under development. Second, for a betterportability, we are also trying to remove the backenddatabase by connecting the RAVEN frontend directly toCMS.AcknowledgementThis work is supported by US DOE, Office ofScience, Advanced Computing Science ResearchDivision.References[1] Wolfgang Barth, “Nagios: System And NetworkMonitoring”, No Starch Press, 2006.[2] Jeffrey Becklehimer, Cathy Willis, Josh Lothian, DonMaxwell, and David Vasil, “Real Time HealthMonitoring of the Cray XT3/XT4 Using the SimpleEvent Correlator (SEC)”, Cray Users Group Meeting(CUG), 2007.[3] J. Brandt, A. Gentile, J. Mayo, P. Pébay, D. Roe, D.Thompson, and M. Wong, “Resource Monitoring andManagement with OVIS to Enable HPC in CloudComputing”, 5th Workshop on System ManagementTechniques, Processes, and Services (SMTPS) Special Focus on Cloud Computing, 2009.[4] Bryan Burns, Dave Killion, Nicolas Beauchesne, EricMoret, Julien Sobrier, Michael Lynn, Eric Markham,Chris Iezzoni, Philippe Biondi, Jennifer Granick,Steve W. Manzuik, and Paul Guersch. SecurityPower Tools. O'Reilly Media, Inc.[5] Logsurfer - a tool for real-time monitoring of textbased logfiles, http://www.cert.dfn.de/eng/logsurf[6] Celso L. Mendes, Daniel A. Reed, “Monitoring LargeSystems Via Statistical Sampling”, InternationalCray User Group 2010 Proceedings 4 of 7
Journal of High Performance ComputingApplications, 18(2), 2004.[7] A. Oliner, A. Aiken, and J. Stearley, “Alert Detectionin System Logs”, In Proceedings of the InternationalConference on Data Mining (ICDM), 2008.[8] A. Oliner and J. Stearley, “What supercomputers say:A Study of five sysem logs”, In Proceedings of the37th Annual IEEE/IFIP International Conference onDependable Systems and Networks, 2007.[9] R. Vaarandi, “SEC-a lightweight event correlationtool”, In Proceedings of IEEE IPOM’03, 2003.About the AuthorsByung-Hoon Park and Guruprasad Kora are staffresearch scientists at Computer Science Research Group.They can be reached at parkbh@ornl.gov andkoragh@ornl.gov. Al Gesit is the group leader ofComputer Science Research Group. He can be reached atgst@ornl.gov. Junseong Heo is a system administrator atNational Institute of Computational Science (NICS),UTK. He can be reached at jheo6@utk.edu.Cray User Group 2010 Proceedings 5 of 7
!Figure 2. BEER and Lustre snapshots, and application displacement when Kraken isflooded with BEER messages. From top to bottom, (a) Nodes generating BEERmessages (source nodes), (b) Node the BEER messages are reporting (destinationnodes), (c) Nodes generating Lustre messages, (d) application displacement. Fromthe figures, it is clear that both BEER and Lustre messages are generated from thesame application (colored yellow)!Cray User Group 2010 Proceedings 6 of 7
Figure 3. (a) Deadlock Timeout snapshot when HSN of Kraken is not responding(Top). (b) Application displacement (Bottom). Congestion is most severe at thecolumn of C17.!!Cray User Group 2010 Proceedings 7 of 7
map is clicked, the original log entries generated from the node or information about a job running in the node are displayed depending on userÕs intention. RAVEN on Cray XT5 RAVEN runs on CRMS log files. More specifically the backend server is built on four log files: console, consumer, netwatch, and apsched. From the first three