Transcription
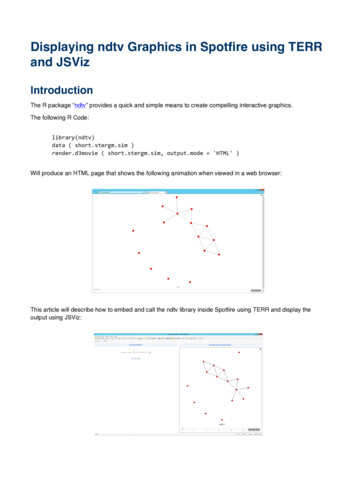
Displaying ndtv Graphics in Spotfire using TERRand JSVizIntroductionThe R package “ndtv” provides a quick and simple means to create compelling interactive graphics.The following R Code:library(ndtv)data ( short.stergm.sim )render.d3movie ( short.stergm.sim, output.mode 'HTML' )Will produce an HTML page that shows the following animation when viewed in a web browser:This article will describe how to embed and call the ndtv library inside Spotfire using TERR and display theoutput using JSViz:
PrerequisitesThere are a number of components that have to be in place:1) TERR R 4.4.0.2) TIBCO Spotfire Statistics Service running TERR 4.4.0. This is required if you need to run the solution inthe Spotfire Consumer or Business Author.3) The ndtv and datasets packages installed in TERR. Use the command install.packages("ndtv")and install.packages("datasets") in the TERR Console.4) JSViz extension v3.4.0.10 or newer. This can be downloaded from TIBCO Community here. Followthe instructions in the User Guide to install the extension.It is important to use the correct versions listed above as we will use new features that have recently beenadded.It will also be useful to have a basic understanding of how to setup Spotfire Data Functions, but we will try toexplain the steps as simply as possible.Creating the R CodeThe basic R Code that we showed above will create a file on disk that contains everything needed to display thevisualization in a modern web browser. If we look at the HTML file generated, the required JavaScript files andJSON data needed to draw the network are embedded in the file: !DOCTYPE html html lang 'en' head meta charset 'utf-8' !-- css for styling the d3.slider lib -- style type 'text/css' . /style !-- minimized d3.js library -- script . /script !-- minimized jquery js library -- script . /script . /head body script //INIT GRAPH DATA HEREvar graphData {"render":[{" . };var options {"ndtv.version":"0.10.0,2016-5-6"};//END GRAPH DATA INIT//Insert init JS Here (function() {options.graphData graphData;var graph new ndtv d3(options);}) /script /body /html In order to use this code in JSViz we just need to encapsulate it within a Data Function that will return the aboveHTML into a Spotfire Document Property. From there, JSViz will take care of displaying the chart.Capturing the HTML OutputThankfully, the designers of ndtv provide an option filename 'tempfilename' that allows us to specify wherewe want to write the generated HTML file. We will use the R function tempfile() to create a temporary filepath, pass this to the render.d3movie() function and then return this data to Spotfire in a Document Property.JSViz will then have the HTML data it needs to draw the graph.So our R Code will look like this:
# get a data setdata(short.stergm.sim)# create a temp file pathhtmlfilepath - tempfile ( "ndtv demo" )# render the json into the temp filerender.d3movie (short.stergm.sim,filename htmlfilepath,output.mode 'HTML',script.type 'embedded',launchBrowser FALSE)htmlout - readChar ( htmlfilepath, file.info(htmlfilepath) size )We are now ready to put the code into Spotfire.Spotfire SetupAs a first step we will setup the Spotfire Data Function to call the R code and return the output as a DocumentProperty with all the required HTML code embedded. We will then display this in JSViz.Creating the Data FunctionYou will need to open Spotfire with some dummy data. We are not sending this data into our Data Function soit can be anything at all.Click on EditàData Function Properties and the following dialog will appear:Click on “Register New ” to bring up the “Register Data Functions ” dialog and select “R Script – TIBCOEnterprise Runtime for R”. The dialog will look as follows:
Enter a title for the Data Function, we used “Create ndtv Video” and add datasets and ndtv to the list ofpackages. Also uncheck the “Allow caching” options. In the script box enter the following R code:# get a data setdata(short.stergm.sim)# create a temp file pathhtmlfilepath - tempfile ( "ndtv demo" )# render the json into the temp filerender.d3movie (short.stergm.sim,filename htmlfilepath,output.mode 'HTML',script.type 'embedded',launchBrowser FALSE)# Return the HTML outputhtmlout - readChar ( htmlfilepath, file.info(htmlfilepath) size )Note that the last line is special to the Spotfire Data Function and tells Spotfire how the HTML data will bereturned. Our dialog will now look like this:Switch to the “Output Parameters” tab and set the output to be returned in a variable called “htmlout”:
Click “Close”. Spotfire will prompt you to save your new Data Function in the Library.
Inserting the Data FunctionCreate a Document Property of type String to hold the HTML data. We called ours “HTMLData”.Now, on the Data Function Properties dialog, click on the “Insert ” button, pick the Data Function you justcreated and the “Edit Parameters” dialog will appear. Select the “Output” tab and assign the output to theDocument Property you created:Click OK to close the “Edit Parameters” dialog. Click on “Refresh” to run your Data Function and then checkthe Document Properties and you should see that it contains the HTML for the visualization. You will mostlikely have to copy the contents of the Property into Notepad to see it, due to the HTML content.àClose the Data Function Properties dialog.We are now ready to setup JSViz to render the visualization.
JSViz SetupAdding a JSViz VisualizationClick on the JSViz toolbar icon to add a JSViz visualization. By default JSViz will set the Data item to be thedefault visualization in the DXP file. This is fine for our demo as we will not use any of this data to generate thevisualization.The next step is to add the HTML content from the Document Property “HTMLData”.Adding HTML Linked ContentOpen the properties for the JSViz visualization and navigate to the Library page. Add a Linked Content itemcalled “chart.html” using the special syntax “%%DocProp.HTMLData%%”.Once added, the Library page should look like this:Configuring the page contentsThe last step is to tell JSViz to use our html content item to draw the page.Click on the JSViz “Contents” page, and use the arrow to add “chart.html” to the Used Content list.
àAt this point the visualization will appear in the JSViz window:
Adding a Refresh controlOur example uses data created in R so the video output does not change over time. However in real-worldsituations it would be more likely that data would flow from Spotfire into R which would result in the JSON databeing re-generated and the visualization redrawn.To simulate this behaviour, and to allow for the case where R reads the data from some external source, we willadd a Refresh button to re-execute the Data Function.Adding a Refresh buttonAdd a Text Area to the left of the visualization and click to edit the Text Area contents.Click on Insert Action Control. In the Action Control dialog, select “Data Function”, pick the Data Functioncreated earlier and give it a suitable name such as “Refresh Video”. Click OK when done.àClose the Text Area editor. Clicking the “Refresh Video” button will cause the JSViz visualization to update.Note that the layout algorithm used is not deterministic, so the layout of the items will most likely change everytime the button is clicked.
Adding customizationTo demonstrate how to customize the end visualization we will add a slider to control how many time slices thatvideo contains. We will also setup the visualization to update whenever this setting is changed, removing theneed for the update button.Adding a NumSlices Document PropertyCreate a new Integer Document Property with an initial value of 25.àUpdate the Data Function configurationWe need to tell the Data Function to use this new Document Property as an input parameter and update the RCode. We will also tell the Data Function to run automatically whenever the Document Property changes.Click on Edità”Data Function Properties” then click on “Edit Script ”. Update the R Code to insert thehighlighted lines: # create a temp file pathhtmlfilepath - tempfile ( "ndtv demo" )# Set the slice parametersslice.par list(start 0,end numSlices-1,interval 1, aggregate.dur 1,rule par slice.par)# render the movie into the temp file Switch to the “Input Parameters” tab and add a new Input Parameter called “NumSlices” as shown:àSave the changes and close the “Edit Script” dialog.Click on “Edit Parameters ”. Assign the “NumSlices” input parameter to be fed from the “NumSlices” DocumentProperty, and set the “Refresh function automatically” option as shown:
Save the changes and close the Data Function editor dialog.Update the Text AreaWe can now add a slider control to adjust the value of our “NumSlices” Document Property between 1 and 25.We can also remove the Refresh button as the visualization will automatically refresh when the slider ischanged.Edit the Text Area and remove the Refresh button.Click on Insert Property Control and select “Slider”. In the Property Control dialog, select the “NumSlices”Document Property and select “Numerical range” with values from 1 to 25. Click OK when done.àAdd some text to describe the slider control and then close the Text Area editor. Moving the slider will nowcause the JSViz visualization to update:
Wrap-UpWe have looked at how to create a simple example of using the ndtv libraries and how to integrate this intoSpotfire along with how to pass in parameters. Hopefully by using these steps as a starting point, you shouldbe able to create your own interactive visualization inside Spotfire using your data.
Displaying ndtv Graphics in Spotfire using TERR and JSViz Introduction The R package "ndtv" provides a quick and simple means to create compelling interactive graphics. . " dialog and select "R Script - TIBCO Enterprise Runtime for R". The dialog will look as follows: Enter a title for the Data Function, we used "Create ndtv .