Transcription
White PaperCisco Firepower Threat Defense(FTD) SNMP Monitoring 2020 Cisco and/or its affiliates. All rights reserved. This document is Cisco Public Information.Page 1 of 14
ContentsIntroduction . 3Health monitoring options on Cisco Firepower appliances . 3FTD architecture . 3Hardware and software components .3SNMP monitoring on Firepower appliances .4FTD health monitoring from FMC . 6Monitoring critical parameters on FTD . 6CPU monitoring. 6CPU monitoring using SNMP from FXOS .6CPU monitoring using SNMP from FTD .7FMC health policy for CPU monitoring .7Memory monitoring . 7Interface monitoring using SNMP . 7Hard disk monitoring using SNMP . 8Configuring SNMP for FTD . 8Configuration steps . 8SNMP OIDS for monitoring FTD . 10FMC – health monitor . 11Health monitor alerts . 11Health monitor policy . 12Configuring SNMP on FXOS . 14 2019 Cisco and/or its affiliates. All rights reserved. This document is Cisco Public Information.Page 2 of 14
IntroductionContinuously monitoring the health of a network appliance is one of the most critical activities performed by almostevery administrator. The parameters that most accurately convey the overall health of any network appliance are:1.CPU utilization2.Memory utilization3.Interface statistics4.Hard disk utilization (if the appliance has a hard disk and is used for its regular operations)Most device administrators prefer some form of automation to monitor these parameters. The tool of choice for thisin most cases is Simple Network Management Protocol (SNMP).In this article, we will primarily discuss the SNMP monitoring capabilities of an appliance running Firepower ThreatDefense (FTD). We will also look at health policies that can be configured from the Firepower Management Center(FMC), which is another way to monitor the health of the managed devices automatically from the FMC.Health monitoring options on Cisco Firepower appliancesThere are at least three options available for monitoring the health of a Cisco Firepower appliance running FTD.Two of these options rely on SNMP from two different software sources. The third one relies on custom scripts thatFMC runs on its managed devices.FTD architectureIn order to understand the data returned by the SNMP probes, it is important that we understand the high-levelarchitecture of FTD and Cisco Firepower appliances.Hardware and software componentsEvery Cisco Firepower appliance contains four main components:1.The supervisor2.The Firepower Extensible Operating System (FXOS), which is the operating system installed on the supervisor3.The security module(s)4.The security software running on the security module (the security software that this paper discusses is FTD)The supervisor and security modules are hardware components, and the FXOS and FTD are software running onthe respective hardware components.The supervisor contains built-in physical interfaces and also has the option of adding more interfaces by insertingexternal network modules. All the physical interfaces (both built-in interfaces and external network modules) on theappliance are part of the supervisor module.In the current range of hardware appliances, we have the following: Firepower 2100 Series Firepower 4100 Series Firepower 9300 SeriesThe Firepower 2100/4100 appliances are 1RU with the facility to host a single logical FTD device. The Firepower9300 range is a 3RU, modular security appliance which allows for up to 3 security modules to be inserted, each ofwhich can host a logical FTD device. 2019 Cisco and/or its affiliates. All rights reserved. This document is Cisco Public Information.Page 3 of 14
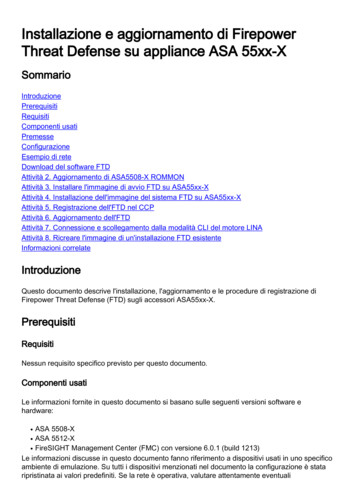
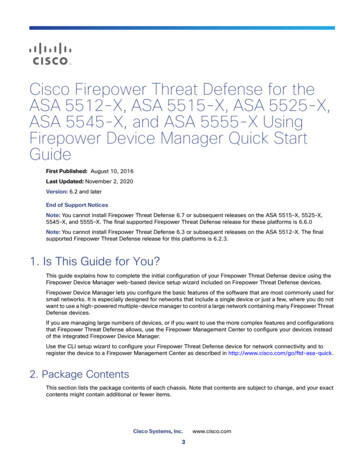
Since v6.3 of the FTD software, the FP4100/9300 appliances are capable of running multiple instances of FTDwithin a single appliance/security module. Each instance of FTD deployed in this way is a fully independent logicaldevice consuming resources dedicated to it.The security software (FTD logical device) running on security modules only has logical interfaces. The supervisoralso consists of a built-in hardware switch. This switch is what connects the physical interfaces available on thesupervisor to the logical interfaces that are created on security software running on the security modules.Firepower appliances have two major subsystems:The Firepower Extensible Operating System (FXOS) which controls the chassis hardwareThe Firepower Threat Defense security application which runs within the moduleBreaking things down a little further, the FTD software is a unified image which consists of two main engines, Snortand LINA. The LINA engine derives from the classic Adaptive Security Appliance (ASA) from Cisco and is responsiblefor the initial handling of packets as well as functions such as routing and network address translation. It isalso referred to as the Data Plane. The Snort engine is where the higher-level inspection functions take place.The current SNMP engine of the FTD software is based on the classic ASA and has visibility into the LINA relatedfeatures.FX-OS and FTD have independent control planes and for monitoring purposes, they have different SNMP engines.Each of the SNMP engines provides different information and you might be interested in monitoring both for a morecomprehensive view of the device status.In the current FTD releases, the SNMP Management Information Bases (MIBs) supported on the FTD relayinformation only about the data plane.SNMP monitoring on Firepower appliancesEach independent software component provides its own SNMP monitoring capabilities. In the case of FTD runningon Cisco Firepower appliances like 4100 and 9300, there are two main software components:1.The FTD software2.The FXOS softwareFirepower 4100/9300 devices have a dedicated interface for the device management and this is the source anddestination for the SNMP traffic addressed to the FXOS subsystem. In addition, the FTD application uses a LINAinterface (data and/or diagnostic) for the SNMP configuration. 2019 Cisco and/or its affiliates. All rights reserved. This document is Cisco Public Information.Page 4 of 14
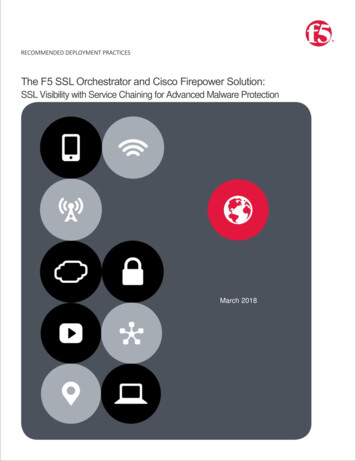
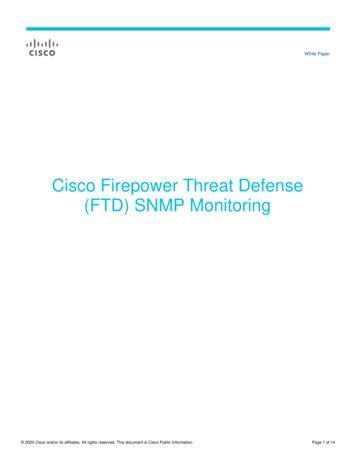
Figure 1.Logical view of FP4100/9300 SNMP architectureThe SNMP engine on Firepower 2100 appliances uses the FTD management interface and IP address. Theappliance itself bridges the SNMP traffic received on this interface and forwards it to the FXOS software.Figure 2.Logical view of FP2100 SNMP architectureEach software component has its own management plane and their respective managers. FMC manages the FTDsoftware and Firepower Chassis Manager (FCM) manages the FXOS software. For the 2100 series appliances, thetwo management planes still do exist, but they are both managed from the FMC. 2019 Cisco and/or its affiliates. All rights reserved. This document is Cisco Public Information.Page 5 of 14
SNMP monitoring from FXOS provides details for the entire security module. It does not differentiate between thevarious logical devices (security software installed on the security module) running on the security module. SNMPmonitoring from FTD provides details specific to FTD. In the current FTD versions, this data is specific to the dataplane’s resource utilization.FTD health monitoring from FMCAnother option that can be used to monitor the health of the appliances running FTD is using the health monitoringpolicies on the FMC. The health monitor on the FMC tracks a variety of health indicators to ensure that thehardware and software in the Cisco Firepower system are working correctly. You can use the health monitor tocheck the status of critical functionality across your Cisco Firepower system deployment.You can use the health monitor to create a collection of tests, referred to as a health policy, and apply the healthpolicy to one or more appliances. The tests, referred to as health modules, are scripts that test for criteria youspecify. You can modify a health policy by enabling or disabling tests or by changing test settings, and you candelete health policies that you no longer need. You can also suppress messages from selected appliances byblocked listing them.It is also possible to configure email, SNMP, or syslog alerting in response to health events. A health alert is anassociation between a standard alert and a health status level. For example, if you need to make sure an appliancenever fails due to hardware overload, you can set up an email alert. You can then create a health alert that triggersthat email alert whenever CPU, disk, or memory usage reaches the warning level you configure in the health policyapplied to that appliance. You can set alerting thresholds to minimize the number of repeating alerts you receive.The configuration of health monitoring policies is explained in a later section.Monitoring critical parameters on FTDThere are four critical parameters to monitor:1.CPU2.Memory3.Interfaces4.Hard diskCPU monitoringCPU monitoring using SNMP from FXOSFXOS provides average CPU utilization statistics for one and five-minute intervals. The average is calculated for allthe CPU cores irrespective of the process running on the specific core. More specifically, in case of FTD, multiplecores will have data plane threads and Snort instances running on them and two cores will have other systemprocesses running on them. Each of these processes could be differently loaded. The way the data plane is built, itcontinuously queries the interface buffers for incoming packets. This way the cores running data plane threads arealmost always running at 100% CPU utilization. The rest of the processes utilize the CPU only when they havework to do. Because of this difference in the way CPU is used, the average CPU utilization reported by FXOS isquite high, even if the box is idle. 2019 Cisco and/or its affiliates. All rights reserved. This document is Cisco Public Information.Page 6 of 14
CPU monitoring using SNMP from FTDAs discussed earlier, the SNMP from FTD today relays information about the FTD data plane. So when we querythe SNMP module on FTD for CPU utilization statistics, the data returned talks about the CPU utilization of theCPU cores running data plane threads. As discussed in the last section, the data plane CPUs are almost alwaysactive. In contrast to the SNMP queries to FXOS, the SNMP queries to FTD software ensure that the correct CPUutilization values are returned. The data plane only reports the statistics for CPU usage when it has a packet toprocess. It discards the CPU utilization values for the rest of the times when it is just busy checking if there arepackets available to process.With respect to CPU utilization, querying the FTD software is more meaningful since it returns more accurate data.The potential drawback is that the data returned shows the true state of only a subset of the CPUs.FMC health policy for CPU monitoringFMC allows monitoring of CPUs as part of its health policy configuration. If CPU monitoring is enabled, the FMCqueries the sensors for their CPU status and reports the CPU utilization values in the FMC. The CPU utilizationvalues reported by the FMC as part of the health monitoring process are the true CPU utilization values for all theCPU cores.Although the values reported using this approach are the correct CPU utilization values, the problem with thisapproach is that it does not provide any information about the type of process running on the specific CPU.Among the options available to monitor the CPU utilization, the FMC health monitor is the best option to monitorthe device for high CPU utilization cases. As explained later in this paper, one can set up SNMP-based alerts intheir health policies, and that can be utilized to integrate this solution with any existing SNMP-based monitoringprocess that already exists in the managed network.Memory monitoringSimilar to CPU monitoring, memory usage on the device can also be monitored using SNMP from either FXOS orFTD. Additionally, FMC health policies also support memory usage monitoring.Monitoring of FTD memory utilization via SNMP returns information from the data plane threads. It isrecommended that the FMC health policies are used to monitor memory usage on the managed device(s).Similar to CPU monitoring, one can set up SNMP-based alerts in their health policies, and that can be utilized tointegrate this solution with any existing SNMP-based monitoring process that already exists in the managednetwork.Interface monitoring using SNMPFor FP4100/9300 appliances prior to FXOS v2.4.1, data interfaces could not be shared across logical devices. Thismeant that statistics for data interfaces could be queried from either FXOS or FTD. Note: When using SNMP tomonitor shared data interfaces via FXOS, the values returned will be cumulative for traffic across all of the logicaldevices on the appliance.FXOS allows sharing of management interfaces. So if monitoring the interface statistics for management interfaceis a requirement, then for individual logical devices, it must be monitored from FTD. For cumulative statistics formanagement traffic across all the logical devices on the appliance, the shared management interface can bemonitored from FXOS. If there is only one logical device, then the management interface can be monitored fromeither FXOS or FTD, and the values must match. 2019 Cisco and/or its affiliates. All rights reserved. This document is Cisco Public Information.Page 7 of 14
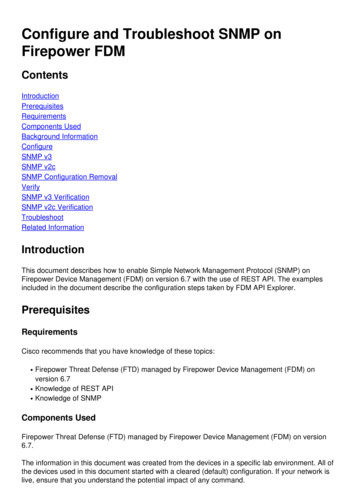
Hard disk monitoring using SNMPFTD does not provide a way to monitor the hard disk usage via SNMP today. If there is a requirement to monitordisk usage, then the FXOS SNMP MIBs can be used. Please keep in mind that the FXOS will be providingaggregate disk usage statistics by all applications running on the security module if there is more than oneapplication installed on it.Configuring SNMP for FTDA managed FTD device can be configured to either generate SNMP traps or to allow SNMP read access (SNMPwrite access is not supported).For FTD devices, a Firepower Threat Defence Platform Settings policy must be created, and the SNMP optionsconfigured. The options consist of defining and enabling SNMP servers, specifying the Read Community string andthe SNMP User Datagram Protocol port to use, and assigning the system administrator name and location ifdesired.Once this is complete, you must define the hosts that are allowed to poll the FTD device. Hosts can be allowed topoll or trap. If trap is defined, a list of event notification traps will be displayed that you can select (all or some).Configuration stepsFTD supports SNMPv1, v2c, and SNMPv3. The monitoring can only be done on FTD data plane level interfacesincluding the diagnostic interface. The FTD management interface cannot be monitored via SNMP becausetechnically it is not a part of the FTD data plane engine.SNMPv2 example (poll)Step 1. Within the FMC GUI, navigate to Devices Platform Settings (Policy) SNMP. Check the option“Enable SNMP Servers” and configure the SNMPv2 settings per task requirements: 2019 Cisco and/or its affiliates. All rights reserved. This document is Cisco Public Information.Page 8 of 14
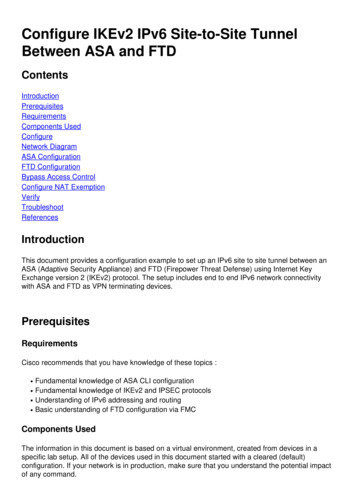
Step 2. On the Hosts tab, click on the Add button and specify the SNMP server settings 2019 Cisco and/or its affiliates. All rights reserved. This document is Cisco Public Information.Page 9 of 14
The finished configuration will look similar to this:Step 3. Deploy the policy.SNMP OIDS for monitoring FTDCisco Firepower primarily uses the health monitor to provide health status events/alerts on system components.There are also some ASA/FTD data plane based SNMP Object Identifiers (OIDs) that are available for monitoringFTD devices. These are mainly focused on data plane (L2-L4 packet) processing.Below is an example of available OIDs.CPUMemory1 minute.1.3.6.1.4.1.9.9.109.1.1.1.1.7.15 minutes.1.3.6.1.4.1.9.9.109.1.1.1.1.8.1Free memory.1.3.6.1.4.1.9.9.221.1.1.1.1.20.2.1 or .1.3.6.1.4.1.9.9.221.1.1.1.1.20.1.1Standard Linux OIDs are also available for monitoring CPU, swap and memory utilization. Below is an example ofavailable SNMP OIDs that can be monitored.PerformanceSwapMemoryUser CPU time (%).1.3.6.1.4.1.2021.11.10.0System CPU time (%).1.3.6.1.4.1.2021.11.10.0Idle CPU time (%).1.3.6.1.4.1.2021.11.11.0Load average (1 min).1.3.6.1.4.1.2021.10.1.3.1Load average (5 min).1.3.6.1.4.1.2021.10.1.3.2Load average (15 min).1.3.6.1.4.1.2021.10.1.3.3Swap total.1.3.6.1.4.1.2021.4.3.0Swap free.1.3.6.1.4.1.2021.4.4.0Mem total.1.3.6.1.4.1.2021.4.5.0Mem free.1.3.6.1.4.1.2021.4.6.0Mem buffer.1.3.6.1.4.1.2021.4.14.0Mem cached.1.3.6.1.4.1.2021.4.15.0These OIDs measure data plane statistics only. 2019 Cisco and/or its affiliates. All rights reserved. This document is Cisco Public Information.Page 10 of 14
FMC – health monitorIn this section, we will discuss how the internal monitoring system of the FMC can be used to view and retrievehealth statistics from your FTD deployment.A built-in subsystem (health monitor) is automatically configured to obtain the status of various components withinthe platform both for the FMC itself and managed devices. It is used to track a variety of health indicators to ensurethat the hardware and software in the system are working correctly. The health monitor is used to check the statusof critical functionality across a Cisco Firepower deployment.This is achieved by creating a health policy, which contains a collection of tests. The health policy can then beapplied to one or more managed devices. The tests are scripts that run at specified intervals using criteria that theadministrator has specified. In addition to tests running automatically at specified intervals, it is possible to run all orspecific tests on demand.The health monitor can be used to access health status information for the entire system, a particular appliance, ora particular domain in a multi-domain deployment.By default, graphs, charts, and tables display health status information in the GUI. Customizable event views allowfor quick and easy analysis of health status events gathered by the health monitor.In addition to the graphical representation of health status information, health alerts can be configured to allow thesystem to generate alerts to be transmitted to an external monitoring system via email, syslog, or SNMP.Customizable event thresholds allow the administrator to specify when alerts should be generated along with theability to specify which events should or should not generate alerts.For more details on FMC health monitoring, please refer to the Health Monitoring Chapter in the latest FTDconfiguration guide: 3/health monitoring.html.Health monitor alertsAlerts don’t have to be generated only when there is a problem. In fact, you can configure health alerts to generateSNMP traps (for example) to report normal status. That way, your network management station can be used toverify an all green situation.Health monitor alerts can be associated with one (or more) of the following severity conditions: Critical Warning Normal Error RecoveredSo, for example, an alert can be associated with an event such as memory usage that generates every fiveminutes showing normal operation (e.g., mem alert normal). An additional alert can be associated with thememory usage event that triggers a warning when the memory threshold is breached (mem alert warning).Reminder: Alerts can be delivered via SNMP, syslog, or SMTP depending on user preference. 2019 Cisco and/or its affiliates. All rights reserved. This document is Cisco Public Information.Page 11 of 14
Health monitor policyThe health monitor policy allows you to define which health modules to monitor and also specify threshold valuesfor some of them. Some modules apply to the management appliance only, while others apply to both themanaged device and the management server.The first module “Policy Run Time Interval” defines the interval at which the tests are run. The default is fiveminutes, which is defined by Cisco and will suffice for the majority of deployments. This time can be modified ifrequired.Health moduleOn/off or tuneablePolicy Run Time IntervalTuneableNotesFTD managed device and FMC health modulesHealth moduleOn/off or tuneableAppliance HeartbeatOn/offCPU UsageBothCard ResetOn/offCluster/Failover StatusOn/offDisk StatusOn/offDisk UsageBothHealth Monitor ProcessBothInline Link Mismatch AlarmsOn/offInterface StatusOn/offIntrusion and File Event RateBothLink State PropagationOn/offLocal Malware AnalysisOn/offMemory UsageBothPlatform FaultsBothProcess StatusOn/offReconfiguring DetectionOn/offTime Synchronization StatusOn/offNotesManaged device onlyManaged device onlyFP2100 onlyManaged device onlyFMC-only health modulesHealth moduleOn/off or tuneableAMP for Endpoints StatusOn/offAMP for Firepower StatusOn/offBacklog StatusOn/offFMC HA StatusOn/off 2019 Cisco and/or its affiliates. All rights reserved. This document is Cisco Public Information.NotesPage 12 of 14
Health moduleOn/off or tuneableHost LimitBothPower SupplyOn/offRRD Server ProcessBothSecurity IntelligenceOn/offSmart License MonitorOn/off 2019 Cisco and/or its affiliates. All rights reserved. This document is Cisco Public Information.Notes(Physical only)Page 13 of 14
Health moduleOn/off or tuneableSeries Data MonitorOn/offURL Filtering MonitorOn/offUser Agent Status MonitorOn/offVPN StatusOn/offNotesMore information on health monitoring and alerts can be found idev63/health monitoring.html.Configuring SNMP on FXOSMore information on FXOS MIBs can be found y/firepower/fxos/mib/b FXOS Printed in USA 2019 Cisco and/or its affiliates. All rights reserved. This document is Cisco Public Information.C11-741739-0004/19Page 14 of 14
The SNMP engine on Firepower 2100 appliances uses the FTD management interface and IP address. The appliance itself bridges the SNMP traffic received on this interface and forwards it to the FXOS software. Figure 2. Logical view of FP2100 SNMP architecture Each software component has its own management plane and their respective managers.