Transcription
www.pwc.ie/assetmanagementDistributing ourknowledgeFund distribution- UCITS and AlternativeInvestment Funds (AIFs)QR CODE TO VIDEO
ContentsExecutive summary3UCITS5Overview6Key markets7Marketing process13Alternative Investment Funds (AIFs)14Overview15Key markets16Marketing process17European Fund Sales20Distribution channels26Regulatory developments impact fund distribution31Taxation considerations for fund distribution33Case study - Ireland35How can we help37Contacts38Distributing our knowledge – Fund Distribution (UCITS & AIFs)PwCPage 2 of 39
Executive summaryWelcome to the fifth edition of our report on the distributionof Undertakings for Collective Investment in TransferableSecurities (UCITS) funds. This is the first edition of thereport since the implementation of the AlternativeInvestment Fund Managers Directive (AIFMD) whichintroduced the ability to passport Alternative InvestmentFunds (AIFs) for sale to professional investors across the 28member states of the European Union (EU). As a result wehave expanded this report to look at the registration of AIFsfor sale in the EU. We have also included a comparison of theprocedures for passporting UCITS and AIFs around Europe.A new section on European fund sales has also been addedwhere we look at the net sales of funds across Europe by fundtype. Overall in 2013, net assets of UCITS increased by 9%with 23 countries recording an increase in net assets.Twelve countries recorded double-digit percentagegrowth during the year. The top ten countries of distribution in Europe are;Germany, Switzerland, the UK, Austria, theNetherlands, France, Italy, Spain, Sweden andFinland. The top countries of distribution for UCITS outside ofEurope are; Singapore, Hong Kong, Macau, Taiwan,Chile, Peru, Bahrain, Korea, Japan and South Africa. Ireland is a centre of excellence for UCITS productswith 80% of Irish domiciled funds falling under theUCITS regime. It is the fastest growing major crossborder UCITS domicile globally and is the leadingjurisdiction in Europe for two of the main types ofUCITS – Exchange Traded Funds (ETFs) and MoneyMarket Funds. The top 10 countries for the distribution of IrishUCITS are; the UK, Germany, Switzerland, theNetherlands, Austria, Spain, France, Italy, Swedenand Finland.The alternative investment fund industry includes fund typessuch as private equity, real estate and hedge funds. In thisreport we have only focused on hedge funds as this grouprepresents a sizeable portion of the alternative investmentfund industry in Europe.HighlightsUCITS 67,000 registrations in Europe making it the most popular market for UCITS funds – it has over10 times more that the next highest investing region, theAsia Pacific. 86 the number of countries of distribution for UCITS funds - 20 new countries since 2009. 2.5tn is the size of the global hedge fund industry as 35,000 UCITS funds in existence withof 2013 – representing the largest 12 month increase since thefinancial crisis in 2008. approximately EUR 6.9 trillion in assets, at the endof 2013. 20 countries registered net inflows into UCITS funds in key2013, with14 countriesOtherfindings- recordingUCITSnet inflowsgreater than EUR 1 billion. Globally, investment fund assets in mutual fundsstand attrillionfundsas of arethe UCITS.end of2013.ofEURIrish23.79domiciled80%AIFs 449bn in hedge funds in Europe making it the 2ndlargest region for hedge funds in the world.20% of global hedge funds are domiciled in Irelandmaking it the largest in Europe.16 countries are confirmed as open for private placementunder AIFMD.50% of the top 10 European hedge fund managers haveOther key findings - AIFsset up hedge funds in Ireland.Distributing our knowledge – Fund Distribution (UCITS & AIFs)PwCPage 3 of 39
Other highlights Final figures for 2013 put the growth in global hedgefunds in relation to performance-based gains and netasset inflows for the year at US 103 billion andUS 137 billion respectively. France, The Netherlands, Sweden, Liechtenstein,Spain, Austria, Finland, Switzerland, the UK and Italyare the top ten markets for hedge fund distribution inEurope. 16 countries are confirmed as open for privateplacement, they are: Austria, Bulgaria, Cyprus, CzechRepublic, Estonia, Finland, France, Germany, Ireland,Lithuania, Luxembourg, Netherlands, Romania,Slovakia, Sweden and the UK. The UK, Ireland and Luxembourg are part of a groupof countries that have not imposed additionalconditions for private placement. They have appliedthe minimum AIFMD standards. Ireland is a jurisdiction that is synonymous withhedge funds. It is the largest hedge fund domicile inEurope with over 2,000 funds and over USD 200billion in assets. According to Lipper, some of the main countrieswhere Irish hedge funds are sold are Germany, Italy,Luxembourg, Singapore, Sweden, Switzerland and theUK.We hope you find this reportuseful. We are happy todiscuss any of the pointsraised. Please see contactslisted at the end of ourdocument.Distributing our knowledge – Fund Distribution (UCITS & AIFs)PwC In a number of European countries there has been adecline in domestic fund sales over the last four yearsand the subsequent growth of cross border fund sales.France is a clear example of this where there has beena large increase in the sale of foreign funds over thelast two years which followed a decline in domesticfunds sales in the two previous years. The UK isanother large market that has seen some notablegrowth in cross border fund sales over the last twoyears. There has been over EUR 500bn in Europeaninvestment fund net sales over the last 4 years, ofwhich EUR 400bn was in bond fund sales and EUR100bn in equity fund sales. Looking at the largest markets in Europe over the lastfour years, we see that the UK, Sweden and Norwayhave had the greatest amount of net sales. Italy,Germany and Spain saw growth in 2013 afterexperiencing net outflows in prior years.TheNetherlands, France and Belgium have allexperienced significant outflows over the last fouryears. Europe is a very fragmented market when it comes tofund distribution channels. In Central and EasternEurope funds are mainly distributed through retailbanks. In Switzerland and the Nordics, distribution isthrough the private banking sector. ContinentalEurope is still retail bank dominated but withcontinued growth in the private banking channelexpected. The Independent Financial Advisors (IFAs)channel, prominent in the UK and Germany, may bereplaced with other channels due to upcomingregulation. By 2020 we predict that four distinct regional funddistribution blocks will have formed which will allowproducts to be sold pan-regionally. These are: NorthAsia, South Asia, Latin America and Europe. A number of countries have put in place locallegislation to ban inducements – these include; theNetherlands, Germany, the UK, Sweden andSwitzerland. In recent years, several European jurisdictions, suchas Austria, Switzerland, Belgium, Germany, Italy andthe UK, have either introduced new tax reportingregimes or modified existing ones.Page 4 of 39
UCITSDistributing our knowledge – Fund Distribution (UCITS & AIFs)PwCPage 5 of 39
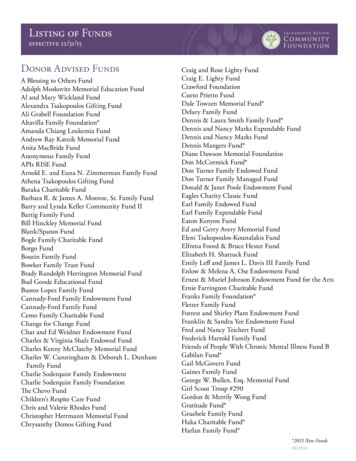
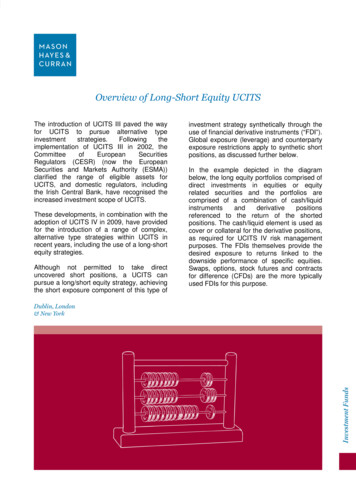
OverviewWorldwide assets in mutual funds stood at EUR 23.79 trillion at the end of 2013, according to the European Fund and AssetManagement Association (EFAMA). Looking at the worldwide distribution of mutual fund assets, the US and Europe account fortwo of the largest markets in the world. Australia, Brazil, Canada, Japan, China, Rep. of Korea, South Africa and India follow in thisranking.Top Countries/Regions of Worldwide investment fund assets0.90%0.30%1.50%0.50%5.00%Other countries include:0.90%Argentina, Chile, Costa Rica, p of KoreaSouth d and Tobago, New Zealand,Pakistan, Philippines and Taiwan.Source: EFAMA International StatisticalRelease Q4 2013Mutual fund industries differ greatly from region to region. This report focuses on Europe where the majority of mutual funds are setup as Undertakings for Collective Investment in Transferable Securities (UCITS) which are governed by European legislation. UCITSbenefit from an EU wide “passport” which means that once they are authorised in one EU member state, they can be sold in any otherEU member state without the need for additional authorisation. Due to the necessity to comply with a common European standard,UCITS are now regarded globally as very well regulated funds, with robust risk management procedures, a strong emphasis oninvestor protection and coming from a stable environment. As a result, the UCITS brand is recognised beyond the EU and UCITSproducts are accepted for sale in Asia, the Middle East and Latin America.UCITS funds are domiciled in 27 European countries, the largest being France, Germany, Ireland, Luxembourg and the UK. Overallin 2013, net assets of UCITS increased 9%, with 23 countries recording an increase in net assets. Twelve countries recorded doubledigit percentage growth during the year.The UCITS product has had huge success since its inception in 1985. Now almost 30 years old, UCITS have gone from strength tostrength, with over 35,000 UCITS funds with approximately EUR 6.9 trillion in assets, as of the end of 2013, according to EFAMA.While the number of UCITS funds has reduced since 2011 the size of assets has increased. This is due to some fund managersrationalising their fund ranges following the adoption of UCITS IV in 2011 which introduced fund mergers and master/feederstructures into the UCITS framework.Source: EFAMA StatisticsDistributing our knowledge – Fund Distribution (UCITS & AIFs)PwCPage 6 of 39
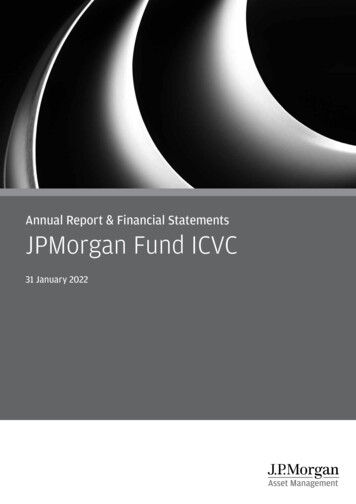
Key marketsEurope is the most popular market for UCITS funds with over 67,000 registrations. This is over 10 times more than the next highestinvesting region, the Asia Pacific region, followed by the Americas and then the Middle East/Africa region. The top ten countries ofdistribution in Europe are; Germany, Switzerland, Austria, France, UK, the Netherlands, Spain, Italy, Sweden and Finland. The topcountries for distribution outside of Europe are; Singapore, Hong Kong, Chile, Macau, Taiwan, Peru, Bahrain, Korea, South Africaand Japan. The tables on the following pages give a complete ranking for all the main regions mentioned above.It is important to note that registrations do not necessarily mean sales of UCITS. When a UCITS wishes to market into a particularcountry it must register with the country’s local regulator. This is a requirement of the UCITS Directive. The UCITS IV Directivestreamlined this process amongst EU member states. This process is outlined in detail on page 13. Therefore, the statistics beloware in relation to the number of UCITS which are registered for sale in each of the individual countries. However, the number ofregistrations for a country does passively correlate to the sales activity for that particular country.Which regions attract the greatest number of UCITS?Source: Lipper for Investment Managers (LIM), December 2013This report was first produced in 2009 and given that this is our fifth edition we thought it would be interesting to examine thegrowth in UCITS registrations over the last five years.Looking at Europe all of the top ten countries have had over 20% growth since 2009, two markets had over 50% growth namelySwitzerland and Finland. Looking at the other European markets outside of the top ten, some countries have had sizeableincreases; Denmark (180%), Greece (70%), Slovakia (80%), Hungary (91%), Cyprus (177%), Malta (73%) and Bulgaria (183%). Onlytwo countries in Europe have seen decreases; Czech Republic (-20%) and Guernsey (-9%).Outside of Europe the countries with the largest growth include; Argentina (2700%), United Arab Emirates (267%), Lebanon(331%) and Mauritius (817%). It is worth noting that all of these markets had less than 50 registrations in 2009. Looking at thelarger markets those with growth more than 30% include: Peru (30%), Macau (35%) and South Africa (61%). Some of the largermarkets have experienced decreases such as Hong Kong (-19%) and Bahrain (-52%).Our analysis highlights a number of new countries for distribution of UCITS since 2009. There are 20 new countries in totalincluding; Barbados, Bermuda, Botswana, British Virgin Islands, Brunei, Cayman Islands, Croatia, Faroe Islands, Greenland,Kuwait, the Netherlands Antilles, Nigeria, Oman, Qatar, Romania, San Marino, Saudi Arabia, Swaziland, Ukraine and Zimbabwe.Distributing our knowledge – Fund Distribution (UCITS & AIFs)PwCPage 7 of 39
Which countries have had the greatest UCITS growth over the last fiveyears?EuropeRanking2013CountryNumber ofregistrations2009Number ofregistrations2013% Growth since 16Greece55193870%17Liechtenstein53367727%18Czech 32Bulgaria46130183%Other includes: Andorra, Croatia, Faroe Islands, Isle of Man, Greenland, Monaco, Netherlands Antilles, San Marino, Slovenia,Romania and Ukraine.Distributing our knowledge – Fund Distribution (UCITS & AIFs)PwCPage 8 of 39
AsiaRanking2013CountryNumber of registrations2009Number of registrations2013% Growth since 20091Singapore2,4202,4180%2Hong orea29732710%6Japan799014%7Other11338-66%Other includes: Australia, Brunei, Cook Islands and New Zealand.AmericasRanking2013CountryNumber of registrations2009Number of registrations2013% Growth since %4Trinidad & er includes: Bahamas, Barbados, Bermuda, Brazil, British Virgin Islands, Cayman, Panama and the USA.Middle EastRanking2013CountryNumber of registrations2009Number of registrations2013% Growth since 20091Bahrain903434-52%2Lebanon1669331%3United Arab Emirates933267%4Other8029-64%Number of registrations2009Number of registrations2013% Growth since 200912219761%Other includes: Kuwait, Oman, Qatar, Saudi Arabia and Turkey.AfricaRanking2013Country1South Africa2Mauritius655817%3Other1252,400%Other includes: Botswana, Egypt, Nigeria, Swaziland and Zimbabwe.Source: Lipper for Investment Managers (LIM), December 2013Distributing our knowledge – Fund Distribution (UCITS & AIFs)PwCPage 9 of 39
Number of new registrations/de-registrations per country each yearThe following table shows the number of new registrations / de-registrations for each country from 2009 up until the end of 2013. Ade-registration occurs when a fund stops marketing to the public in a particular country.If we examine the trends in new registrations and de-registrations over the last five years we can see that all of the top 10 marketsfor UCITS in Europe have had consistent number of new registr
Looking at the worldwide distribution of mutual fund assets, the US and Europe account for two of the largest markets in the world. Australia, Brazil, Canada, Japan, China, Rep. of Korea, South Africa and India follow in this ranking. Trinidad and Tobago, New Zealand, Mutual fund industries differ greatly from region to region.