Transcription
United Way of East Central IowaFinancial Stability Report CardCOMMUNITY GOALBy 2020, increase thenumber of financiallystable households by 15%.KEY STRATEGIES Increase accessibility of safetynet services for low-incomefamilies to achieve stable housing,transportation, and food securitythrough improved coordination ofservices. Increase low-income families’ability to use available resourcesto increase stability and developfinancial management skills. Provide the population with basicand soft skills needed to obtaingainful employment. Increase the number ofhouseholds with family-sustainingincome through acquiring skillsand job training opportunities.THE NEED One in five families make enough to support their household, unlike 59% ofsingle parent households do not make enough to support their family.1 Single-parent households have increased; single mother-headed householdsaccount for nearly one in four and nearly one in ten are single father households.In Linn County, the median income for females is 25,533, which is 15,000 lessthan the median income for males.2 Nearly one in three renters in Linn County are housing cost burdened, whichmeans that they are paying more than 30% of their monthly income on housing.3 In our five-county area, 35,120 people are food insecure. 26,030 reside in Linn County, but only 44% qualify for SNAP.4 An unexpected expense of 400 is enough to put many moderate-to low-incomefamilies in crisis.5 21% of applicants for open jobs lack the basic skills to qualify for the positionopening. In addition, 31% lack the appropriate soft skills and 38% lack the hardskills required to qualify for open positions.6 One in three adults in the five-county area have a high school education or less.7 56% of the jobs available require some skills, but only 33% of the labor forcehas the skills necessary to fill those jobs.81“The Cost of Living in Iowa 2014 Edition.” The Iowa Policy Project, Apr. 2014. Web. Dec. 2015.U.S. Census Bureau; American Community Survey, 2010-2014 American Community Survey 5-Year Estimates,Table T65; generated using American FactFinder http://factfinder2.census.gov ; (November 2015).2U.S. Census Bureau; American Community Survey, 2010-2014 American Community Survey 5-Year Estimates,Table T105; generated using American FactFinder for the Benton, Cedar, Iowa, Jones, and Linn Countygeographies; http://factfinder2.census.gov ; (November 2015).3“Map the Meal Gap.” Food Insecurity By County. Feeding America, n.d. Web. Dec. 2016. px .4Notes:Due to changing strategies and changes datacollection, some values do not exist and are noted byan * in a gray box.As FY15 is a new reporting cycle, many agencieshave changed which indicators to report, have addednew ones, and have dropped others. Therefore, usecaution when comparing FY2014 to FY2015.“Report on the Economic Well-Being of U.S. Households in 2014.” (n.d.): 1. Board of Governors of the FederalReserve System. The Federal Reserve, May 2015. Web. Aug. 2015.562015 Workforce Needs Assessment. Des Moines: Iowa Workforce Development, 2015. Web. Jan. 2015.U.S. Census Bureau; American Community Survey, 2010-2014 American Community Survey 5-Year Estimates,Table T150; generated using American FactFinder http://factfinder2.census.gov ; (November 2015).78Iowa Workforce Development, 2014.
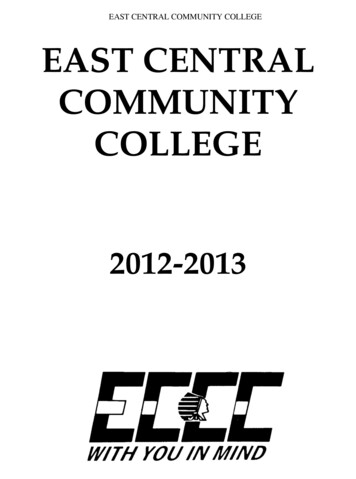
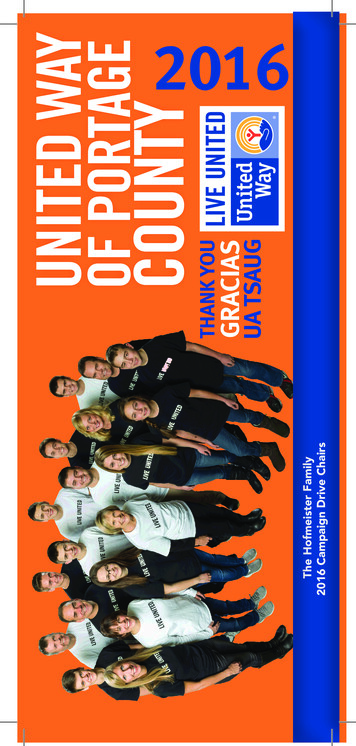
Families Achieving FinancialStability for Five County ogressGoal20%
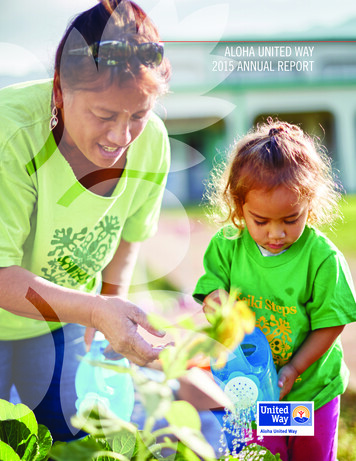
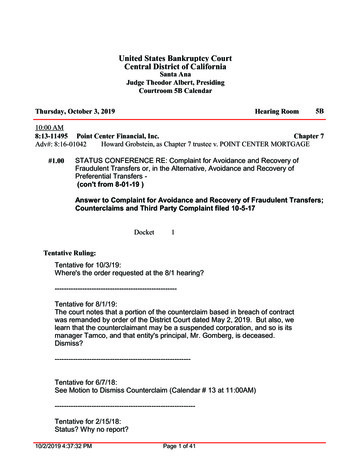
Financial Stability Report CardINTERMEDIATE OUTCOME 1: Basic NeedsLow-income households utilize a safety net of services that support their basic needs.PARTNERS: Catherine McAuley Center, HACAP, Jane Boyd, Safe Place, Salvation Army, Waypoint,and Willis Dady Emergency ShelterPerformance measuresNumber/percentage impactedFY2011 FY2012 FY2013 FY2014 FY2015 FY2016 FY2017 FY2018 ctual)Households that obtained permanent housing atprogram exit372495489406630589Households that maintained permanent housingthree months post program exit*2,059,729444529980485507Households sheltered***834760627557583Food distributed (pounds)*Clients diverted from shelter or prevented fromhomelessnessNEW INDICATORS FY2015Households that accessed community resources toassist in maintaining household stability**809854Individuals who received support with domesticviolence and sexual assault*****1,359300Households where homelessness was preventedand housing was secure for one month*5619581,652(actual)(actual)(actual)2.26 mill 2.42 mill 3.38 mill 4.19 mill 4.73 mill483738RETIRED INDICATORSAS OF FY2014* Decrease in individuals served is due to the fact that in FY14 six agencies contributed to this indicator, but due to funding changes in FY15 only four agencies contribute to this indicator.Of those four agencies, 318 more people were impacted from FY14 (160) to FY15 (480).** Decrease in households sheltered is due to the fact that in FY14 five agencies contributed to this indicator, but due to funding changes in FY15 only three agencies contribute to thisindicator. Of those three agencies, there was a still a decrease of 20 households served: FY14 (577); FY15 (557).*** Individuals receiving support through domestic violence and sexual assault will display an increased ability to better manage stress.
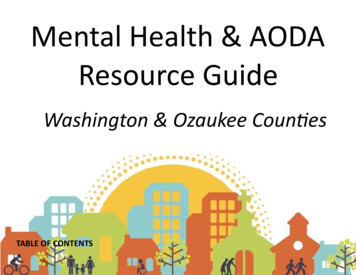
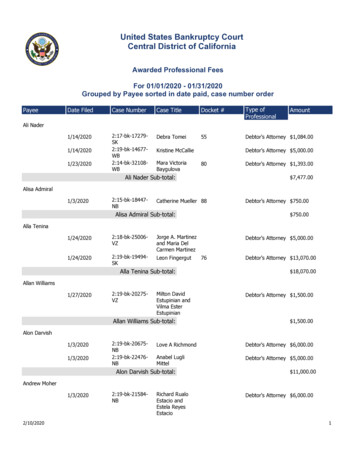
INTERMEDIATE OUTCOME 2: StabilizationLow income households in the workforce utilize support services to close the gap between their earnings and basic living necessities.PARTNERS: The Arc of East Central Iowa, Catherine McAuley Center, Goodwill, HACAP, Horizons, Iowa Legal Aid, Jane Boyd, NTS,Rural Employment Alternatives, Inc., Salvation Army, Waypoint, andWillis Dady Emergency ShelterPerformance measuresNumber/percentage duals assisted with obtaining employment*91128161202354431Households that enrolled and received public benefits theyare eligible for****46174165Households that accessed free tax prep services1,2751,3548141,0331,6951,885Federal taxes returned to low-income households 1.9 mill 2.1 mill 1.3 mill 1.6 mill 2.4 mill 2.8 millFederal and state taxes returned to low-income households** 2.4 mill 2.9 mill 2.8 mill 3.2 millHouseholds that set financial goals and made progress*1,1592,0141,034516624Households that accessed financial mainstream services**854110625Individuals who improved their financial skills*491861656690585Rides ouseholds with a balanced budget552562Individuals who accessed continuing education or receivedsupport services196145Households that received legal assistance (increasesincome or protects employment or other income from actualor threatened garnishment or other diversion from the family’scurrent needs)Individuals who obtained employment or supportive servicesthat increased their net incomeNEW INDICATORSFY2015Individuals who retained their employment or education/training program as a result of receiving a subsidy or supportserviceIndividuals received work supports that enabled them toattain or maintain employment276125256317Bus tickets distributed and rides provided35,61837,94453,49145,705Individuals who increased financial knowledge, reduceddebt, maintained a savings account, and/or increased theircredit score2,4191,7102,960656Individuals who received legal services that maintained orincreased their disposable income5648313321Individuals placed in employment who maintainedemployment for 90 days*92175287Individuals with family-related problems who receivedsufficient service (results in a positive measurable benefit)**355266Households with increased awareness of supports andservices that can assist them with family Y2019(actual)RETIRED INDICATORSAS OF FY2014*Increase in individuals served is due to the fact that in FY14 two agencies contributed to this indicator but due to funding changes in FY15 four agencies contribute to this indicator. Ofthose two agencies, 26 more people were impacted from FY14 (202) to FY15 (228).**In FY14, the only agency reporting on this indicator was Rural Employment Alternatives which is no longer funded under this strategy. In FY15, Iowa Legal Aid, HACAP, and theCatherine McCauley Center reported on this indicator.
INTERMEDIATE OUTCOME 3: Workforce Skill DevelopmentLow-income individuals acquire basic education, post secondary training, and soft skills needed in the workforce.PARTNERS: Catherine McAuley Center, Goodwill, and Rural Employment Alternatives, Inc.Performance measuresNumber of parents l)FY2014(actual)Individuals who increased literacy or basic skill levelIndividuals who earned a short-term certificateNEW INDICATORSFY2015Individuals who earned a credentialIndividuals who pursued further training or obtainedemployment as a result of participating in work experienceactivitiesIndividuals who increased their skill levelImmigrant and refugee coordinator assisted 30 studentsin connecting to community resourcesIndividuals who received skill building )FY2018(actual)RETIRED INDICATORSAS OF FY2014FY2019(actual)
INTERMEDIATE OUTCOME 4: Family Sustaining EmploymentLow-income families obtain and retain family supporting employment.PARTNERS: Kirkwood Community College KPACE ProgramPerformance measuresNumber of parents duals who completed intake, assessment, andadvising/counseling125122Individual who required ABE, GED, and/or ESL instruction8687Individuals enrolled in middle-skill job training13517794107Individuals awarded job-training or industry credential69162Individuals employed in middle-skill jobs4135Individuals who completed training and received wage gain37103NEW INDICATORSFY2015Individuals who completed middle-skill job trainingIndividuals who participated in the program/training304Individuals who completed the program/training98Individuals who obtained new employment positionsNEW INDICATORSFY20142Individuals continuing their education24*2953(62%)Students who earned credential, that increased theirearning potential**3565(76%)Students who obtained employment***58(92%)Students who obtained employment and will attainbenefits, such as health insurance***13(21%)Students who obtained employed and retainedemployment fornine months or more***10(22%)Students who obtained employment and received wage gain***19(41%)Students whose household achieved financial stability***2(9%)*Phase 1 of KPACE Indicators**Phase 2 of KPACE Indicators***Phase 3 of KPACE IndicatorsFY2018(actual)10Individuals who retained employmentStudents who retained their educational plan*FY2017(actual)RETIRED INDICATORSAS OF FY2014FY2019(actual)
One in three adults in the five-county area have a high school education or less.7 56% of the jobs available require some skills, but only 33% of the labor force has the skills necessary to fill those jobs.8 1“The Cost of Living in Iowa 2014 Edit