Transcription
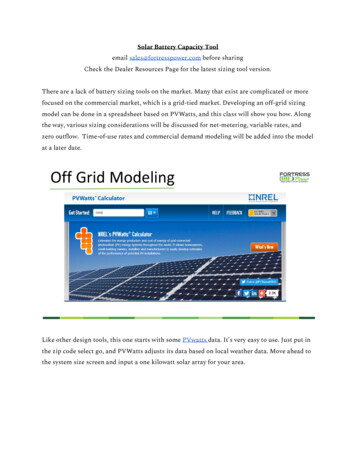
Solar Battery Capacity Toolemail sales@fortresspower.com before sharingCheck the Dealer Resources Page for the latest sizing tool version.There are a lack of battery sizing tools on the market. Many that exist are complicated or morefocused on the commercial market, which is a grid-tied market. Developing an off-grid sizingmodel can be done in a spreadsheet based on PVWatts, and this class will show you how. Alongthe way, various sizing considerations will be discussed for net-metering, variable rates, andzero outflow. Time-of-use rates and commercial demand modeling will be added into the modelat a later date.Like other design tools, this one starts with some PVwatts data. It's very easy to use. Just put inthe zip code select go, and PVWatts adjusts its data based on local weather data. Move ahead tothe system size screen and input a one kilowatt solar array for your area.
If you want to skip this class and just go with a quick and easy solar array size, a quick methodof sizing off grid solar is to match up the monthly consumption with the monthly solarproduction. Many solar arrays without batteries will offset 100% of the annual site consumption,but in off-grid design, start by agreeing not to run out of power at the end of the month.Do not be concerned with spring and fall weather, when the solar array is productive and theelectric load is low. Those differences will vary between whether the building is gas or electric.An all-electric house will have a high winter morning load due to electric heat, whereas insummer weather, the heavy load will come in the middle of the day due to air conditioning. Withgas, spiky load profiles due to cooking or laundry are non-existent. Spiky instant electric waterheaters have a tremendously high load if only for a minute.With off-grid sizing, match 12 months of electric bills up with the PVWatts data so that themonthly solar production always exceeds the monthly home consumption, and that is a greatstarting point for an off grid solar array. The most important design month might be January orAugust depending on the site location and other onsite energy sources. But an off-grid systemshould be reliable - and so there are times when an off-grid solar array produces a large surplusof electricity that doesn't get used.
In the case of grid-tied solar, this surplus electricity is sold back to the grid. But there is a bigdifference between a 100% offset electric bill and a zero outflow solar array.A grid-tied home with a zero outflow mandate might result in a small solar array and a largebattery to operate efficiently. An off grid array might not care about efficiency as much,selecting the largest solar array the budget could afford and accepting a large amount of“stranded energy” won’t get used. Grid-tied solar with good utility buyback might not need alarge battery but could still benefit from a small battery for storage and electric rateoptimization. L et’s create a tool that displays how much electricity a solar array produces, howmuch electricity is consumed instantly on site, and how much is stored into a battery, and how muchis either lost or sold back to the grid.Because our initial system estimate is based on monthly production and consumption, youmight be concerned about times when there are multiple cloudy days in a row. Don't worry PVWatts connects to local weather data so the weather will be considered!
Enter PVWatts data for a 1 kilowatt system and then extract the hourly data to copy and pasteinto the model. The 1kW size is to form a scalar in the model. We will be able to enter our ownsystem size later, multiplying the PVWatts data by what we enter, so we don’t have to runmultiple PVWatts simulations.Go ahead and visit PVwatts t o grab the hourly solar production data for a 1kW array in your area.Put in your zip code and enter in a one kilowatt array.The default values in PVwatts are fairly conservative. The values should be customized based onthe direction the array is facing. East, West, or North facing solar will not produce as much assouth facing, so if you know which direction the array will be facing, enter it in now. But itwon’t impact the overall model very much. The model will be conservative and the defaultPVWatts values are conservative already.At the end of the PVWatts screen, scroll all the way down and export the data on an hourly basis. Don’tselect the monthly download, but rather the hourly download.
The spreadsheet becomes the basis for the model - this hourly data can be copy and pasted rightinto the sizing tool. This raw PVWatts data reveals valuable site data - the amount of sunlight inthe air can reveal how many cloudy days are estimated in winter for example.But planning for multiple days of storage isn’t necessary - solar battery owners will either haveaccess to the grid or a generator to recharge the batteries if they get low. That may sound likecheating, but such a configuration allows comfortable electrical consumption during normalsystem operation, and the user can scale back their electric use during true emergencies.Multiple days of lithium battery storage is too expensive for most customers - a backupgenerator or grid power source is often the most cost-effective option to power through thosecloudy days. Lead acid battery banks would be sized for four or five days worth of storage, butthat much storage is needed for lead acid batteries to function reliably, at a very slow dischargerate. Lead acid needs a slow discharge rate, and so by having four or five days worth of storage,it has one.But lithium iron phosphate batteries do not need such a large amount of storage to be usedefficiently. They are a “two hour” discharge rate to work reliably for the long term. One day’sworth of storage is more than sufficient to run off grid for most of the year. Smaller systems,with greater reliance on an external power source, might be preferable to grid-connectedcustomers. And for off gridders, there will always be cloudy days. A generator plays a key role inoff grid living, so let’s create a tool that allows the user to evaluate solar and battery system sizeas a function of generator run time. Let’s find the right amount of solar and batteries toeliminate the generator from running most days, and then determine how much additional solaror battery capacity is needed to reduce grid or generator use further.
Building your{own energy model is the best way to learn valuable skills which are in demand bythe workforce. But you can also make a copy of our sizing tool - but please do not distribute itwithout written permission.Paste the hourly PVWatts data for a 1kW solar array into the PVWatts tab on the sizing toolspreadsheet. This tab feeds data on the rest of the sheet, such as taking a user-defined systemsize on the System Input tab, and then multiplying the PVWatts information by that systemsize. The results show up on the Hourly Energy Flow tab.
PVWatts outputs its data by the watt, so that needs to be divided by a thousand to convert tokilowatts. The formula is copied throughout the new “Array Output (kW)” column to get the PVarray output for each hour of the year, based on the system size entered into the “SystemInformation” tab.What if this were a commercial project, with PVWatts data needed in fifteen minute incrementsinstead of hourly increments? To create that data, copy the PVWatts data four times and thenre-sort the list by month, day, and hour of the year. The PVWatts data will then meet up withthe 15 minute interval data. If the solar array has a 5kW power output for one hour,it will alsohave a 5kW power output for those 15 minute intervals within that hour. That isn’t quite thesame as getting 15 minute solar data estimates, but that level of detail isn’t even considered incommercial design software, so we’ll ignore it too. This spreadsheet will be based on hourlyPVWatts data, and 15 minute interval data will be added in a separate class.
PVwatts is used all the time for systems without batteries, and PVWatts lacks information onhourly consumption of the building’s electric use. How do you determine that?Net-metering takes the intelligence out of the solar design process. If a one-for-one kilowatthour credit is given for all system outflow onto the grid, the designer can simply look at 12months of electrical data and 12 months of solar production, and adjust the system size until thetwo values match up, but none of that has much consideration for the hourly consumption ordaily consumption or five-minute consumption of the home. In a sense, PVwatts andnet-metering make solar design really simple. As net-metering policies phase out, designexpertise is added back in.Assumptions can be made about the electric load based on the 12 month electric bill history. M aybethese assumptions are not enough to determine the entirety of the system design - such as themaximum size of the battery inverter, but in terms of that power multiplied by a period of time,that time-based number, the kilowatt hour, is what is provided on most electric bills. Knowinghow many kilowatt hours are consumed over a period of a month can then be broken down intoaverage kilowatt hours consumed a given day, or further to a one hour average. In other words,take the electric use for the month, divide by the days in the month, and hours in a day, to get
the average power demand for the month. At the very least, an hourly model can be made basedon the average building load over the course of the month. That kind of model might be okay, ifthe battery bank is large enough, but we will make it more accurate by learning more about loadprofiles.The building instant load may vary wildly from the building 15 minute average load profile, oreven the real hourly profile, and more so from the average load for the month. But we know thatat the end of the month, the site consumption and PVWatts production data balance out with asurplus. To a large extent, we can be more confident in our model because we are using lithiumbatteries, which are more responsive than lead acid batteries.Sunny days have greater air conditioning loads than cloudy days, but there is also more solarproduction when those air conditioners are running.matching that consumption and productionperfectly is tough, but there is an even greater when there are multiple days of cloudy weatherconditions. This model is good enough to catch up on a five-day running average outside ofextreme conditions, and remember the starting guess for the solar array size is to net out everymonth’s consumption vs. production difference. The only way to make the data more accurate isto download hourly or better interval data, and we have a generator playing free safety to
account for any model inaccuracy. So this is about as good as it gets when modeling off gridsystems based on 12 month consumption data.The average USA home uses 11,000 kwh of electricity per year. That will be a big differencebetween electric or gas, or the northern USA vs southern USA, and most solar customers tend tobe on the high end of consumption, although there are extreme off gridders who are well on thelow end of electrical consumption. At any rate, in class we will model a site that uses 15,000 kwhof electricity per year. This is typical of a medium sized, all-electric grid-tied home.On this topic of interval data, commercial electric rates are often billed by the maximum 15minute load of the entire building. That single point on a 15 minute interval graph ofcommercial load for the entire month can comprise 70% of a commercial electric bill in the mostextreme cases.But another kind of pitfall with interval data is not having enough resolution. Most commercialbills are based on 15 minute interval data, whereas PVwatts is based on hourly performancedata. Without a battery, that one hour production could be meaningless to a commercialcustomer, if it all occurs within a 45 minute time frame, and a cloud sits on top of the solar arrayfor the remaining 15 minutes. In that sense, battery models are more forgiving to errors inresolution than batteryless models. Or in other words, a solar array economic model without abattery is more likely to be incorrect than one with a battery. And also, as long as the model isclose enough, remember that battery customers are not as concerned about payback asbatteryless customers. A solar array without a battery can only reduce an electric bill. A solararray with a battery can provide reliable power throughout the day and night.To improve the accuracy of the model, interval data can be useful. Sometimes the end user canlog into their electric utility and download this 15 minute by 15 minute interval data, and thatwill provide a more accurate model than one hour average loads. But it's also worth pointing outthat even more high resolution load profile data would guide the model further, to the pointwhere even 15 minute interval data can be misleading.A customer called into technical support convinced something was wrong with their inverter,
but the inverter company was convinced there was something wrong with the battery. Thisinverter had a 9kW output, but whenever the customer would try to sell 7kW of power to thegrid, the inverter would shut down the grid export. It turned out the customer had a 3kW loadthat would periodically turn on for a few seconds.The inverter would shut down the grid exportin order to keep the load powered up, but that would result in inefficient grid sale. The proofwas a 30 second long recording of the inverter screen - but even then it only recorded one of twoinstances where the grid export was halted. The less obvious instance was too fast, occurring inthe matter of seconds, to be picked up on the inverter screen. The customer was perplexed thatthe inverter would not be smart enough to adjust itself and continue exporting power at an even9kW by simply exporting a little less power. But an inverter doesn’t know if a momentary load isa surge load which will vanish in 5 seconds or a continuous load which will remain on or evenescalate further. And while there are solutions to slow down certain loads, they are inefficient,like driving a car with the parking brake on. Pre-charge circuits that suppress loads are notsomething you do for loads that come on routinely. Well pumps and air conditioners do not lendthemselves as good to surge loads as garage doors and elevator lifts.i'm not concerned about five or six second loads - while there are unusual cases of surge loadsbeing 10 times greater than continuous loads, many inverters can surge for five or six seconds.But loads like hair dryers or electric water heaters or microwaves can surge for a few minutes,well beyond the timescale included in the surge capability of an inverter, but that 5 minute surgelevel may not show up on a 15 minute or hourly interval data.So if you really want to nail your off-grid design, buy consumption meters - either as an add-onto the battery inverter monitoring system or as a 3rd party consumption meter such as Sense,and start taking a close look at the building electric load on a 5 second basis. Just looking at theload is one of the better things you can do for battery project planning. And remember thatloads on 40 amp breakers which only reveal 10 amps of power likely have other internalcomponents which are only used a few times a year, such as ice defrosting or comfort heating.So even 15-minute data can be somewhat misleading.This model is really for battery capacity sizing where the biggest concern is not running out ofenergy - other models, such as consumption modeling or performing a load calculation bycounting up all the appliances and estimating the real time maximum load are more concerned
with instantaneous power. Power is instantaneous, and energy is power multiplied by time, andthat’s another topic for another day. For this class, we're looking at energy rather than power.We’re not going to worry about how many loads we are running at once. Instead we are lookingat how we don’t run out of power after a string of cloudy days.Well, there isn’t much to do about cloudy weather and all but the most ardent environmentalistswill see the value in having a generator backup system for five percent of the year. It’s efficientto use some fossil fuel - it will dramatically reduce the required battery bank size for theapplication. To the point where even a biodiesel system could be considered over a largerbattery bank! The goal of an off grid system for a building should be to substantially reducereliance upon either the grid or a generator charge, but that may include tolerating smallamounts of grid charge, and even optimizing the design for that value. The path to 100%renewables is not taking every building offgrid, but by reducing the reliance of the grid as muchas practical.Coming back down to earth, there are some things we can do to make our energy model betterfit the varying load structures of the site. A building in Canada may not have air conditioning. Abuilding in Mexico may not only use heat to defrost an air conditioner.
Aurora Solar, a solar design software, has a load profile modeler that is pretty fun to play with,and I’ve seen some similar tools on electric utility websites. The load profiles vary based on theseason - for example winter will have electric heating with a higher load in the morning andevening, whereas summer would have escalating air conditioner loads during the hottest timesof day before tapering off at night.Even though these are site specific, they are still general trends that certain groups of customersfollow. You can assume a gas heat home will not have the heavy winter loads of an electric heathome. A home with gas cooking will not have the electrical spikes of an induction burner. Themodel can be fine tuned for this.If we have an average load, we know there will be times of day when the building runs at belowthe average load, and then other times when the building is above the average load, and yesother times when the building load is just average.So to make a more accurate model, we guess at the load profile. Aurora’s tool will ask for aseries of electrical devices and adjust the load profile accordingly. In our model, we will assumethat spiky loads with a 75% premium will occur for eight hours a day, and below average loadswith a 75% discount will occur for eight hours a day. Average loads will be assumed for eighthours a day. The end result is the same consumption as assuming the average load occurs for 24hours a day, but it more accurately models what is actually occurring to the load during that 24hour period, and more importantly, how that load relates to solar production.In fact the assumptions in this model are perhaps too conservative. There are examples of peakloads being 5-6x that of baseloads. So this model will include a tuner adjustment which canincrease or decrease the amplitude of the loads without more hard-coded forms formodification, using a baseline factor of 100%. A flat load profile would decrease this percentagewhereas a spikier load profile would increase the percentage. If building your own data,remember that as long as the 24 hour average load equals the 24 hour combined total of peakand off peak loads, the numbers will balance out. There’s always 24 hours in a day. So in thespreadsheet there is a little table to check to make sure that your assumptions are correct in caseof custom modification. So for these eight off-peak hours,and these eight mid-peak hours, andthese eight peak hours, at these percentage differences, it will sort itself out compared to the 24
hour average load.The weather can also be adjusted. Mexico would be modeled as mostly summer months,triggering summer load profiles. Winter months would be more common to Canada. But theseseasonal load profiles are impacted by gas vs. electric appliance selection, so in the spreadsheetthere is a page that shows how the peak, mid peak, and off peak consumption hours aredistributed based on the season of the end user - requiring manual adjustment. These seasonalload profiles are also linked to whether the load profile is based on a gas or electric load profiles.And so our load profile picture is assumed, customizable and adjustable from within the systeminput tab.Remember how this model incorporates weather data from PVWatts? Well weather data is onlyaccurate to about 10% and we’re already introducing error by modeling the system based onmonthly electric bills. The load profile data similar impacts the model by a couple percentagepoints. We don't have to worry about 1% inaccuracies when the model is already 10%inaccurate. The model will still serve enough role to find the most cost-effective configurationof solar array size, battery size, and generator run time.And because this model includes a generator, we are not creating energy emergencies for thecustomer, but rather providing them with a clean power resource which reduces or eliminates
their grid reliance. The key point here is that an off grid system should not create an energyemergency for the customer. That might mean not getting rid of fossil fuels entirely, butallowing them to play a rare 2nd fiddle.Back to earth - how do we take the PVwatts solar production model and add off-grid sizingcapability to it? Now that the array output from PVWatts is determined and the 12-monthelectric bill is broken into hourly consumption increments, based on load profile assumptions,we can create a model of energy in vs. energy out and where that energy goes.If the accounting is summed up correctly, there's no reason why we can't build our own off-gridmodel in a spreadsheet. There are limits. If building consumption is subtracted from solarproduction, the simple assumption is that the battery is infinitely large - an argument putforward by net-metering critics who argue the electric grid is being used as an infinitely largebattery.Well, our battery is not infinitely large, so we need to set a largest battery size, requiring aformula that says if the solar production minus building consumption is greater than the batterybank capacity, then the battery can only fill up to its maximum capacity, and the remainingenergy is either lost because the battery is full, or sold back to the utility because the battery is
full. That energy is modeled later.For now, start with a guess as to the battery size. The model will show a minimum battery sizeamount, and the guess can be adjusted to make sure the minimum battery size is not negative.An hourly energy flow tab is created to visually inspect the model to ensure proper systemfunctionality. I’ve always found it useful to be able to verbally describe what is happening to thesystem as reflected on a power flow model, and in this example it's midnight at 1amand the solar array isn’t doing anything at all, but a small amount of off-peak electricity is beingconsumed. So that amount of consumption is subtracted from the battery starting capacity andeventually the sun also rises, and the solar array turns back on, and the battery fills back up toits maximum size, where it stops charging, and any extra energy is either sold back to theelectric grid or lost as stranded electricity.In an off-grid setting , it's very common to overproduce more electricity than what is beingconsumed, such as during the spring or fall or on sunny days. The goal is to keep the battery full,and that implies necessitates some wasted energy at the top.Wise off gridders will load shift, doing laundry and even cooking during the day for example,
and that is okay for some. To count this stranded electricity, which otherwise remains asincreased voltage within the solar array itself, is that when the batteries are full, any excess iscounted as either sold back to the grid or lost.Similarly, an infinite battery doesn’t exist and the sun isn’t on all the time. The model candetermine the largest battery size and solar array size to run fully autonomously, but it can alsocompare that against the use of a gas generator. In either event, recognize that as a model basedon average consumption and average weather data, it is not a model robust enough for extremeconditions. This hindrance is offset by the assumption that the battery will not be cycled deeplyand regularly by more than 80% of its total capacity. That extra 20% will be used during thoseextreme times - but at all other times the grid or generator charge will be turned on. When thosecharging resources do not work, that extra 20% will still be available. But the maintenanceissues associated with draining a battery down to 0%, and then trying to discharge it evenfurther without damage, while being more fun than an actually damaged battery, are less funthan keeping the battery within an operating range that will ensure a healthy and long life.That was a long-winded way to say a column is added to the model to indicate that the generatorwill run whenever the battery hits a certain depth of discharge. The model will assign a defaultvalue of 20% to indicate that if the battery is at a 20% state of charge, the generator or grid
charge will turn on.Correspondingly, another column tracks the date that the generator runs and counts the totalnumber of days the generator runs. Most off-gridders want to avoid a generator in order toobtain peace of mind. They understand the practicality of a generator on site, but don’t want torely upon the generator running every single day to get by. Being able to quantify that value tothe customer is valuable. A customer on the fence about buying one eVaults or two can bequantified into how many days per year a generator will need to be run. That helps guide thecustomer to deciding about adding the additional budget.Generator run time has a cost - whether it is the cost of transporting the fuel to the property, orthe cost of the gas itself. If the client is fine with the risk of running the generator for most daysout of the year, the cost of fuel itself can be the reason to increase the battery capacity. Todetermine that number, the hours of generator run time are also counted, with the assumptionthat the generator is run at full capacity. A whole different discussion could be explored aboutthe inefficiencies of running a generator at less than full capacity - the same is true of solar andbattery electronics. For now let’s be satisfied with a spreadsheet that reveals how many hourstotal and unique days a generator or grid charge will need to be applied to the system to keepthe electric load running 24/7.
The reality is that if the grid needs to be relied upon for an hour each day, there will be manydays when the home runs completely off grid, and that during a real emergency, the energyconsumption can be reduced by the end user such that the home functions fully off grid. Butbeing 100% offgrid takes that reliability factor and kicks it up into a whole new ball gameregarding battery sizing and budget. At any rate, a good model will guide the designer to makethe best design for the application.Remember the solar array size is initially selected to offset 100% of the client’s winter orsummer electric bill. The maximum battery bank size is guessed at, and the generator or gridcharges the battery when the battery gets down to a 20 percent state of charge.Every single hour of the day is counted, so we know how many hours the generator runs. And ifthe model were expanded, that generator run time could be ascribed a hard cost based on thecost of fuel and fuel transport. The number of days required for the generator to run will impactthe client's peace of mind, and so to determine the best array size and battery size, it is simply a
matter of running multiple configurations to determine how those factors are impacted.An 8 kilowatt array with a large battery results in 34% of the site energy coming from the grid orgenerator, with the generator running for at least an hour per day for about 2/3rds of the year.The array size and battery bank size can be adjusted to determine which decreases grid reliance.Both are important, and by running multiple simulations, the optimal configuration isdetermined. Effectively, run a bunch of different system sizes through the model to determinewhich model reduces grid reliance the most within the project budget, and that is theconfiguration to use.In this 8kW solar, 18.5 kwh battery example, next step forward would be examine double thingbattery size to 37 kilowatt hours, reducing grid reliance from 34% to 14% while running thegenerator once out of every three days - perhaps for an hour or two as shown in the HourlyEnergy Flow tab.Perhaps it is better to increase the solar array size instead. Increasing the array size from 16 kWto 24kW reduces grid reliance by 9% which is still pretty good. Where a similar reduction in gridreliance can be achieved by increasing the battery size or solar array size, consider whichincrease will reduce the required number of days the generator will run. Running the generator
30 days out of a previous 136 by increasing the battery bank will bring the client more peace ofmind than running the generator 50 out of the previous 136 days by increasing the size of thesolar array, if it comes down to a splitting the decision.The client may get down to a 5% grid reliance, but insist on eliminating generator chargesentirely. That might be the right decision, but it is useful to put it in terms of buying two versusfour 418.5 kilowatt hour batteries. The client, in the quest to reduce fossil fuels entirely from theproject site, might be dismayed by diminishing economic returns. Or the application may be soimportant as to necessitate the increased budget for the larger battery. For most, there will be apoint where some generator or grid reliance is worth the reduction in proj
Solar Battery Capacity Tool email s ales@fortresspower.com before sharing Check the Dealer Resources Page for the latest sizing tool version. There are a lack of battery sizing tools on the market. Many that exist are complicated or more focused on the commercial market, which is a grid-tied market. Developing an off-grid sizing


![Smarter Battery Crack [2022-Latest]](/img/13/eliamari.jpg)