Transcription
Linn BentonOSUCCOregon TechClackamas CCChemeketa CCTHE AFFORDABILITY CHALLENGEIN HIGHER EDUCATIONBEN CANNON, DIRECTOR, HIGHER EDUCATIONCOORDINATING COMMISSIONMarch 29, 2017Presented to: Joint Ways and Means, Education Subcommittee1
PRESENTATION SCHEDULEDay 1-2, March 27-28 Introduction to Higher Education Structure and Students,Progress toward State Goals, Quick Funding HistoryDay 3-4, March 29-30 Affordability: Key Factors, State Financial Aid Programs Introto Student PathwaysDay 5, April 3 Student Pathways and Transitions: Precollege, Inter-college,Private Postsecondary, WorkforceDay 6, April 4 Public TestimonyDays 7-8, April 5-6Day 9, April 10Days 10-11, April 1112 State Support for Community Colleges Community College presentations Public Testimony State Support for Public Universities University presentationsDay 12, April 13 Capital Construction, Other Missions of UniversitiesDay 13, April 17 Public TestimonyDay 14, April 18 OHSU Budget and Public TestimonyDay 15, April 19 An Integrated postsecondary agency, HECC Operations,ConclusionStart dates for presentation topics are tentative2
BUDGET PRIORITIES: AFFORDABILITYInvest in College Affordability and Opportunity Increasing and sustaining investments in Oregon's keyfinancial aid programs, to ensure the opportunity forpostsecondary success is within reach for Oregonianswho are struggling financially Increase state need-based aid (Oregon Opportunity Grant) for thelowest-income Oregonians, including working adultsFully fund the Oregon Promise grant program, providing nearlytuition-free access to community college for recent high schoolgraduates, protecting college access for families of all incomelevels3
OREGON OPPORTUNITY GRANT:PROPOSED EXPANSIONThe GRB proposes expanding the Oregon Opportunity Grant (OOG)by 8.1% above the 2015-17 LAB in order to ensure thatOregon’s highest-need students receive the necessary financialsupport to both consider entering and successfully completingcollege.Increasing the state’s investment to 151Mwill: Serve approximately 5,000 additional Oregonstudents facing affordability challenges4
OREGON PROMISE:PROPOSED CONTINUATIONThe GRB proposes continuation of the Oregon Promise at 39.7M inorder to support the upcoming high school and GED cohorts inaffording community college.Continuing the state’s investment at 39.7Mwill: Serve upcoming cohorts of eligible students (HSClasses of 2017 and 2018 and GED recipients)Two new cohorts of eligible students in the upcoming biennium Continuing funding for current recipients throughthe 2nd year of their community college studies or until theyreach 90 college credits, as the Oregon Promise was designed.5
AFFORDABILITYRELATED KEY PERFORMANCE METRICSKPM 13: Earnings of community college completersData will bepresentedwith HECCAgencyOperations,AppendixKPM 14: Earnings of community college leaversKPM 21: Earnings of public university bachelor's degree completersKPM 22: Percentage of resident enrolled students who are incurring unaffordable costs,CCs and universitiesKPM 23: Percentage of resident enrolled students who are incurring unaffordable costsadjusted with institutional aid, CCs and universitiesKPM 24: University graduate debtKPM 25: Student loan default rates (CC, universities, and all higher ed)KPM 26: Average cost of attendance, public universitiesKPM 27: Average statewide tuition and fees minus grant aid and net assessed tuition andfees per resident, undergraduate FTE (colleges and universities)The full 2016 Key Performance Metrics report for the HECC is available erformance.aspx6
DIMENSIONS OFCOLLEGEAFFORDABILITYWOU
AFFORDABILITY: A MULTI-DIMENSIONAL ISSUEStudent orfamily resourcesEarningsType ofdegree/certificate/majorCompletion,and time tocompletionTuitionOther costs ofattendance(room and board,textbooks, supplies,transportation etc.)Financial aid(state, federal,institutional, private)8
TERMS USED WHEN CALCULATING STUDENT COSTTuition and Fees: The primary cost for credits and coursework, which often includesinstructor costs, lab costs, library use, and a wide variety of campusservices. Typically, schools will price courses by the credit.Room and Board: Housing (e.g. dorms, apartments or houses) and food costs, whichcould include a meal plan offered by the school.Books andSupplies: Books, notebooks, and other required supplies. For example,health sciences students can expect to pay for medicalequipment, while graphic design students will need specialty artsupplies.Personal andTransportation: Personal items—such as a computer, clothes, personal careitems—and the cost of travel during school, as well as returninghome during holidays and breaks.Total Cost ofAttendance: The total amount it will cost to attend school—usually stated as ayearly figure. Generally includes tuition and fees; room and board;and allowances for books, supplies, transportation, loan fees,dependent care, and miscellaneous and personal expenses.Net Price: The amount a student pays to attend an institution in a singleacademic year, after subtracting student scholarships and grantsreceived. Scholarships and grants are forms of financial aid that donot have to be paid back.9
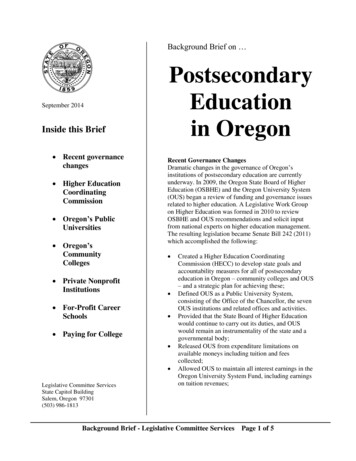
COMMUNITY COLLEGE TUITION AND FEES INRELATION TO STATE NEED-BASED AID 6,000 6,000 4,904 4,904 5,000 5,000 4,000 4,000 3,665 3,665 3,000 3,000 2,000 2,000 2,250 1,680 1,000 1,000 -2007-08 2008-09 2009-10 2010-11 2011-12 2012-13 2013-14 2014-15 2015-16 2016-172007-08 2008-09 2009-10 2010-11 2011-12 2012-13 2013-14 2014-15 2015-16 2016-17Tuition and fees adjusted for inflation (2015 dollars)and feesadjustedfor inflation(2015 (2015dollars)OOGTuitionmaximumgrantsize adjustedfor inflationdollars)Note: Tuition and fees based on 15 credits. Inflation adjustment based on Portland CPI-U, with the exception of 201617 which retains its current value. Source: HECC analysis of community college and HECC data.10
PUBLIC UNIVERSITY TUITION AND FEES INRELATION TO STATE NEED-BASED AID 10,000 8,000 9,115 9,115 6,718 6,654 6,000 4,000 2,250 2,000 - 2,0292007-08 2008-09 2009-10 2010-11 2011-12 2012-13 2013-14 2014-15 2015-16 2016-17Public university resident tuition and fees adjusted for inflation (2015 dollars)Public university resident tuition and fees adjusted for inflation (2015 dollars)Notes: Tuition and fees based on 15 credits. Inflation adjustment based on Portland CPI-U, with the exception of 201617 which retains its current value. Source: HECC analysis of university and HECC data.Slide corrected 4.12.1711
HOW ARE TUITION AND FEES SET?Public Universities Tuition and fees are generally set by the Boards of Trustees of eachuniversity on an annual basis. Each campus has community and stakeholder processes to inform andshape the proposed increases that are sent to Boards of Trustees. Should the combined annual increase in resident undergraduate tuitionand mandatory enrollment fees exceed 5% for a public university, theHECC or the Oregon Legislature must approve the increase.*Community Colleges Tuition and fees are set by the locally elected governing board of eachcommunity college on an annual basis.*The HECC uses a weighted average in tuition calculations when evaluating tuition increase proposals. Averagetuition figures in this presentation are based on the average of listed prices, not weighted average.12
STUDENTS FACE COST CHALLENGESBEYOND TUITIONTuition plus Mandatory fees HousingHECC survey: For the Fall 2014 term,how much did you spend ontextbooks?8% Food Transportation Supplies15% 0 - 100 100 - 250 250 - 50040%37% 500 Textbooks Dependent CareSource: HECC, Textbook Affordability Workgroup: Final Report and Recommendations, May 2015.13
AVERAGE STUDENT BUDGETS:OREGON POSTSECONDARY INSTITUTIONS, 2016-17RoomTuition and Books and andFeesSuppliesBoardPersonalExpenses Transportation TOTAL 9,115 1,280 11,077 2,895 24,367Community Colleges 4,904 1,474 8,719 2,691 17,788 1,116 10,968 2,654 46,476Public UniversitiesOregon Private* 31,738These are average estimates. Actual student budgets vary widely depending onstudent circumstances, from availability of housing options to the variety ofbooks/supplies costs for different programs of study.*Includes only Oregon degree-granting private institutions that are eligible for Oregon Opportunity Grant fundsSources: public tuition and fees--HECC Research & Data for Average; all other figures--HECC-OSAC, 2016 Standard StudentBudgets for Oregon Public Postsecondary Institutions: http://www.oregonstudentaid.gov/osac-doc/Student Budgets.pdf 14
MANY FORMS OF FINANCIAL AID:FEDERAL, INSTITUTIONAL, STATE, AND PRIVATEFederal Pell GrantOther Federal Grants(SupplementalEducationOpportunity Grants,TEACH grants, others)Federal Work StudyFederal StudentLoansInstitution or ProgramScholarships(Privately funded)Institutional FeeRemissions (TuitionDiscounts)Private Scholarshipsand GrantsCampus Work StudyPrivate Student LoansState Grants (OregonOpportunity Grant,Oregon Promise)15
FEDERAL PELL GRANT: SIGNIFICANT AID SOURCE FOROREGON LOW-INCOME STUDENTS AT PUBLIC INSTITUTIONSAverage Pell Grant toOregon students2015-16: 3,440Maximum Pell Grantto Oregon students2015-16: 5,775 The average Pell Grant in 201516 at Oregon’s public institutionswas over twice the size of theaverage Oregon OpportunityGrant The maximum Pell Grant in 201516 at Oregon’s public institutionswas 2.6 times the maximumOregon Opportunity GrantMore than half of all degrees awarded at Oregon public institutionsin 2015-16 went to students who have received a Pell Grant 61% of Associate degrees at community colleges 53% of Bachelor’s degrees at public universitiesSource: HECC analysis of student-level and program data. Pell Grant amount averages are for students of Oregon public16colleges and universities.
OREGON’S LARGEST STATE-ADMINISTEREDFINANCIAL AID PROGRAMSOregon Opportunity Grant(OOG): Oregon’s largest state-funded, needbased grant program, prioritizing thelowest-income Oregon students,including young students and adults,attending eligible public and privateOregon colleges and universities.Private ScholarshipsAdministered by OSAC: HECC-Office of Student Access andCompletion administers over 500privately-funded scholarships forOregon students, and hosts a centralapplication portal.Oregon Promise: Oregon’s new state grant program,providing grants toward tuition atOregon community colleges forrecent high school graduates andGED recipients.Other Programs: Chafee Grant (federal) for current orformer foster care youth, StudentChildcare Grant (state), and more.17
GRANT AID SUPPORTS STUDENT SUCCESSStudents whoreceive financialaid are more likelythan otherwisesimilar students to: Earn a higher grade point average Transfer from a two-year to a four-yearinstitution Stay in school longer (reduces dropouts) Earn a Bachelor's degreeEvery 1000 of need-based federal or state grant aidincreases graduation rates for low-income students byabout 2.5%.However, every 1000 in unsubsidized loans reducesgraduation rates by 5.6%Sources: -rates . http://www.ppic.org/content/pubs/report/R /texas-grant-symposium-presentation.pdf18
A CLOSER LOOK AT “NET PRICE”:COLLEGE COST MINUS GRANT AIDThe amount astudent pays toattend aninstitution in asingle academicyear, aftersubtractingscholarships andgrants received. “Cost of attendance”minus grant aid (e.g. Pell,Oregon OpportunityGrant, Oregon Promise,institutional aid) Varies by student Often expressed as anaverage19
NET PRICE RELATIVE TO OREGON FAMILY INCOME,OREGON COMMUNITY COLLEGE, 2014-15Net Price atOregon CommunityCollegePercent of IncomeRequired to PayNet Price 0—30,000 8,00047% 30,000—48,000 9,00023% 48,000—75,000 10,50017% 75,000—110,000 12,50014% 110,000 12,5007%IncomeStudents would have to work 17 hours a week, on average, at Oregonminimum wage to pay for the average net price to attend a public twoyear institution full time.Source: Penn Graduate School of Education, “2016 College Affordability Diagnosis for Oregon”, ty diagnosis/Oregon Affordability2016.pdf.20
NET PRICE RELATIVE TO OREGON FAMILY INCOME,OREGON PUBLIC UNIVERSITY, 2014-15Net Price at OregonPublic UniversityPercent of IncomeRequired to PayNet Price 0—30,000 12,50072% 30,000—48,000 13,50035% 48,000—75,000 16,00026% 75,000—110,000 19,50022% 110,000 20,00011%IncomeStudents would have to work 27 hours a week, on average, at Oregonminimum wage to pay the average net price to attend a public four-yearuniversity.Source: Penn Graduate School of Education, “2016 College Affordability Diagnosis for Oregon”, ty diagnosis/Oregon Affordability2016.pdf Public universities include: tuition, mandatoryfees, room/board and books minus all financial aid (federal, state and institutional).21
FOOD AND BASIC NEEDS INSECURITYFood insecurityhigh amongOregoniansFood insecurity even higheramong college students. Housinginsecurity is also a challenge.Approximately 16.1%of Oregon householdswere food insecurefrom 2013-15. Oregonshowed the sharpestincrease in foodinsecurity of any statebetween 2010-12 and2013-15.In a survey of studentsat 2- and 4-yearinstitutions in 12 states,48% reported foodinsecurity in theprevious 30 days.Insecurity was moreprevalent amongstudents of color andfirst-generationstudents.In a recent study of aselection ofcommunity colleges in24 states, 2/3 ofcommunity collegestudents were foodinsecure. About half ofcommunity collegestudents were housinginsecure, and 13 to 14percent werehomeless.Sources: *Oregon’s Spike in Food Insecurity Worst Among All States, Oregon Center for Public Policy, Nov. 2016 **Hunger oncampus, The Challenge of Food Insecurity for College Students, by James Dubick, Brandon Mathews, and Clare Cady, October2016. ***Hungry and Homeless in College. By Sara Goldrick-Rab, Jed Richardson, and Anthony Hernandez, Wisconsin HOPE Lab.March 2017.22
AFFORDABILITY FACTORS:UNDERGRADUATE COMPLETION RATESFor the full-time freshmancohort who began in2011-12 at Oregoncommunity colleges,17.3%graduated with an Associatedegree within 3 years(2014-15)For the full-time freshmanresident cohort who beganin fall 2009 at Oregonpublic universities,63.0%graduated with aBachelor’s degree within 6years (2014-15)Students whocomplete havehigher incomesand lowerunemploymentrates thanstudents who donot complete.*Student loanrepayment ratesare higheramong thosefrom higherincomebackgroundswho completetheir degrees.**Sources: Universities: HECC analysis of student-level data for full time, first-time freshmen. Community Colleges: IPEDS 3-year graduation rates include firsttime, full-time students seeking an associate’s degree and are aggregated data reported by Oregon’s community colleges to the U.S. Department ofEducation (https://nces.ed.gov/ipeds/Home/UseTheData). *Source: 2015 American Community Survey, U.S. Census. **Source: U.S. Department of23Education data, as reported in New America. 2017. “New Data Show Wider Repayment Gap Between Low- and High-Income Borrowers.”
AFFORDABILITY FACTORS:TIME TO COMPLETIONThe average community college studenttakes 4 years to complete an Associatedegree (2015-16).The average Oregon public universitystudent transferring from an Oregoncommunity college or another collegetakes 3 years at the university tocomplete a Bachelor’s degree (2014-15).The average Oregon public universitystudent entering directly from high schooltakes 4½ years to complete aBachelor’s degree (2014-15).Source: HECC analysis of student-level data. Transfer students are those who first enter universities with at least 24credits. Refers to 2015-16 Associate Degree graduates, and 2014-15 Bachelor’s Degree graduates.Increasedcredits translateto increasedcost.In addition,some financialprograms havetime limits. Forexample, thePell Grant lifetime limit is 6years (full timefull-yearenrollment),and theOregonOpportunityGrant limit is 4years (full timefull-yearenrollment).24
THE NEED FOR STUDENT LOANSThe majority of public postsecondarystudents in Oregon seeking financialaid do not receive enough to meetcollege costs without loans.Among Oregoncommunity college FAFSAfilers in 2015-16, 74.9% hadunmet need after grantaid and expected familycontribution are applied.Source: HECC Key Performance Metrics.Among Oregon’s publicuniversity FAFSA filers in2015-16, 83.0% had unmetneed after grant aid andexpected familycontribution are applied.25
STUDENT DEBT, OREGON’S GRADUATESAverage loan debt for Oregonstudents graduating from 4-yearinstitutions (public or private) isslightly lower than US average.63% of Oregon4-year graduatestake out loans,compared with 68%nationallyThe median loanamount for Oregon4-year graduates is 27,697, comparedto 30,100 nationallySources: The Institute for College Access & Success. 2016. "Project on Student Debt, State by State Data."http://ticas.org/posd/mapstate-data#.26
ADDRESSING AFFORDABILITY:A MULTI-DIMENSIONAL PROBLEM REQUIRES MULTI-DIMENSIONALSOLUTIONSMinimize the need for tuition increasesIncrease grant aid for the lowest-income studentsCreate low-cost pathways to lower-division and CTE coursesSmooth transfer pathways to four-year institutionsImprove graduation ratesReduce barriers to fields/careers associated with high earningsSupport innovations that reduce student costs (e.g. OpenEducational Resources)27
Date: March 29-30, 2017OREGON STATEADMINISTEREDFINANCIAL AIDPROGRAMSPRESENTED BY:JUAN BÁEZ-ARÉVALO,INTERIM DIRECTOR,HECC OFFICE OFSTUDENT ACCESS ANDCOMPLETION (OSAC)Oregon CoastCC
Date: March 29, 2017OREGONOPPORTUNITYGRANT:IMPACT ANDRECENTCHANGESXXUOregonTech
NEED-BASED AID:THE OREGON OPPORTUNITY GRANT (OOG)Oregon’s only state-funded, need-sensitive grantprogram to help low-income Oregonians,including young people and adults, achieve theiracademic goals. 2,250 grant toward postsecondary expenses* Used at eligible public and private Oregon colleges anduniversities.GOAL: To increase college enrollment, completion,and affordability for Oregon students who havedemonstrated financial need.*Based on full-time (12 credit/term) full-year enrollment in academic year 2016-17.30
OREGON OPPORTUNITY GRANT:STUDENTS SERVED IN CURRENT BIENNIUMAwards and Funds to Students, 2015-2017(projections)Estimated Total Awards toStudents81,181Estimated Total Funds ToStudents 137MOOG Source of Funds 2015-2017General Fund 131.0MLottery Funds* 6.1MOther Funds 1.2M*Current Lottery Funds are below DAS projections.A total of 81,181 OOGawards to students areprojected for thecurrent biennium,totaling 137M.A total of 41,852 lowincome students areprojected to receiveawards totalingapproximately 71M inthe 2016-17 academicyear.31
TOTAL OOG FUNDS DISBURSED OVER TIMETotal OOG Funds Disbursed - 2003-04 to 2015-16 90.0 80.0Millions of Dollars 70.0 64.3 60.0 50.0 40.0 30.0 20.0 10.0 0.0Source: HECC analysis. 2016-17 total funds are not yet available.32
OREGON OPPORTUNITY GRANT:IMPACT OF 2015-17 INVESTMENTThe Oregon Legislature’s 2015-17 investment made animpact, but many eligible applicants still do not receive thegrant.In 2014-15, the grant served 27% of eligible students. In2015-2016, grants reached more than 31% of eligiblestudents, and in 2016-17, grants are expected to reachapproximately 47% of eligible students. The improvement in 2016-17 reflects the increased funds and a change inthe number eligible due to the HB 2407 (2015) redesign.This is a successful program; however,it does not meet demand.33
OREGON OPPORTUNITY GRANT: FUNDING GAP180,000OOG Eligible Applicants vs. Recipients2007-08 to 2016-17* YTD160,000140,000OOG EligibleApplicants,88,216# Students120,000100,00080,000Fall Recipients,41,90060,00040,00020,00002007-08 2008-09 2009-10 2010-11 2011-12 2012-13 2013-14 2014-15 2015-16 2016-17*Source: HECC analysis.*Year-to-date estimates34
OREGON’S NATIONAL POSITION IN FUNDINGSTUDENT AID: ROOM TO GROW (2014-15)U.S.Oregon Oregonaverage amountrank2014-15Need-based grant dollarsper capita population 32 1433Need-based grant dollarsper 18-24 year old in state 333 1593372.2%91.9%9Percent of dollars awardedto public colleges anduniversitiesOregonranks inbottom thirdnationallyfor needbased grantdollars perOregonianThe great majority of need-based grantdollars go to students at publicinstitutions, furthering state investmentsin public colleges and universities tofoster equity and student success.Source: National Association of State Student Aid and Grant Programs. 2016. 46th Annual Survey Report on State-SponsoredStudent Financial Aid: 2014-15 Academic Year. http://www.nassgap.org/survey/NASSGAP Report 14-15 final.pdf35
TOTAL OOG RECIPIENTS & DISBURSEMENTS2015-16 BY SECTOROOG Disbursements by Sector60%50%40%30% 26.5 M disbursementsto Oregon communitycolleges in 2015-16supported 18,528students. 32.9 M disbursementsto Oregon publicuniversities in 2015-16supported 18,091students.20%10%0%Community CollegesPublic UniversitiesIndependent Colleges/UniversitiesSource: HECC analysis. 5.0 M disbursements toOregon privatecolleges anduniversities in 2015-16supported 2,645students.36
OREGON OPPORTUNITY GRANT:HB2407 RE-DESIGNThrough HB 2407 (2015), the OOG awardprocess was redesigned to ensure that thehighest-need students receive the financialsupport they need to access and succeed incollege. Key changes: Prioritize awards based on students’ financial need, notbased on when students applied. As a result, for 2016-17,primarily students with EFCs of 4,000 or less receivedawards. Award grants for a second year to those who continueto meet eligibility criteria and make a timely applicationfor renewal (Second-Year Guarantee will first beimplemented in 2017-18).37
OOG DISBURSEMENTS BY EFC: BEFORE AND AFTERHB 2407 RESTRUCTURELOWER EFC LOWER INCOMEOOG Funding by EFC Range,before and after restructureIn 2015-16, studentswith ExpectedFamily Contributions(EFCs) of 4,000 orless received a totalof 89.2% ( 57M) ofOOG funding. 46.4 37.0 12.5 15.1 7.5 9.2 6.9 0.1Zero 1- 1,1999 2,000- 3,999 4,000 and up2015-16 Funding (in M)2016-17 Estimated Funding (in M)Source: HECC analysis.In 2016-17, weproject they willreceive 99.8% of thefunding ( 71M),including all of the 7.0M year-overyear increase infunding for theprogram.38
March 30, 2017OREGONPROMISEGRANT:IMPACT ANDINITIAL DATAOregonCoast CCSWOCC
LOW-COST COMMUNITY COLLEGE:THE OREGON PROMISEOregon’s newly launched grant program provides grants tosupport most community college tuition costs for recent highschool graduates and GED recipients. Established by Senate Bill 81 (2015) to “provide a waiver of tuition forcommunity college courses.” Grants apply after federal and state grant aid. Students may be eligible for up to approximately two years at full-timeenrollment. Grant sizes ranged from minimum of 1,000 to maximum of 3,397 in 2016-17(based on average CC tuition)GOAL: To increase college enrollment, completion,and affordability for recent high school graduates andGED recipients.40
THE OREGON PROMISE:ELIGIBILITY CRITERIA FOR GRANTSBe a recent Oregonhigh school graduateor GED recipientBe an Oregon residentat least 12 months priorto attendanceHave 2.5 cumulativeGPA or higherPlan to attend anOregon communitycollege within 6months of graduationMust not have more than90 college creditscompleted or attempted41
OREGON PROMISE: APPLICATION FUNNEL 2016After launching the program and marketing its availabilityin 2015-16, OSAC processed 19,223 Oregon Promise applications.19,223 Oregon Promise ApplicationsSubmitted10,459 applicants meteligibility requirements,completed a valid FAFSA or OregonStudent Aid Application (ORSAA)and listed at least one OregonCommunity College1,091 enrolled in6,787 studentsenrolledin Oregon communitycolleges and receivedthe grantpublic universities42
THE OREGON PROMISE: INITIAL ESTIMATE OFIMPACTFall 2014Number of recent highschool graduates whoenrolled at a communitycollege, 6 credits5,709Fall 20166,553 844 recenthigh schoolgraduates1Including GED students, a total of 6,787 students enrolled in the Oregon Promise in Fall, 2016.1The actual increase in recent high school graduates from 2014 to 2016 was likely much greater.Due to data resolution issues, the 2014 figure includes all same-year high school graduates,including those who had a high school GPA lower than 2.5. The 2016 figure includes OregonPromise recipients only. It does not include community college students who were recent highschool graduates but ineligible for the Promise due to a GPA lower than 2.5 or other reasons.43
OREGON PROMISE: GRANT AMOUNT IN RELATION TOEXPECTED FAMILY CONTRIBUTION (EFC)LOWER EFC LOWER INCOMEStudent A: Lower Expected Family ContributionOREGONOPPORTUNITYGRANTPELL GRANTOREGONPROMISEGRANTStudent B: Higher Expected Family ContributionPELL nt C: Highest Expected Family ContributionOregon Promise covers tuition, up to 12 credits per term.Source: HECC analysis of student-level data (Oregon Promise recipients), 2016.44
OREGON PROMISE: STUDENTS SERVEDDistribution of Oregon Promise recipients by Pell award amountLowFamily IncomeHigh 4,000Number of students53%3,0002,00025%1,00012%0Full Pell( 5815)Moderate Pell( 3466-5814)10%Low Pell( 1-3465)No PellSource: HECC analysis of student-level data (Oregon Promise recipients), 2016.Note: Number of students total 6,745; data for remaining 42 students were not submitted in at the time of analysis.45
PROJECTED OREGON PROMISE AID, BY EFCQUINTILE, 2016-17Projected awards,by EFC Quintile(Each quintile contains1,327 projected ORPrecipients)EFC rangeProjected ORPstate funding*Proportion of totalORP state funding*First 0 1.0M7.8%Second 0 - 2,845 1.1M8.5%Third 2,846 - 8,937 3.1M23.8%Fourth 8,938 - 19,839 3.9M29.9%Fifth 19,840 and above 3.9M30.0%*Assuming no term-to-term enrollment fluctuation, 2016-17Source: HECC analysis of student-level data (Oregon Promise recipients), 201646
HIGH SCHOOL GRADUATES, AND OREGON PROMISERECIPIENTS, BY RACE-ETHNICITY2016 highschoolgraduatesOregonpromiserecipientsAfrican American or Black2.31.3American Indian/Alaska Native1.41.0Asian American4.74.018.619.6Pacific Islander0.50.5Two or more racial/ethnic groups4.84.9White, spanic*Note: Public high school students or their families identify students’ racial-ethnic groups. If they decline to state,school staff identify students’ racial-ethnic group. Oregon Promise students self-identify their own race on theOregon Promise application and 3.5 percent of these declined to state.Source: Oregon Department of Education report of high school seniors and graduates. HECC analysis of studentlevel data on Oregon Promise recipients47
OREGON PROMISE RECIPIENTS BY COLLEGENumber of Oregon Promise 2413659941240Source: HECC analysis of student-level data (Oregon Promise recipients), 2016.225195216948
IMPACT ON FIRST-GENERATION STUDENTSIn a 2016 survey of 18-19 year old Oregonians whoapplied for financial aid: Nearly a third of first-generation Oregon Promise recipients agreedthey would not have gone to college without the program, comparedwith 18 percent of non-first-generation Oregon Promise recipients. 75 percent of first-generation students who were familiar with theOregon Promise agreed the program helped them see that collegecould be affordable and made them think more about going tocollege.In fall 2016, an estimated 44 percent of Oregon Promiserecipients were first-generation college students.Source: Education Northwest; Fulfilling the Promise? Early Findings on Oregon’s New College Grant Programand HECC analysis of student-level data (Oregon Promise recipients).49
STUDENT VOICES“Oregon Promise has made it possible for me to go tocollege and avoid crushing [student] debt If theOregon Promise grant is renewed (PLEASE!), and I amable to get two years of community college tuition paidfor, it is a huge head start in my quest for a bachelor’sdegree in nursing.”“My dad was unemployed for four years, and we wereforced to spend all of my parents’ retirement and mycollege savings to survive. With Oregon Promise, I’m ableto attend college without putting excessive pressure onmy family, and they can rebuild their retirement!”Source: Education Northwest; Fulfilling the Promise? Early Findings on Oregon’s New College Grant Program50
OREGON PROMISE GRANT:KEY FINDINGS FROM FIRST TERMResearch questionKey findingsHas Oregon Promise changed Oregon high schoolgraduates’ enrollment inhigher education?Community college enrollment ratesdeclined slightly overall, but preliminaryresults suggest that they rose among recenthigh school graduates University enrollment rates declined slightlyWho is participating in Oregon Promise, and who is not?About half of Oregon Promise recipientscome from lower income families (i.e., areeligible for a Pell grant), and about half donotTotal participation Most Oregon Promise dollars go to recipientswith higher incomes In fall 2016, 6,787 students received anOregon Promise grant, and the awardstotaled over 4 millionSource: HECC analysis of student-level data (Oregon Promise recipients).51
OTHERGOVERNMENTFINANCIAL AIDPROGRAMSADMINISTEREDBY HECC-OSACOSU
OREGON STUDENT CHILDCARE GRANTState grant to offset college student childcareexpenses. Very small program served 87 studentparents in 2015-16. Amounts vary depending on ages and number of childrenneeding care. Priority is given to prior year recipients who reapply, then tonew eligible applicants with financial need who are close tocompleting their academic goals.Eligibility criteria: Oregon resident with a child or legal
recent high school graduates and GED recipients. Private Scholarships Administered by OSAC: HECC-Office of Student Access and Completion administers over 500 privately-funded scholarships for Oregon students, and hosts a central application portal. Other Programs: Chafee Grant (federal) for current or former foster care youth, Student